Technical Memorandum
DATE: March 3, 2016
TO: Boston Region Metropolitan Planning Organization
FROM: Nicholas Hart, Principal Transportation Planner
RE: Title VI Service Equity Analysis: Methodology Development
The Federal Transit Administration (FTA) Circular 4702.1B provides guidelines and requirements for implementing US Department of Transportation regulations pertaining to Title VI of the Civil Rights Act of 1964 (49 CFR 21). The Circular requires large transit providers (those that operate 50 or more fixed-route vehicles in peak service and that are located in an urbanized area with a population of 200,000 or more) to conduct a service equity analysis to evaluate, prior to implementing any major service change, whether the planned change would have a discriminatory impact based on race, color, or national origin. Although low-income populations are not a protected class under Title VI, the FTA also requires transit providers to evaluate whether low-income populations would bear a disproportionate burden of the changes, in recognition of the inherent overlap between Title VI and environmental justice principles.
The FTA guidelines for conducting the analysis recommend that transit providers measure potential disparate impacts and disproportionate burdens by comparing the proportion of persons in the protected class who are adversely affected by the service change with the proportion of persons not in the protected class who are adversely affected by the service change, using either ridership or population data. While an analysis based on ridership data has the potential to provide the most meaningful impact analysis for changes to existing services, it is costly and difficult to obtain statistically reliable results from passenger surveys, and such surveys do not account for potential riders who could be affected by new, extended, or rerouted services. Alternatively, an analysis based on the FTA guidelines for using population is limited to a cursory look at the population of the area surrounding the location of the service change, and does not account for riders who may transfer to the area of the service change from other parts of the network, or for the existence of other transit options.
This memorandum investigates the shortcomings and inconsistencies in the FTA guidelines for conducting Title VI service equity analyses and develops an improved method by accounting for: (1) riders who may be indirectly affected by the service change, not just those who currently use the service or who reside near the service; (2) the varying magnitude of adverse effects attributable to different types of service changes; and (3) the availability of alternative transit options that might reduce the potential adverse effects of a service change. To compare the results obtained using the developed methodology with the FTA-recommended methodology, MPO staff analyzed a hypothetical major service change, in which service on MBTA bus Routes 1 and CT1 would be eliminated.
The remainder of this memorandum contains the following sections:
The FTA requires service equity analyses to be performed for a proposed service change that meets or exceeds the criterion outlined in the transit provider’s major service change policy. A transit provider's major service change criterion is typically presented as a numerical standard, reflective of a threshold that is most likely to yield a meaningful result in light of the transit provider’s system characteristics. As an example, the MBTA defines major service changes at the individual route level as ones that would have a significant effect on riders, resource requirements, route structure, or service delivery. This includes:
The MBTA defines major service changes systemwide in the "Public Process for Changing MBTA Fares, and/or Fare Structure or Major Service Reductions" policy, last updated in 2009, as "a systemwide reduction of 10% or more, as measured by typical daily usage."
FTA guidelines require that transit providers define and analyze the adverse effects related to the major changes in service that would be deemed significant, measured by the change between existing and proposed service levels, while acknowledging the fact that certain types of changes would have greater adverse impacts than others. No guidance is given on how to quantify the degrees of impacts that vary with the type of service change. Transit providers are required to develop a policy for measuring disparate impacts that establishes a threshold for determining when adverse effects of service changes are borne disproportionately by minority populations that are affected, or that could possibly be affected, by the service change. The MBTA uses the following thresholds for assessing disparate burdens or benefits and disproportionate burdens or benefits of major service changes:
For a transit agency’s assessment of the impacts of a proposed service change against the thresholds set forth in that transit provider’s disparate impact policy, the FTA provides the option of conducting the analysis using ridership data or service area population data. For assessing the impacts of making headway changes, eliminating a route, or increasing service to an area currently served by the transit system, the FTA suggests that the appropriate comparison population would likely be ridership, and the transit provider should compare the demographic characteristics of the ridership of the affected route(s) with the demographic characteristics of the ridership of the system. For assessing the impacts of a proposed new service to a neighborhood or corridor not served by the transit system, the FTA suggests that the appropriate comparison population would likely be the population of the service area, and the transit provider should compare the demographic characteristics of the population of census blocks or block groups served by the proposed route(s) with the demographic characteristics of the population in the service area.
An analysis using ridership data has the benefit of assessing impacts on people who are directly affected by the proposed service change (transit riders). However, this approach is inconsistent with the FTA’s requirement to also account for people who could possibly be affected by the service change (potential riders), as the demographic makeup of potential riders is not always the same as the demographic makeup of surveyed riders.
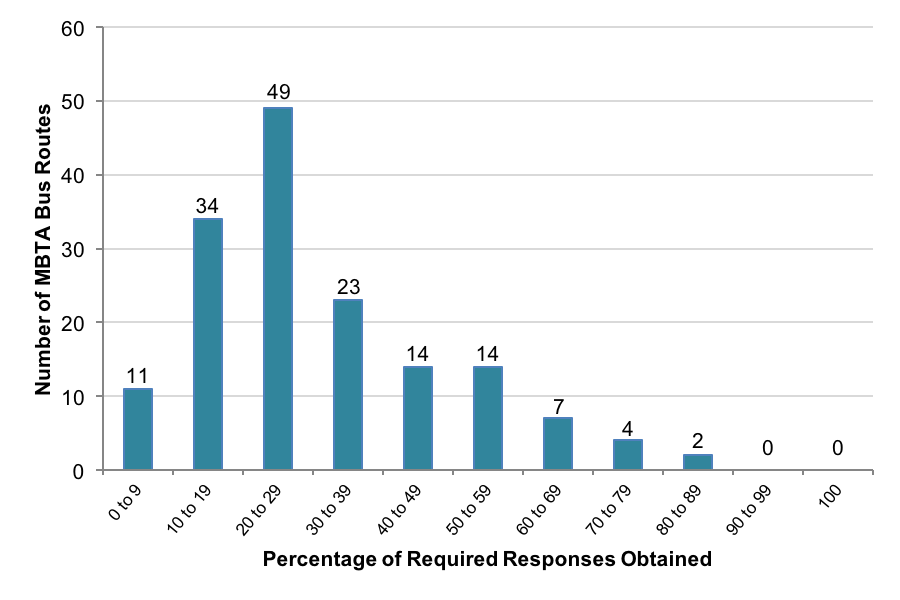
In addition, it is extremely costly and difficult to obtain comprehensive and statistically significant ridership data at the route level. Figure 1 shows that for the MBTA 2008–09 Systemwide Passenger Survey, none of the 158 bus routes surveyed had enough survey responses to obtain 95 percent confidence at a 5 percent confidence interval (assuming that all of the questions had been answered on each returned survey). Figure 2 shows that only 57 routes had enough responses when the confidence interval was increased to 10 percent.
FIGURE 1
Percentage of Required Responses Obtained from the MBTA 2008–09 Systemwide Passenger Survey for a 95 Percent Confidence Level at a
5 Percent Confidence Interval for the MBTA Bus Network
Source: MBTA 2008–09 Systemwide Passenger Survey.
Note: The number of required responses assumed returned surveys would be 100 percent complete.
FIGURE 2
Percentage of Required Responses Obtained from the MBTA 2008–09 Systemwide Passenger Survey for a 95 Percent Confidence Level at a
10 Percent Confidence Interval for the MBTA Bus Network

Source: MBTA 2008–09 Systemwide Passenger Survey.
Note: The number of required responses assumed returned surveys would be 100 percent complete.
The percentages of required responses obtained shown in Figure 1 and Figure 2 were calculated with the assumption that returned surveys were 100 percent complete. However, as presented in Table 1, the non-response rates for the socioeconomic and demographic questions in the 2008–09 survey ranged from 5.0 percent to 14.3 percent. Non-responses to these questions, which are required for Title VI analysis, further increase the number of survey returns needed and, therefore, the total cost of the overall survey effort.
TABLE 1
Non-Response Rates to Socioeconomic and Demographic Questions in the MBTA 2008–09 Systemwide Passenger Survey
Mode |
Total Response |
Income – Total Non- Response |
Race – Total Non- Response |
Hispanic – Total |
Income – Percentage |
Race – Percentage |
Hispanic – Percentage |
Rapid Transit |
22,767 |
2,413 |
1,143 |
1,316 |
10.6% |
5.0% |
5.8% |
Bus |
12,313 |
1,764 |
838 |
1,016 |
14.3% |
6.8% |
8.3% |
Source: MBTA 2008–09 Systemwide Passenger Survey.
When quality ridership information is not available or when the impact on potential riders will be considered, the equity analysis can be conducted using population data. For analysis that relies on population data, the FTA advises that the choice of a dataset should be the smallest geographic area with reasonable access to the bus stop or rail station. The FTA guidelines state that riders are generally willing to walk up to one-quarter mile to a bus stop and one-half mile to a light or heavy rail station, so the demographics of the neighborhoods within those distances should be the datasets used for the analysis.
However, an analysis based on neighborhood demographics within the prescribed radius of a stop or station does not account for riders who may transfer to the service from other parts of the network. For MBTA bus riders systemwide, only about 47 percent complete their trip exclusively on one route, while the remaining 53 percent transfer to or from another bus or rapid transit route to complete their trip. As shown in Table 2 and Table 3, a Title VI service equity analysis that is restricted to the population residing near a bus route might not be inclusive of the 53 percent of systemwide bus riders or the 41 percent of systemwide rapid transit riders who transfer to bus and rapid transit services outside of their residential area.
TABLE 2
Number of Transfers Made within the MBTA Bus and
Rapid Transit Network for Linked Trips
That Include a Bus Trip
Number of Transfers |
Total |
Percent |
0 |
90,280 |
47.36% |
1 |
76,863 |
40.32% |
2 |
20,201 |
10.60% |
3 |
2,898 |
1.52% |
4 |
365 |
0.19% |
5 |
35 |
0.02% |
Source: MBTA 2008–09 Systemwide Passenger Survey.
Note: The number of transfers includes those from bus to bus, bus to rapid transit, and rapid transit to bus.
TABLE 3
Number of Transfers Made within the MBTA Bus
and Rapid Transit Network for Linked Trips
That Include a Rapid Transit Trip
Number of Transfers |
Total |
Percent |
0 |
150,246 |
58.79% |
1 |
85,093 |
33.29% |
2 |
18,612 |
7.28% |
3 |
1,564 |
0.61% |
4 |
63 |
0.02% |
Source: MBTA 2008–09 Systemwide Passenger Survey.
Note: The number of transfers includes those from rapid transit to rapid transit, rapid transit to bus, and bus to rapid transit.
MPO staff sought to develop a method for quantifying the adverse effects of a service change that would: (1) utilize population data representing all of the riders affected by the service change (those who have direct access as well as riders who transfer to the service being changed), (2) objectively and consistently quantify the varying degrees of adverse effects of different types of service changes, and (3) account for the availability of alternative transit options that might reduce the potential adverse effects of the service change.
MPO staff developed a methodology for quantifying adverse effects by modifying the Transit Opportunity Index (TOI) created by Mamun et al.1 TOI is a measure of transit supply provided to a geographic area within a transit network. It accounts for three categories of transit opportunity: access opportunity, trip opportunity, and temporal comparability.
The original development of the Transit Opportunity Index by Mamun et al. was motivated by the desire to develop a metric that could compare the distribution and level of transit supply offered by different transit agencies, domestic and foreign. Therefore, the original method for calculating the TOI was designed to use data that are widely available from most transit agencies. MPO staff developed a modified version of the TOI (called MTOI) that capitalizes on additional information available to the MBTA and Boston Region MPO, such as passenger counts and vehicle loads collected by automatic passenger counters (APCs), running times collected by onboard GPS systems, and GIS shapefiles of the region’s pedestrian network. The procedure for calculating the MTOI is depicted in Figure 3.
FIGURE 3
The Modified Transit Opportunity Index
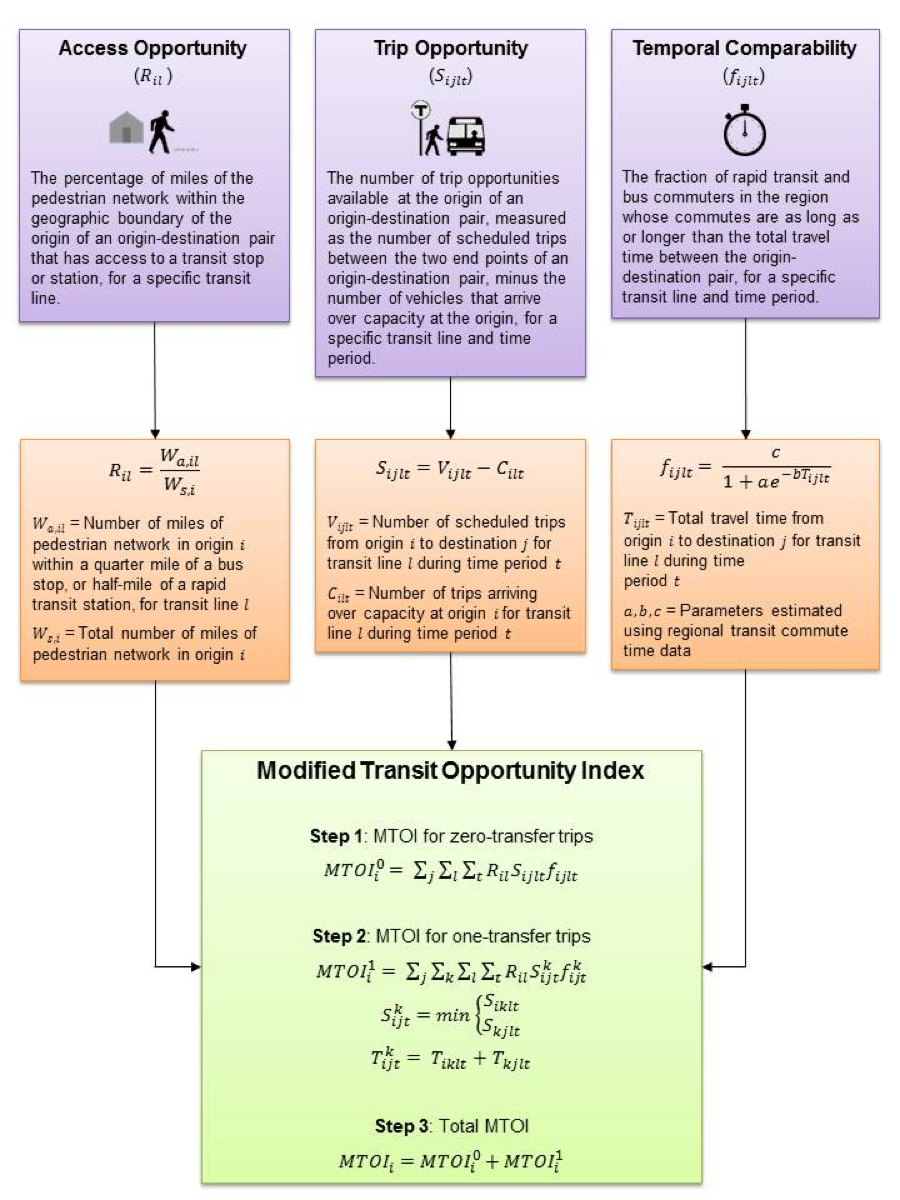
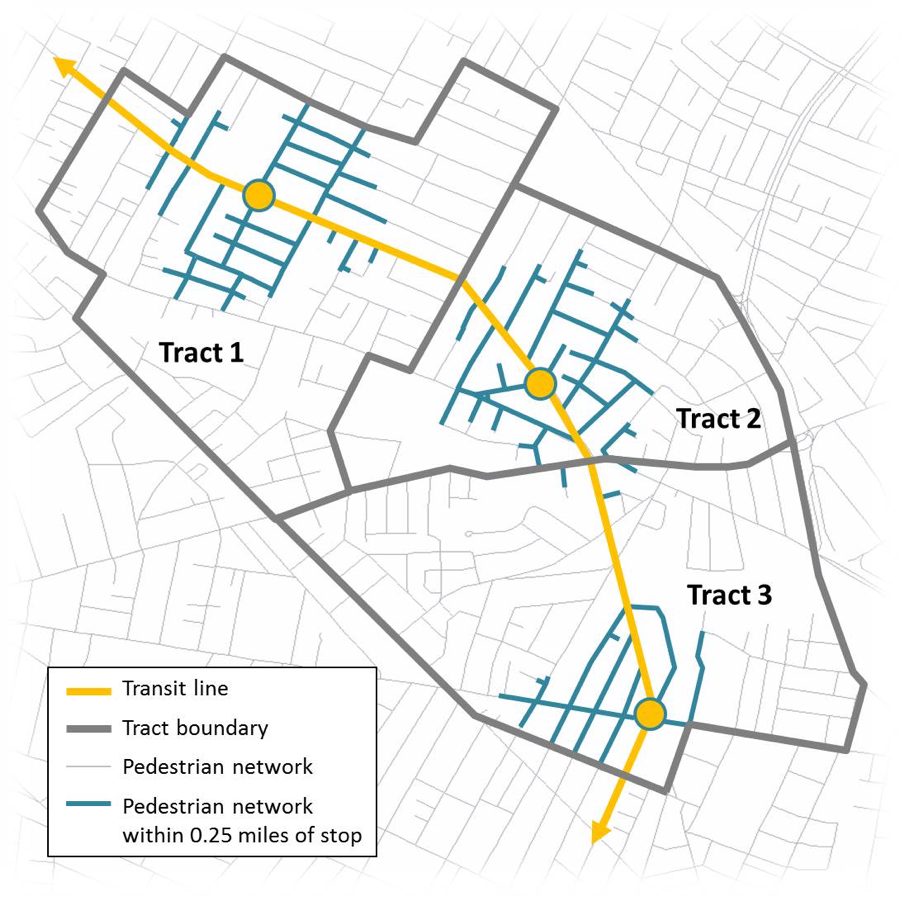
The access opportunity component of the MTOI is defined as the percentage of miles of the pedestrian network within the geographic boundary of the origin of an origin-destination pair that has access to a transit stop or station, for a specific transit line. This is calculated as the number of miles along the pedestrian network within the geographic boundary of the origin of an origin-destination pair that is within reach of a transit stop or station (0.25 mile for bus service, 0.50 mile for rapid transit service) divided by the total number of pedestrian network miles within the geographic boundary of the origin of an origin-destination pair.
![]()
![]() = Access opportunity rating of origin
= Access opportunity rating of origin ![]() for transit line
for transit line ![]()
![]() = Number of miles of pedestrian network in origin
= Number of miles of pedestrian network in origin ![]() within a quarter mile of a bus stop, or half mile of a rapid transit station, for transit line
within a quarter mile of a bus stop, or half mile of a rapid transit station, for transit line ![]()
![]() = Total number of miles of pedestrian network in origin
= Total number of miles of pedestrian network in origin ![]()
Data needed to calculate the access opportunity component of the MTOI include stop location shapefiles, census tract shapefiles, and roadway and pedestrian network shapefiles.
The trip opportunity component of the MTOI is defined as the number of trip opportunities available at the origin of an origin-destination pair, measured as the number of scheduled trips between the two end points of an origin-destination pair, minus the number of vehicles that arrive over capacity at the origin, for a specific transit line and time period.
![]()
![]() = Trip opportunity rating from origin
= Trip opportunity rating from origin ![]() to destination
to destination ![]() for transit line
for transit line ![]() during time period
during time period ![]()
![]() = Number of scheduled trips from origin
= Number of scheduled trips from origin ![]() to destination
to destination ![]() for transit line
for transit line ![]() during time period
during time period ![]()
![]() = Number of trips arriving over capacity at origin
= Number of trips arriving over capacity at origin ![]() for transit line
for transit line ![]() during time period
during time period ![]()
Average vehicle loads can be calculated for each trip using APC data, and then compared to the transit agency’s vehicle load standard to determine the average number of vehicles that arrive over capacity at each origin.
Data needed to calculate the trip opportunity component of the MTOI include automated passenger counter data, transit vehicle capacity, and transit route schedules.
Temporal Comparability
The temporal comparability component of the MTOI starts with an assessment of the total travel time between the end points of an origin-destination pair, for a specific transit line and time period. Total travel time comprises four components: access time, wait time, in-vehicle travel time, and egress time.
![]()
![]() = Total travel time from origin
= Total travel time from origin ![]() to destination
to destination ![]() for transit line
for transit line ![]() during time period
during time period ![]()
![]() = Access time to a stop or station
= Access time to a stop or station
![]() = Wait time at a stop or station
= Wait time at a stop or station
![]() = In-vehicle travel time
= In-vehicle travel time
![]() = Egress time from a stop or station
= Egress time from a stop or station
Information on access and egress times for a specific transit line can be collected through passenger surveys. Average wait times can be calculated as a function of service frequency. In-vehicle travel time data can be collected with onboard GPS units, and can be averaged for specific time periods, accounting for factors that decrease the travel time of transit vehicles, such as longer dwell times for rapid transit vehicles and buses when vehicles are crowded, traffic congestion that might cause a decrease in bus speeds during peak periods, and subway congestion that might cause a decrease in rapid transit speeds during peak periods.
The total travel time between the end points of an origin-destination pair is input into a connectivity decay function to estimate the relationship between travel time and connectivity. The connectivity decay function calculates the fraction of rapid transit and bus commuters in the region whose commutes are as long as or longer than the total travel time being assessed. This represents a comparison of travel time between the specified origin and destination and all transit trips in the region. The output of this function decreases as travel time increases, representing a decrease in connectivity between an origin and destination as travel time increases.
![]()
![]() = Connectivity decay factor from origin
= Connectivity decay factor from origin ![]() to destination
to destination ![]() for transit line
for transit line ![]() during time period
during time period ![]()
![]() = Total travel time from origin
= Total travel time from origin ![]() to destination
to destination ![]() for transit line
for transit line ![]() during time period
during time period ![]()
![]() = Parameters estimated using regional transit commute time data
= Parameters estimated using regional transit commute time data
The connectivity decay function is calibrated to fit the travel time profile of bus and rapid transit commuters in the transit agency’s region. Figure 4 shows the connectivity decay function fit to bus and rapid transit commute time data for the Boston metropolitan area.
FIGURE 4
Bus and Rapid Transit Commute Times in the Boston Metropolitan Area
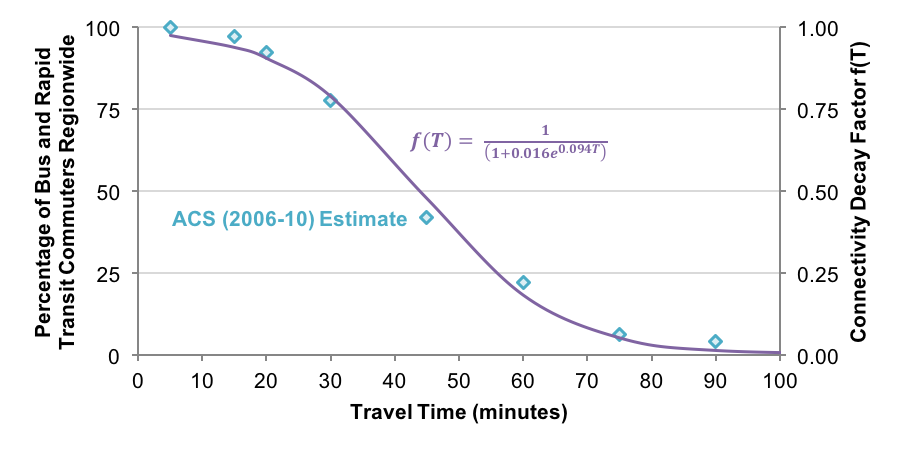
Source: U.S. Census Bureau: American Community Survey 2006–10 five-year estimates.
![]() = Connectivity decay factor, expressed as the percentage (in decimal form) of bus and rapid transit commuters in the region whose commutes are as long as or longer than the amount of time
= Connectivity decay factor, expressed as the percentage (in decimal form) of bus and rapid transit commuters in the region whose commutes are as long as or longer than the amount of time ![]() .
.
Data needed to calculate the temporal comparability component of the MTOI include regional transit commute time data; transit vehicle run times from onboard GPS; and average access, wait, and egress times by transit route.
The three components of transit access (access opportunity, trip opportunity, and temporal comparability) are combined to form the total MTOI score for the origin of an origin-destination pair. Higher MTOI scores represent a higher level of transit opportunity. For an origin that connects to a destination with a zero-transfer trip, the MTOI is calculated by summing the factor of access opportunity, trip opportunity, and temporal comparability ratings for each combination of destination, transit route, and time period:
![]()
![]() = Modified Transit Opportunity Index of origin
= Modified Transit Opportunity Index of origin ![]() , zero transfers
, zero transfers
![]() = Access opportunity rating of origin
= Access opportunity rating of origin ![]() for transit line
for transit line ![]()
![]() = Trip opportunity rating from origin
= Trip opportunity rating from origin ![]() to destination
to destination ![]() for transit line
for transit line ![]() during time period
during time period ![]()
![]() = Connectivity decay factor from origin
= Connectivity decay factor from origin ![]() to destination
to destination ![]() for transit line
for transit line ![]() during time period
during time period ![]()
For a one-transfer trip, the number of trip opportunities for a path connecting an origin to a destination is set to the number of trip opportunities between the origin and the transfer location, or between the transfer location and the destination, whichever is less. The total travel time between the origin and destination is equal to the total travel time between the origin and the transfer location plus the total travel time between the transfer location and the destination, accounting for the four components of travel time on each segment: access, wait, in-vehicle, and egress time. Many practitioners and researchers include a transfer time penalty when calculating the total travel time. A transfer penalty is represented in the MTOI by including the average egress time of all riders (transferring or not) in the total travel time calculation for the trip segment from the origin to the transfer location and the average access time of all riders (transferring or not) in the segment from the transfer location to the final destination. For an origin that connects to a destination with a one-transfer trip, the MTOI is calculated by:
![]()
![]()
![]()
![]() = Modified Transit Opportunity Index of origin
= Modified Transit Opportunity Index of origin ![]() , one transfer
, one transfer
![]() = Access opportunity rating of origin
= Access opportunity rating of origin ![]() for transit line
for transit line ![]()
![]() = Connectivity decay factor from origin
= Connectivity decay factor from origin ![]() to destination
to destination ![]() during time period
during time period ![]() with transfer at
with transfer at ![]()
![]() = Trip opportunity rating from origin
= Trip opportunity rating from origin ![]() to destination
to destination ![]() for transit line
for transit line ![]() during time period
during time period ![]() with transfer at
with transfer at ![]()
![]() = Trip opportunity rating from origin
= Trip opportunity rating from origin ![]() to transfer location
to transfer location ![]() for transit line
for transit line ![]() during time period
during time period ![]()
![]() = Trip opportunity rating from transfer location
= Trip opportunity rating from transfer location ![]() to destination
to destination ![]() for transit line
for transit line ![]() during time period
during time period ![]()
![]() = Total travel time from origin
= Total travel time from origin ![]() to destination
to destination ![]() during time period
during time period ![]() with transfer at
with transfer at ![]()
![]() = Total travel time from origin
= Total travel time from origin ![]() to transfer location
to transfer location ![]() for transit line
for transit line ![]() during time period
during time period ![]()
![]() = Total travel time from transfer location
= Total travel time from transfer location ![]() to destination
to destination ![]() for transit line
for transit line ![]() during time period
during time period ![]()
The MTOI may be calculated for trips containing any number of transfers in a similar manner. However, the computational effort required to calculate the MTOI for trips with two or more transfers far outweighs the marginal enhancement it would add to the analysis. Tables 2 and 3 show that 87.7 percent of linked trips containing a bus segment and 92.1 percent of linked trips containing a rapid transit segment are completed with no transfer or with one transfer. Therefore, the total MTOI score for an origin is calculated as a sum of the MTOI score for zero-transfer trips and the MTOI score for one-transfer trips:
![]()
![]() = Total Modified Transit Opportunity Index of origin
= Total Modified Transit Opportunity Index of origin ![]()
![]() = Modified Transit Opportunity Index of origin
= Modified Transit Opportunity Index of origin ![]() , zero transfers
, zero transfers
![]() = Modified Transit Opportunity Index of origin
= Modified Transit Opportunity Index of origin ![]() , one transfer
, one transfer
This section demonstrates how to calculate the MTOI for a small segment along a hypothetical single transit line with no transfer opportunities. The configuration of the hypothetical transit service is shown in Figure 5.
FIGURE 5
Configuration of a Hypothetical Transit Service
The example calculation of the access opportunity component of the MTOI for the hypothetical transit service uses the parameters in Table 4. The calculation steps are shown in Table 5.
TABLE 4
Access Opportunity Parameters
for the Hypothetical Transit Service
Parameter |
Tract 1 |
Tract 2 |
Tract 3 |
|
4 |
4 |
2 |
|
10 |
8 |
10 |
![]() = Number of miles of pedestrian network in origin
= Number of miles of pedestrian network in origin ![]() within a quarter mile of a bus stop, or half mile of a rapid transit station, for transit line
within a quarter mile of a bus stop, or half mile of a rapid transit station, for transit line ![]()
![]() = Total number of miles of pedestrian network in origin
= Total number of miles of pedestrian network in origin ![]()
TABLE 5
Example Calculation of Access Opportunity (![]() )
)
for the Hypothetical Transit Service
Parameter |
Tract 1 |
Tract 2 |
Tract 3 |
|
|
|
|
![]() = Number of miles of pedestrian network in origin
= Number of miles of pedestrian network in origin ![]() within a quarter mile of a bus stop, or half mile of a rapid transit station, for transit line
within a quarter mile of a bus stop, or half mile of a rapid transit station, for transit line ![]()
![]() = Total number of miles of pedestrian network in origin
= Total number of miles of pedestrian network in origin ![]()
The example calculation of the trip opportunity component of the MTOI for the same hypothetical service uses the parameters given in Tables 6 and 7. The calculation steps are shown in Table 8.
TABLE 6
Number of Scheduled Trips from the Origin to the Destination (![]() )
)
for the Hypothetical Transit Service
Census Tract |
Tract 1 (Destination) |
Tract 2 (Destination) |
Tract 3 (Destination) |
Tract 1 (Origin) |
10 |
10 |
|
Tract 2 (Origin) |
6 |
10 |
|
Tract 3 (Origin) |
6 |
6 |
TABLE 7
Number of Trips Arriving Over Capacity at the Origin (![]() )
)
for the Hypothetical Transit Service
Census Tract |
Tract 1 (Destination) |
Tract 2 (Destination) |
Tract 3 (Destination) |
Tract 1 (Origin) |
1 |
1 |
|
Tract 2 (Origin) |
0 |
2 |
|
Tract 3 (Origin) |
0 |
0 |
TABLE 8
Example Calculation of Trip Opportunity
between the Origin and the Destination (![]() )
)
for the Hypothetical Transit Service
Census Tract |
Tract 1 (Destination) |
Tract 2 (Destination) |
Tract 3 (Destination) |
Tract 1 (Origin) |
10 – 1 = 9 |
10 – 1 = 9 |
|
Tract 2 (Origin) |
6 – 0 = 6 |
10 – 2 = 8 |
|
Tract 3 (Origin) |
6 – 0 = 6 |
6 – 0 = 6 |
![]()
![]() = Number of scheduled trips from origin
= Number of scheduled trips from origin ![]() to destination
to destination ![]() for transit line
for transit line ![]() during time period
during time period ![]()
![]() = Number of trips arriving over capacity at origin
= Number of trips arriving over capacity at origin ![]() for transit line
for transit line ![]() during time period
during time period ![]()
The example calculation of the temporal comparability component of the MTOI for the hypothetical transit service uses the parameters given in Tables 9, 10, 11, and 12. The first step for calculating the temporal comparability component is shown in Table 13.
TABLE 9
Access Time to Stop (![]() )
)
for the Hypothetical Transit Service
Census Tract |
Tract 1 (Destination) |
Tract 2 (Destination) |
Tract 3 (Destination) |
Tract 1 (Origin) |
4 |
4 |
|
Tract 2 (Origin) |
4 |
4 |
|
Tract 3 (Origin) |
4 |
4 |
TABLE 10
Wait Time at Stop (![]() )
)
for the Hypothetical Transit Service
Census Tract |
Tract 1 (Destination) |
Tract 2 (Destination) |
Tract 3 (Destination) |
Tract 1 (Origin) |
3 |
3 |
|
Tract 2 (Origin) |
5 |
3 |
|
Tract 3 (Origin) |
5 |
5 |
TABLE 11
In-Vehicle Travel Time (![]() )
)
for the Hypothetical Transit Service
Census Tract |
Tract 1 (Destination) |
Tract 2 (Destination) |
Tract 3 (Destination) |
Tract 1 (Origin) |
7 |
15 |
|
Tract 2 (Origin) |
7 |
8 |
|
Tract 3 (Origin) |
15 |
8 |
TABLE 12
Egress Time from Stop (![]() )
)
for the Hypothetical Transit Service
Census Tract |
Tract 1 (Destination) |
Tract 2 (Destination) |
Tract 3 (Destination) |
Tract 1 (Origin) |
6 |
6 |
|
Tract 2 (Origin) |
6 |
6 |
|
Tract 3 (Origin) |
6 |
6 |
TABLE 13
Example Calculation of Total Travel Time (![]() )
)
for the Hypothetical Transit Service
Census Tract |
Tract 1 (Destination) |
Tract 2 (Destination) |
Tract 3 (Destination) |
Tract 1 (Origin) |
4 + 3 + 7 + 6 = 20 |
4 + 3 + 15 + 6 = 28 |
|
Tract 2 (Origin) |
4 + 5 + 7 + 6 = 22 |
4 + 3 + 8 + 6 = 21 |
|
Tract 3 (Origin) |
4 + 5 + 15 + 6 = 30 |
4 + 5 + 8 + 6 = 23 |
![]()
![]() = Access time to a stop or station
= Access time to a stop or station
![]() = Wait time at a stop or station
= Wait time at a stop or station
![]() = In-vehicle travel time
= In-vehicle travel time
![]() = Egress time from a stop or station
= Egress time from a stop or station
The second step for calculating the temporal comparability component of the MTOI involves using the total travel time from origin to destination from Table 13 and the connectivity decay function and its parameters estimated in Figure 4. The final calculation for the temporal comparability component is provided in Table 14.
TABLE 14
Example Calculation of Temporal Comparability (![]() )
)
for the Hypothetical Transit Service
Census Tract |
Tract 1 (Destination) |
Tract 2 (Destination) |
Tract 3 (Destination) |
Tract 1 (Origin) |
0.905 |
0.818 |
|
Tract 2 (Origin) |
0.888 |
0.897 |
|
Tract 3 (Origin) |
0.788 |
0.878 |
![]()
![]() = Total travel time from origin
= Total travel time from origin ![]() to destination
to destination ![]() for transit line
for transit line ![]() during time period
during time period ![]()
The final MTOI score for an origin tract is calculated by summing the factor of access opportunity, trip opportunity, and temporal comparability scores for each origin-destination pair. The final example calculation of the MTOI for each origin tract in the hypothetical transit service is shown in Table 15.
TABLE 15
Example Calculation of the MTOI for Each Origin Tract (![]() )
)
for the Hypothetical Transit Service
Census Tract |
|
MTOI |
Tract 1 (origin) |
(0.4)(9)(0.905) + (0.4)(9)(0.818) = 6.203 |
6.203 |
Tract 2 (origin) |
(0.5)(6)(0.888)+(0.5)(8)(0.897) = 7.032 |
7.032 |
Tract 3 (origin) |
(0.2)(6)(0.788) + (0.2)(6)(0.878) = 2.000 |
2.000 |
![]()
![]() = Access opportunity rating of origin
= Access opportunity rating of origin ![]() for transit line
for transit line ![]()
![]() = Trip opportunity rating from origin
= Trip opportunity rating from origin ![]() to destination
to destination ![]() for transit line
for transit line ![]() during time period
during time period ![]()
![]() = Connectivity decay factor from origin
= Connectivity decay factor from origin ![]() to destination
to destination ![]() for transit line
for transit line ![]() during time period
during time period ![]()
Since a reduction in transit service to a geographic area causes a decrease in the MTOI score for an area and an increase in service increases the score, the adverse effects of a service change may be defined as the percentage decrease from the MTOI of existing service to the MTOI of a proposed service configuration. Defining adverse effects as the percentage decrease from the MTOI of the existing service configuration to the MTOI of the proposed service configuration means that the level of service of alternative transit options serving the geographic area is included in the assessment. This reflects the reality that reducing service on a transit line that is the only transit service in an area would likely have a greater adverse effect than reducing service on a transit line serving an area that is rich in alternative transit options. The ability to incorporate this element is especially important in the assessment of span-of-service reductions since the availability of alternative transit options often varies by time of day.
Another benefit of the MTOI approach to quantifying adverse effects is that the magnitude of adverse effects on a geographic area associated with a service change is proportional to the magnitude of the reduction of service to that area, for each category of transit opportunity (access opportunity, trip opportunity, and temporal comparability). For example, if the overall number of trip opportunities on a service for a specific geographic area is decreased by 10 percent, the MTOI score for that area and service would also decrease by 10 percent (if wait times are held constant). If the removal of a stop or station would result in a 20 percent reduction in the number of riders in a geographic area who would have access to a service, the MTOI score for that area and service would also decrease by 20 percent (if average access and egress times are held constant). If route restructuring increases travel time by an amount that would lead to a 30 percent reduction in the number of riders who would be willing to make that trip (for a given origin and destination pair), the MTOI score for that origin-destination pair would decrease by 30 percent for that service (if there is no change in access opportunity). This relationship is a key element of the MTOI approach because it allows the assessed magnitude of adverse effects to change at different rates depending on any combination of the various types and magnitudes of service changes. This also means that a situation in which service to one geographic area is increased at the cost of reducing service in another geographic area can be objectively and consistently assessed.
To assess disparate impacts using the MTOI, the minority and nonminority populations in each geographic area are factored by the percentage change (from the existing to the proposed service) in the MTOI to represent the impacts on minority and nonminority populations in the area. The minority and nonminority impacts are then aggregated across all of the affected areas to indicate the impact of the service change on the minority and nonminority populations as a whole. The total impact on the minority population is then compared to the total impact on the nonminority population using the methods set forth in the transit agency’s disparate impact policy. An example of an impact analysis that is performed for the removal of a transit service is shown in Table 16.
TABLE 16
Example of an Impact Analysis Using the MTOI
Census Tract |
Change in MTOI |
Minority Population |
Nonminority Population |
Minority Impact |
Nonminority Impact |
Tract 1 |
-20% |
1,100 |
2,100 |
-220 |
-420 |
Tract 2 |
-100% |
1,500 |
2,000 |
-1,500 |
-2,000 |
Tract 3 |
-100% |
2,000 |
700 |
-2,000 |
-700 |
Tract 4 |
-20% |
2,300 |
800 |
-460 |
-160 |
Total impact |
|
|
|
-4,180 |
-3,280 |
In the example shown in Table 16, the removal of a transit service would result in a 20 percent decrease in the MTOI score for census tracts 1 and 4, and a 100 percent decrease in the MTOI score for tracts 2 and 3, signifying that the transit service to be removed accounted for 20 percent of the transit service available in tracts 1 and 4, and 100 percent of the transit service available in tracts 2 and 3. The minority and nonminority population within each area is factored by the percentage change in the MTOI for that area. The factored minority and nonminority populations are then aggregated across all affected areas to determine the total minority impact (‑4,180) and nonminority impact (‑3,280) of the service reduction. To ascertain whether disparate impacts exist, the total impacts on minority and nonminority populations are compared using the methods set forth in the transit agency’s disparate impact policy.
As stated in the MBTA’s Disparate Impact and Disproportionate Burden Policy, a disparate burden is found if the minority customers (population) sustain more than 20 percent additional burden over the total burden that the nonminority customers (population) sustain. In this example, the resulting ratio of minority impact (‑4,180) to nonminority impact (‑3,280) of 1.27 indicates that the minority population would sustain a burden that is more than 20 percent greater than the burden that the nonminority population would sustain, signifying a disparate impact. The same approach would be used to assess disproportionate burdens by substituting low-income and non-low-income population numbers for the minority and nonminority population numbers.
To compare the results obtained using the MTOI methodology with the FTA-recommended methodology, MPO staff analyzed a hypothetical major service change in which service on bus Routes 1 and CT1 would be eliminated.
To examine the MTOI method for assessing adverse effects, MPO staff first calculated the MTOI at origin census tracts for trips leaving their origins between 8:00 AM and 8:59 AM for the MBTA rapid transit and Key Bus Route networks: the Red, Orange, Blue, Green, SL1 and SL2 rapid transit lines, and the 1/CT1, 15, 22, 23, 28, 32, 39, 57/57A, 66, 71, 73, 77, 111, 116,117, SL4 and SL5 bus routes and corridors. The MTOI at each origin tract was then recalculated with Routes 1 and CT1 removed from the network to reflect a major service change.
Staff utilized several data resources to calculate the parameters for the MTOI method:
The total MTOI for each census tract in the full network of rapid transit and key bus routes is shown in Figure 6. The percentage change in the MTOI for each census tract after the removal of Routes 1 and CT1 is shown in Figure 7. Numerical values for the existing MTOI (before the service change), the MTOI when Routes 1 and CT1 are removed, the percentage reduction in the MTOI when those routes have been removed, and the minority and nonminority impacts for each census tract are presented in the Appendix.
Consistent with the proposed methodology explained in Section 3.3, the minority and nonminority impacts of the removal of Routes 1 and CT1 are aggregated
Figure 6
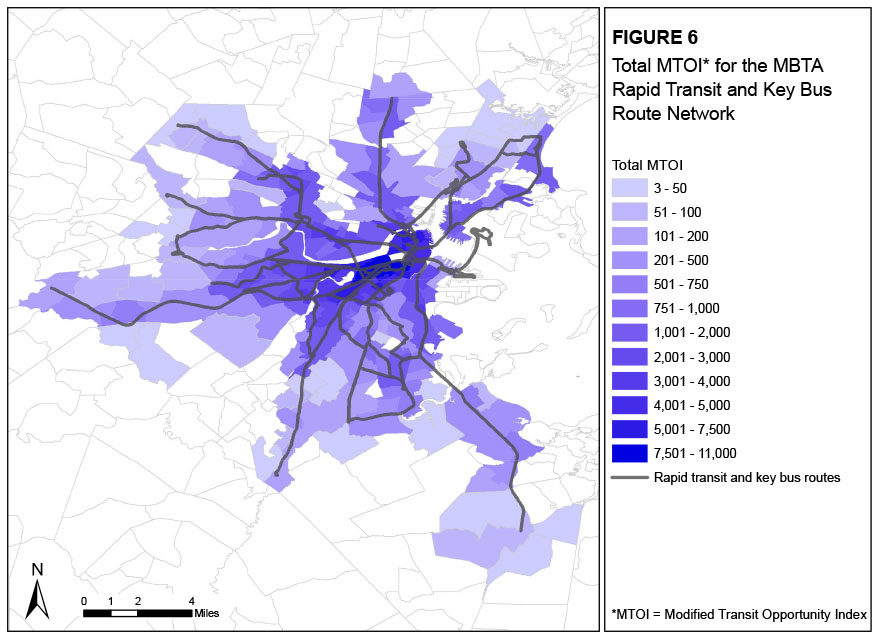
Figure 7
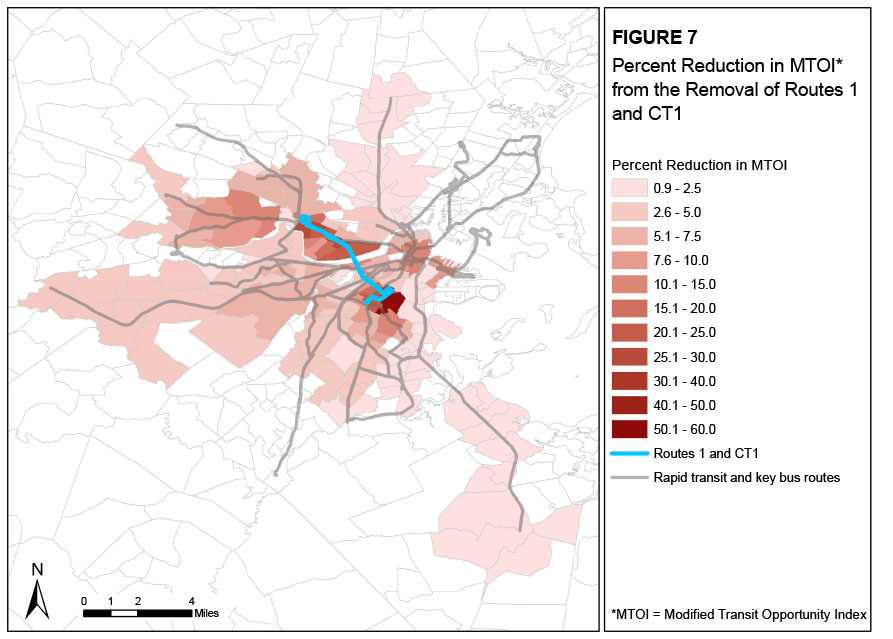
across all affected geographic areas, resulting in a total minority impact of
-22,037 and a nonminority impact of -26,302 for the service change. Using the MBTA’s definition of a disparate burden, these quantities are compared to determine if the minority population sustains a burden that is more than 20 percent greater than the burden the nonminority population sustains. The ratio of the total minority impact to the total nonminority impact of 0.84 indicates that nonminority populations sustain more of the burden than minority populations, and that no disparate impact to minority populations would result from the service change.
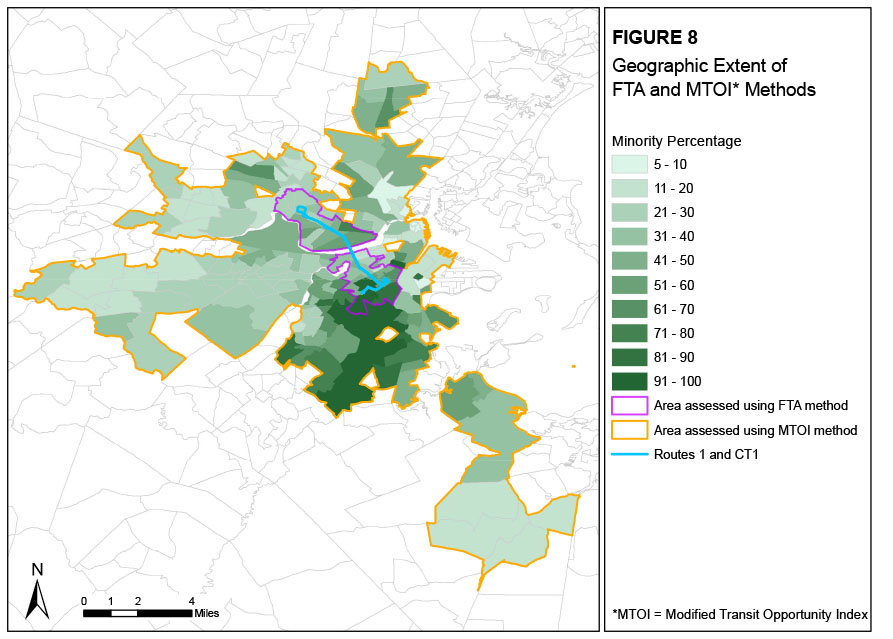
Using the FTA’s method for assessing disparate impacts using population data, the minority percentage of census tracts within one-quarter mile of a Route 1 or CT1 bus stop is compared to the minority percentage of the MBTA service area as a whole. Using the MBTA’s definition of a disparate burden, if the minority percentage of census tracts within one-quarter mile of a Route 1 or CT1 bus stop is greater than 120 percent of the minority percentage of the MBTA service area as a whole, a disparate impact exists. The ratio of the minority percentage of census tracts within one-quarter mile of a Route 1 or CT1 bus stop (44.69 percent) to the minority percentage of the MBTA service area as a whole (26.19 percent) of 1.71 indicates that the minority population sustains more of the burden than the nonminority population, and that a disparate impact would result from the service change.
Using the FTA’s method for assessing disparate impacts using ridership data, the minority percentage of Route 1 and CT1 riders is compared to the minority percentage of riders in the entire MBTA bus system using the 2008-09 MBTA Systemwide Passenger Survey. Using the MBTA’s definition of a disparate burden, if the minority percentage of Route 1 and CT1 riders is greater than 120 percent of the minority percentage of riders in the entire MBTA bus system, a disparate impact exists. The ratio of the minority percentage of Route 1 and CT1 riders (40.6 percent) to the minority percentage of riders in the entire MBTA bus system (47.5 percent) of 0.85 indicates that the minority population does not sustain more of the burden than the nonminority population, and that a disparate impact would not result from the service change.
The difference in outcomes between the FTA population-based and MTOI methodologies can be accounted for by the fact that the MTOI assessment was performed for a larger geographic area and used different factors to calculate the adverse effects of proposed major service changes. Figure 8 shows the geographic area assessed using the FTA population-based methodology and the area assessed using the MTOI methodology.
Figure 8
This memorandum presented the development and assessment of a new methodology for performing a service equity analysis to assess the disparate impacts and disproportionate burdens of major transit service changes. This methodology, which was developed by MPO staff, provides a more accurate and comprehensive way of analyzing the equity impacts of major service changes than the current FTA methodology because it accounts for: (1) riders who may be indirectly affected by the service change, not just those who currently use the service or who reside near the service; (2) the varying magnitude of adverse effects attributable to different types of service changes; and (3) the availability of alternative transit options that might reduce the potential adverse effects of a service change.
1 S.A. Mamun, N.E. Lownes, J.P. Osleeb, and K. Bertolaccini, “A Method to Define Public Transit Opportunity Space,” Journal of Transport Geography, Vol. 28, 2013, pp. 144–154.