
Title VI/Environmental Justice Assessment of TIP Projects
Project Manager
Grace King
Project Principal
Elizabeth Moore
Data Analysts
Seth Asante
Julian Chen
Betsy Harvey
Ryan Hicks
Kathy Jacob
Xuan Lu
Paul Reim
Cover Design
Kim DeLauri
The preparation of this document was supported
by the Federal Highway Administration through
MPO 3C PL contract #95411 and the Federal
Transit Administration §5303 contract #98873.
Central Transportation Planning Staff
Directed by the Boston Region Metropolitan
Planning Organization. The MPO is composed of
state and regional agencies and authorities, and
local governments.
July 2017
To request additional copies of this document or copies in an accessible format, contact:
Central Transportation Planning Staff
State Transportation Building
Ten Park Plaza, Suite 2150
Boston, Massachusetts 02116
(857) 702-3700
(617) 570-9192 (fax)
(617) 570-9193 (TTY)
ctps@ctps.org
www.bostonmpo.org
This report discusses the initial findings of a study undertaken by the Boston Region Metropolitan Planning Organization (MPO) to develop a methodology for conducting an equity analysis of the distribution of federal highway funding in the MPO’s Transportation Improvement Program (TIP). The aim of the TIP equity analysis is to determine whether the TIP projects, in the aggregate, subject minority or low-income populations to disparate impacts or disproportionate burdens (DI/DBs). The study’s objective was to develop a “proof-of-concept” methodology that illustrates a practicable approach for a TIP equity analysis. It was performed using target-funded highway projects in the federal fiscal years (FFYs) 2016–20 TIP. The report also identifies areas in which the methodology will be improved, which MPO staff will use to further refine the methodology prior to its implementation.
Chapter 2—Methodological Considerations Prior to Analyzing Impacts
Appendix A—FFYs 2016–20 TIP Target Highway Projects Used in the Study
Appendix B—Calculating A Low-income Measure and Threshold
Appendix C—Using the 2011 Massachusetts Travel Survey to Characterize Minority And Low-income Populations
Appendix D—Review of Current Practices of Peer MPOs
Appendix E—Resources
This report discusses the initial findings of a study undertaken by the Boston Region Metropolitan Planning Organization (MPO) to develop a method for conducting an equity analysis of the highway projects in the MPO’s Transportation Improvement Program (TIP). The aim of an equity analysis is to determine whether a collection of transportation projects, in the aggregate, subject minority or low-income populations to disparate impacts or disproportionate burdens (DI/DBs), respectively. The MPO has conducted equity analyses of its Long-Range Transportation Plan (LRTP) since 2006; the MPO also recently developed a method for analyzing the equity of transit funding in the TIP. This study, however, represents the first attempt by the MPO to develop an equity analysis for TIP highway projects.
As a recipient of funding from the Federal Transit Administration (FTA) and the Federal Highway Administration (FHWA), the Boston Region MPO must identify, for both the LRTP and TIP, potential social, economic, and environmental impacts—disparate impacts or disproportionate burdens—of transportation at the systems level that affect minority and low-income populations. As stated above, the MPO has developed analyses of TIP transit projects and LRTP transit and highway projects; this study aims to satisfy the requirement to analyze the systemwide benefits and burdens of TIP highway projects.
A full methodology for analyzing DI/DBs generally requires that the locations of minority and low-income populations are determined, adverse effects are identified and the metrics for measuring them selected, and a DI/DB policy that sets thresholds for determining whether adverse effects are disproportionately borne by minority or low-income populations is established. Although both FTA and FHWA require MPOs to analyze the equity impacts of the distribution of funding in the TIP and to determine whether disparate impacts and/or disproportionate burdens are present, neither agency recommends methodologies for doing so, nor do they specifically require MPOs to develop DI/DB thresholds for determining whether the impacts are disproportionate. MPOs therefore have some latitude in developing methodologies and determining whether DI/DBs are present.
MPO staff has developed a methodology that analyzes the effects of TIP highway projects on roadway users, by market segment (minority, nonminority, low-income, and non-low-income). When undertaken over a period of several years, the analysis will determine whether, in the aggregate, the MPO’s TIP investments subject low-income and minority populations to DI/DBs. In addition, this methodology intends to analyze the effects to neighborhoods adjacent to TIP projects. Those neighborhoods may see benefits, such as safety, but also burdens, such as localized air pollutants. This methodology takes preliminary steps toward accounting for these potential benefits and burdens, although it is not as well developed as that for roadway users. Additional metrics for both neighborhoods and roadway users may be selected and their methodologies developed more fully in the coming calendar year. Overall, this report demonstrates that, with additional refinement, the MPO will have an equity analysis that reasonably evaluates the impacts of the TIP.
As the first step in developing a TIP equity analysis, the study’s main objective was to develop a “proof-of-concept” methodology that illustrates a practicable approach for undertaking the analysis. It was anticipated that this methodology would be applied to a set of target-funded highway projects in the federal fiscal years (FFYs) 2016–20 TIP to analyze effects on both the TIP project roadway users and on neighborhoods adjacent to the TIP projects relative to a set of metrics. The study further anticipated that the MPO’s DI/DB policy would be applied to the initial findings of these analyses using thresholds set in the policy, which staff anticipated developing concurrently for the metrics used in the study.1
Because this study was breaking new ground, its progress was somewhat non-linear and iterative, and not all aspects were completed as originally planned. The study yielded a useful methodology; however, staff determined that it needs additional refinement and more complete data before it is implemented. Therefore, a DI/DB policy for the TIP was not developed or applied to the initial findings. Instead, the study, and this report, focused on developing a methodology and selecting metrics. This report also identifies changes that MPO staff will undertake to improve the methodology in the coming year as a task in the ongoing Transportation Equity (TE) program, including the development of a DI/DB policy. When the methodology and the DI/DB policy have been fully developed and approved by the MPO, they will be used to conduct TIP equity analyses. It is anticipated that this study will also inform other related Title VI and environmental justice (EJ) analyses conducted by the MPO, including the LRTP equity analysis and project-level analyses completed for MPO clients, so that all Title VI and EJ analyses are consistent across the MPO.
There are several appendices to this report that are not necessary to attain a basic understanding of the analysis, but that may be of interest to those looking for a more detailed explanation of the methodology. Appendix A lists the TIP projects included in the analysis. Appendix B describes how staff developed the low-income measure. Appendix C describes information from the 2011 Massachusetts Travel Survey (MTS-2011) that informed this report, including the trip rates for each market segment. Appendix D contains a review of current practices of peer MPOs regarding equity analyses. Finally, Appendix E lists external resources that informed this report.
All recipients of federal financial assistance are required to comply with both Title VI of the Civil Rights Act of 1964 and Presidential Executive Order 12898, “Federal Actions to Address Environmental Justice in Minority Populations and Low-Income Populations” (Executive Order 12898). Title VI prohibits discrimination on the basis of race, color, and national origin. Executive Order 12898 requires all federal agencies to incorporate EJ principles into their work by identifying disproportionately high and adverse human health or environmental effects of their activities, programs, and services on minority and low-income populations.
Both Title VI and Executive Order 12898 apply to all recipients of federal funding, including MPOs, through the requirements of their providers of federal financial assistance. As recipients of financial assistance from the FHWA and FTA, the MPO complies with their requirements regarding Title VI and Executive Order 12898. (Although this study focuses on highway projects, this chapter also explains FTA requirements that relate to equity analyses, as staff anticipate that bus passenger throughput will be included in the analysis when it is finalized.) FTA’s current Title VI Circular, 4702.1B, states that MPOs must complete “an analysis of impacts […] that identifies any disparate impacts on the basis of race, color, or national origin.” FTA’s EJ guidance, Circular 4703.1, requires recipients to determine whether their activities, programs, and services will result in disproportionately high and adverse effects on human health or the environment that is predominantly borne or will be suffered more severely or in greater magnitude by minority and/or low-income populations than by nonminority and/or non-low-income populations. FHWA’s Title VI and EJ guidance—Federal Highway Administration Environmental Justice Reference Guide—requires financial recipients to “avoid, minimize, or mitigate disproportionately high and adverse human health and environmental effects […] on minority and low-income populations” resulting from their activities, programs, and services.
Although federal guidance and regulations use different terminology for adverse effects on minority populations under Title VI—“disparate impacts”—and adverse effects on low-income populations under Executive Order 12898—“disproportionate burdens”—practically speaking, they refer to the same thing: a facially neutral policy or practice that disproportionately affects minority or low-income populations.2 Similarly, the equity analysis methodology is also the same for minority and low-income populations; however, MPO staff identifies the impacts on minority or low-income populations separately in accordance with federal regulations.
In response to Title VI, Executive Order 12898, and other federal and state nondiscrimination requirements, the Boston Region MPO has developed a robust TE program to ensure that populations protected under federal and state regulations share the benefits and burdens of the MPO’s activities in an equitable manner. One of the goals of the TE program is to develop systematic methods of evaluating the impacts of the projects programmed in two of the MPO’s planning documents, the LRTP and TIP. This study will help the MPO to meet this goal.
Chapter 2—Methodological Considerations Prior to Analyzing Impacts
Figure 1 shows an overview of the methodology of the TIP equity analysis. The different colors identify the steps in the methodology and the relationship between them. This chapter covers all of those steps that are part of “Demographics” and “Project Inputs,” Chapter 3 discusses the steps that are part of the “Regional Model” and “Trip Calculation,” and Chapter 4 discusses those that are part of “Metric Evaluation.”3
Figure 1
Overview of the TIP Equity Analysis Methodology
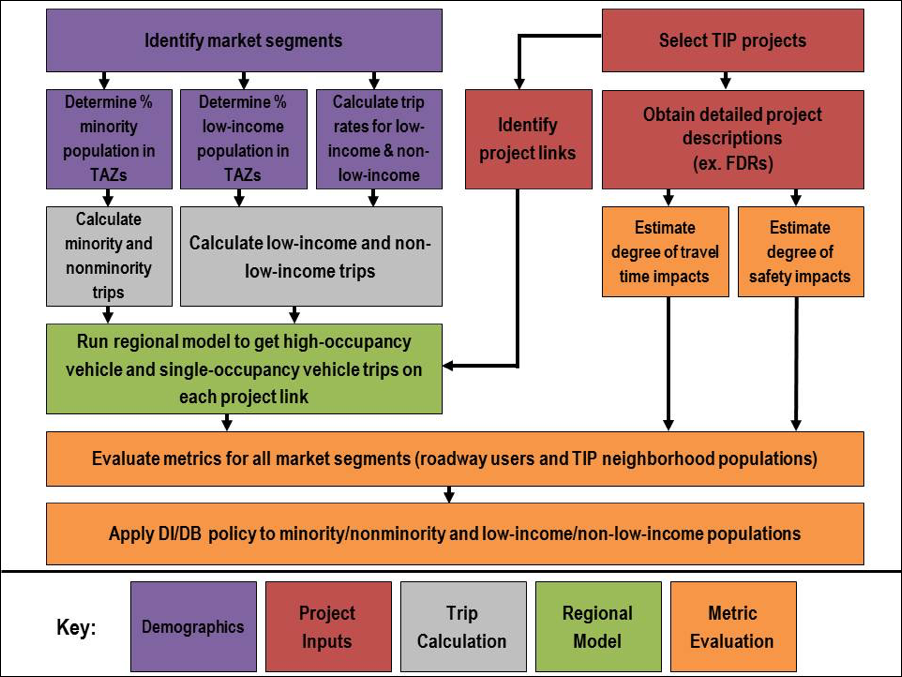
FDR = Functional Design Report. TAZ = Transportation Analysis Zone. TIP = Transportation Improvement Program
The first steps in developing the methodology consisted of making several decisions relating to data inputs. This chapter explains these choices, which included decisions regarding data collection, project selection, and demographics. Many of these will be incorporated into the various Title VI and EJ analyses that staff will complete in the future to ensure consistency.
Target-funded highway projects from the FFYs 2016–20 TIP were used in this study. Highway projects were selected because the MPO currently does not evaluate the equity impacts of highway projects in the TIP, whereas it has a method for analyzing transit projects in the TIP. By only analyzing highway projects, the methodology also reduced the number of variables introduced to the analysis, making it easier to identify impacts. Of the 24 target-funded highway projects in the TIP, three either did not have a functional design report (FDR) or lacked the necessary information on which to perform the analysis and were not included. The list of all 24 projects can be found in Appendix A. In the future, the TIP equity analysis will be applied to each TIP upon approval by the MPO.
The impacts on four demographic market segments were analyzed: minority, nonminority, low-income, and non-low-income. Both low-income and minority populations were used in order to meet both Title VI and EJ requirements. While this analysis only examines the effects on minority and low-income populations, it does not preclude the MPO from examining the effects on additional protected populations in the future—such as the elderly or persons with a disability—or on low-income and minority populations in combination. Additionally, the MPO’s TE program examines the impacts of MPO activities on these and other populations with other analytical tools.
Income data were taken from the 2010–14 release of the American Community Survey (ACS) and race/ethnicity data were from the 2010 Decennial Census. Transportation analysis zones (TAZs) were used as the geographic unit of analysis, as the TAZ is the standard unit used in the MPO’s regional travel demand model (RTDM) and the TE program. MPO staff converted minority and low-income data as reported in the Census and ACS from block groups to TAZs. Table 1 shows the regionwide population totals of all four market segments.
Table 1
Low-income and Minority Populations in Boston Region MPO
| Market Segment |
Population |
Percent of Total |
|---|---|---|
Low-income |
692,723 |
21.9% |
Non-low-income |
2,468,990 |
78.1% |
Total |
3,161,713* |
100.0% |
Minority |
877,685 |
27.7% |
Nonminority |
2,285,151 |
72.3% |
Total |
3,162,836* |
100.0% |
MPO = Metropolitan Planning Organization.
*Differences in population totals are due to varying data sources.
Sources: Decennial Census, 2010; American Community Survey, 2010-2014.
As required by FHWA and FTA via the Civil Rights Act of 1964, minority persons are those who self-identify as: American Indian or Alaska Native; Asian; Black or African American; Hispanic or Latino, regardless of race; and/or Native Hawaiian or other Pacific Islander. FHWA and FTA define a minority population as any readily identifiable group of minority persons who live in geographic proximity (and, if circumstances warrant, geographically dispersed/transient populations). A predominantly minority area means a geographic area, such as a neighborhood, Census tract, block or block group, or TAZ, in which the proportion of minority persons residing in that area exceeds the average proportion of minority persons in the recipient’s service area. For the MPO region, the average is 27.8%.
FHWA and FTA allow recipients to establish their own definitions of low-income that are appropriate for the region, as long as they are at least as inclusive as the poverty guidelines set by the U.S. Department of Health and Human Services (HHS). The MPO develops its own low-income thresholds using ACS data because of the region’s high cost of living. Given that these data are available in several forms such as household income, per capita income, family income, etc., the selection of a low-income measure depends on the purpose for which it will be used. Traditionally, in its TE program, the MPO has used median household income as its low-income measure. A household is low-income if it earns 60 percent ($45,624) of the MPO regional median household income ($76,040). Meanwhile, a TAZ is considered low-income if its household median income is less than $45,624. For the purposes of this analysis, however, staff explored using a new low-income measure that could be used to identify the total population (rather than households) that are low-income. Identifying the low-income status of individuals was needed in order to undertake a new approach of determining impacts by market segment (see Chapter 3). It was important that the new low-income measure mirrored 60 percent of the median household income so that the results of the analysis would be comparable with other analyses undertaken by the MPO that still use median household income for the low-income measure.
Poverty data satisfied these requirements, which are published in the ACS. Because poverty is based on household size, staff was able to determine the number of individuals living in poverty within each TAZ, which is not possible when using median household income data. (See Table B-2 in Appendix B for the definition of poverty by household size.) In addition to the population living below the national poverty level, the ACS also identifies the population that lives at 150 percent and 200 percent of the poverty level to account for the higher costs of living in some areas of the country. Staff selected 200 percent of the poverty level as the low-income threshold as it most closely correlated with 60 percent of the household income and because of the high cost of living in the Boston region. (See Appendix B for more details on the process of selecting the low-income measure.)
In previous LRTP equity analyses, the MPO used an “all-or-nothing” approach that designated each TAZ as minority or nonminority and as low-income or non-low-income. After the metrics were evaluated (such as average highway travel times or carbon monoxide per square mile) for the TAZ’s total population, the TAZ was designated as either minority or nonminority and either low-income or non-low-income. This designation was based on whether the TAZ met the minority or low-income thresholds (that is, whether the minority population exceeded 27.8 percent or whether the median household income exceeded $45,624). If a TAZ’s minority population exceeded 27.8 percent, all people living within that TAZ were considered minority, and vice-versa for nonminority TAZs, regardless of the actual proportion of minority and nonminority populations. Similarly, if a TAZ’s median household income was equal to or less than $45,624, the TAZ was considered low-income; if it was above that, the TAZ was considered non-low-income.
For this study, MPO staff revised this method, instead undertaking a “proportional” approach that designated trips (rather than TAZs) produced in each TAZ to one of the four market segments based on the proportion of the TAZ’s minority, nonminority, low-income, and non-low-income populations. For example, if a TAZ with a population of 1,000 was 60 percent minority and 40 percent nonminority, then 60 percent of the trips would be considered to have been taken by minorities and 40 percent of the trips would be considered to have been taken by nonminorities. (Low-income and non-low-income trips are calculated slightly differently, as income level affects the number of trips made by each household, while race and ethnicity do not; see Chapter 3 for an explanation.) This is one of the benefits of using the proportional approach—it is now possible to determine more precisely how many trips for each market segment are on each project link. The proportional approach had not been used in past equity analyses because it requires reprogramming of the RTDM and is significantly more time-consuming to complete the model run. Work on reprogramming the RTDM will be continued and subsequently completed prior to the implementation of this analysis.
When considering this new approach, staff also analyzed data from the 2011 Massachusetts Travel Survey (MTS-2011). The result of this analysis (see Appendix C) shows that minority and low-income commuters often work in nonminority or non-low-income TAZs (as defined using the all-or-nothing approach). Conversely, many nonminority or non-low-income commuters work in minority or low-income TAZs. Therefore, while designating the population of an entire TAZ as minority or low-income regardless of the TAZ’s actual demographic proportions has been useful simplification for some of the MPO’s purposes, such as demographic profiles and the LRTP equity analysis, this approach would significantly distort the results of the TIP equity analysis. (The methodology for the LRTP equity analysis will be changed to use the proportional approach in the upcoming LRTP.) For example, staff analysis shows that designating the entire population of a TAZ as one demographic market segment or another suppresses the low-income population and the nonminority population.
Two metrics were analyzed for roadway users, safety and travel time. The methodology used to capture the effects of these metrics combined travel modeling with off-model techniques. While the RTDM is effective at determining the travel impacts on roadway users regionwide, it does have some limitations. It is not ideal for identifying the benefits or burdens of small projects with no direct or major capacity changes, of which the TIP has many, such as signal updates, pavement improvements, and complete streets improvements. Therefore, the RTDM was used only in the first part of the methodology to identify the number of roadway users traversing each TIP project link, by market segment.4 The resulting data were then used in off-model techniques to estimate travel time and safety changes between the build and no-build conditions.
As in previous equity analyses, the TIP equity analysis compared the current conditions (no-build), which do not include the TIP projects, to future conditions (build), which contain the TIP projects. Staff used the year 2020 model run for both conditions. The same model run was used in order to reduce the variables introduced to the analysis. This assumption was reasonable, given that these types of projects typically do not lead to changes in the types or frequency of trips produced within the MPO.5 It also eliminated the potential difference in trips made under the no-build and build conditions, so that those differences could reasonably be assumed to be caused by TIP projects. In addition, the methodology only included trips made during the peak weekday morning period (6:00 AM–9:00 AM). Only motor vehicle trips were used; bus trips, bicycle trips, and pedestrian trips were not included. These may be added when this methodology is updated within the next year, depending on cost, time, and available data sources.
The method of calculating trip rates for the low-income and non-low-income market segments and for the minority and nonminority market segments differed. As race and ethnicity do not affect trip rates, the minority and nonminority trip rates for a TAZ were simply the percent of the TAZ’s population that was minority and nonminority. Income, however, does affect trip rates. Therefore, staff used data from the MTS-2011 to determine the proportion of trips within the MPO region that were made by low-income and non-low-income populations. These data show that low-income households make seven percent more trips each day than non-low-income households. This finding was applied to the proportion of low-income and non-low-income populations within each TAZ to get their trip rates.
With trip rates for each market segment established, it was now possible to calculate the number of trips produced in each TAZ by market segment. The trip rates were applied to trips that were produced in the MPO region, even if they had destinations outside of the MPO. The final model step assigned all high-occupancy-vehicle (HOV) and single-occupancy-vehicle (SOV) trips to the roadway network, which included the links that made up the TIP projects. This step produced the number of minority, nonminority, low-income, and non-low-income vehicles—both HOV and SOV—using each link in the 21 TIP projects during the morning peak period. (Prior to highway assignment, staff identified and “tagged” these links.)
Finally, SOV and HOV trips were converted into “person-trips,” the number of people using each TIP project roadway link. For SOV trips, this was simply the number of vehicle trips (since by definition there is just one person in each vehicle). HOV person-trips were calculated by multiplying the HOV occupancy rate by the number of HOV trips. The average HOV occupancy rate was 2.31 people per vehicle for all market segments, as obtained from the RTDM.
Using these HOV and SOV person-trips, staff evaluated the effects of the TIP projects on travel time and safety. These metrics were selected because they are two of the most common metrics used to evaluate roadway performance. Data for these metrics were also reasonably obtainable and available. Analyses for other metrics will be developed for the final iteration of this methodology, depending on the availability of needed data and the resources available to staff.
This study focused on the trips on each TIP project link. Consequently, to evaluate the two metrics for each market segment, total person-hours-traveled (PHT) and total person-miles-traveled (PMT) in the morning peak period were calculated for travel time and safety, respectively.
After trips on each link were converted to person-trips, staff undertook an off-model technique that used a combination of data analysis and professional judgment to estimate the travel time impact of the TIP projects. INRIX6 traffic speed data from 2012 were used to identify the observed speed and free-flow speed on project links in the morning peak period in both directions. Using these speeds, and the length of each link, the travel time for free-flow and observed conditions were calculated. The difference between the free-flow travel times and observed travel times were used as the delay for the no-build condition.
Staff then estimated travel times for the build condition, consulting each project’s FDR. Staff estimated delay adjustment factors (DAF)7 for each project based on professional judgment regarding the impacts on travel time that each TIP project’s improvements—as identified in the FDR—would cause. The DAFs were applied to the no-build condition delays to get the adjusted delay. This was then added to free-flow speed to get the build condition estimated speed (in other words, the travel speed when TIP projects are implemented). In conjunction with the length of each link, the speed was then converted to travel time for each link.
Finally, staff calculated total PHT. First, each project link’s person-trips were multiplied by the link’s travel time. This was done for every project link. Then the PHTs on each link were added together to get the total PHT for each market segment across all of the TIP projects.
Crashes on project roads were used to evaluate safety. First, crashes within 500 feet of each project that occurred between 2010 and 2014, inclusive, were identified. Then, the average annual crashes were calculated. A crash modification factor (CMF) was then estimated, using FHWA’s CMF guidelines and the predicted impacts due to project improvements identified in FDRs.8 The CMF was then multiplied by the observed average annual crashes to get the expected number of crashes on the TIP project roadway links.
Finally, staff calculated PMT. First, PMT was calculated as the number of people using each link multiplied by the length of the link. Then, PMTs for all the links were added together to get the total PMT for each market segment across all the projects. The total PMT of each market segment was used here because it represents the exposure of each market segment on the roadway links, and therefore was directly related to the safety impacts (represented by number of crashes) because of the TIP project improvements. Finally, the total impact for each market segment was based on the proportion of the total PMT in its market segment.
One of the goals of this study was to analyze the effects of the TIP projects on the surrounding neighborhoods, defined as the population living within one-half mile of a project.9 Staff explored various metrics; however, because of unanticipated methodological challenges and a lack of staff and data resources to address them at this time, staff instead completed a comparison of the demographic breakdown of these neighborhoods compared to that of the MPO region as a whole. It is anticipated that metrics will be developed for TIP neighborhoods in the final version of this methodology.
The comparison completed for this study identified the population of each market segment that lives in TAZs adjacent to the TIP projects to those who live within the entire MPO region. To capture each market segment associated with all of the TIP projects, a half-mile buffer was drawn around each project, with the assumption that the population was distributed evenly within each TAZ.
The initial findings reported in this chapter illustrate the process of undertaking a TIP equity analysis and demonstrate how the methodology works; they are similar, but are not the exact outputs of the analysis, as further improvements to the methodology and data quality are needed. This chapter explains how the findings were calculated using the metric evaluation steps described in Chapter 3. Anticipated future use of the analysis is also discussed, as well as its use in the context of the TIP planning process.
The purpose of a DI/DB policy is to define adverse effects, identify metrics for measuring adverse effects, and set thresholds to determine whether the adverse effects would be borne disproportionately by minority or low-income populations and whether these populations would receive a less proportionate share of the benefits. For example, a decrease in safety could be identified as an adverse effect. The metric chosen to measure safety could be the number of crashes, and the DI/DB threshold would be set to indicate at which point a change between the build and no-build conditions would be considered disparate or disproportionate. Because the magnitude of difference between the build and no-build conditions differs for each metric, a DI/DB policy would set different thresholds for each metric depending on what is considered an acceptable deviation.
Staff had anticipated finalizing a DI/DB policy for the MPO that would include metrics and thresholds for the TIP equity analysis. During the course of the study, however, staff concluded that it would be premature to create and apply DI/DB thresholds for the TIP equity analysis, as the methodology needs further refinement and some of the needed data are not available. Therefore, this report does not state whether the TIP projects cause DI/DBs.
To understand the extent to which minority and low-income roadway users might be affected by the TIP projects, staff first compared the PMT by market segment on TIP project roads with PMT by market segment on all of the region’s roads. Table 2 displays these data. It shows that a higher proportion of both minority and low-income market segments drive more miles on the TIP project roads than they do regionwide. This indicates that these market segments may be affected by the impacts of TIP projects relatively more than the other market segments.
| Market Segment |
Percent of Total Miles Traveled in MPO Region |
Percent of Total Miles Traveled in TIP Project Areas |
|---|---|---|
| Low-income |
18% |
20% |
| Non-low-income |
82% |
80% |
| Minority |
19% |
23% |
| Nonminority |
81% |
77% |
MPO = Metropolitan Planning Organization. TIP = Transportation Improvement Program.
Source: Central Transportation Planning Staff.
To calculate the safety metric, the proportion of total PMT allocated to each market segment was multiplied by the average annual crashes to get the number of crashes that each market segment would experience in the aggregate in both the build and no-build conditions. Sample results are shown in Table 3. In this example, the average annual crashes before TIP implementation would be about 900 and about 810 after implementation.
Table 3
Average Annual Crashes Experienced on All TIP Project Roadways by Market Segment
| Market Segment |
Proportion of PMT |
No-build Condition Crashes* |
Build Condition Crashes* |
|---|---|---|---|
Low-income |
20% |
177 |
159 |
Non-low-income |
80% |
724 |
653 |
Minority |
21% |
190 |
170 |
Nonminority |
79% |
711 |
642 |
PMT = Person-Miles-Traveled. TIP = Transportation Improvement Program.
*This represents the total number of crashes experienced by each market segment during the course of a year based on their proportion of total PMT.
Source: Central Transportation Planning Staff.
To get travel time results, the PHTs for each market segment on each link were added together to get the total time (in hours) that each market segment would spend on the TIP projects during the morning peak period. This process was done for the build and no-build conditions. Sample results are shown in Table 4. In this example, travel times for all market segments would decrease between the no-build and build conditions.
Table 4
Total Morning Peak Travel Time on All TIP Project Roadways by Market Segment
| Market Segment |
No-build Condition Total Travel Time* |
Build Condition Total Travel Time* |
|---|---|---|
Low-income |
420 |
390 |
Non-low-income |
1,800 |
1,680 |
Minority |
480 |
450 |
Nonminority |
1,720 |
1,610 |
TIP = Transportation Improvement Program.
*This represents how many hours it would take everyone in each market segment to complete the trips assigned to them in subsection 3.1.2, across the TIP projects, during the morning peak period.
Source: Central Transportation Planning Staff.
Table 5 contains the comparison of population, by market segment, living within the TIP project areas and regionwide. The table shows that minority and low-income market segments are overrepresented in TAZs in which TIP projects are located compared to their representation in the entire MPO region. This information indicates that minority and low-income populations could receive a disproportionate share of the benefits or burdens of potential impacts of TIP projects, as they have higher relative populations in TIP project neighborhoods relative to their regionwide populations. However, a more robust analysis of specific metrics (such as air quality) is needed to determine whether disparate impacts or disproportionate burdens exist; thus will be developed as the TIP equity analysis methodology is refined over the next year.
Table 5
Percent of Population by Market Segment Living within TIP Project Areas and the MPO Region
| Market Segment |
Percent of Total Population in MPO Region |
Percent of Total Population in TIP Project Area |
|---|---|---|
Low-income |
23% |
34% |
Non-low-income |
77% |
66% |
Minority |
28% |
43% |
Nonminority |
72% |
57% |
MPO = Metropolitan Planning Organization. TIP = Transportation Improvement Program.
Sources: U.S. Census, 2010; American Community Survey, 2010-2014.
The findings presented in this report are for illustrative purposes only to demonstrate how the TIP equity analysis methodology would work. To produce usable results, additional refinement and major upgrades to the RTDM are necessary. These are discussed in Chapter 5, and will be addressed within the next year. Within this time frame, a DI/DB policy will be presented to the MPO for approval, followed by a final version of the TIP equity analysis methodology. With the MPO’s approval, the analysis can then be used to evaluate the FFYs 2019–23 TIP.
The purpose of the TIP equity analysis is to analyze the effects of projects in the aggregate, not of individual projects, because federal requirements instruct MPO recipients of federal funding to analyze projects in the aggregate. The methodology, therefore, was designed with this goal in mind. Additionally, the TIP equity analysis will not replace the MPO’s long-standing use of evaluation criteria as the primary way in which projects are selected for programming. Rather, it will provide a check to confirm that the MPO is following its Title VI and EJ requirements of ensuring that minority and low-income populations are not subject to DI/DBs. Furthermore, it will help the MPO meet its transportation equity goals and objectives that it established in the current LRTP, Charting Progress to 2040, and subsequently implemented in successive TIPs.
In light of these objectives, after the MPO approves the TIP equity analysis methodology, it will be used each year to analyze subsequent TIPs after the TIP has been approved. (An overview of the proposed implementation process of the TIP equity analysis is shown in Figure 2.) Because of this timing, the analysis will not affect any projects programmed in the TIP upon which the analysis is done. Nor will a single TIP equity analysis necessarily lead to changes in the following year’s project selection process, bearing in mind that the MPO board itself must approve any changes to the TIP evaluation criteria. Rather, when completed each year, the analysis will allow the MPO to determine whether it is sufficiently meeting its regulatory obligations of ensuring that its investments do not, in the aggregate, cause DI/DBs to minority or low-income populations. If, over time, analyses show that TIPs consistently cause DI/DBs, further actions by the MPO would be warranted, such as mitigation. Mitigation is necessary if the program lacks substantial justification and one or more practicable alternatives exist that would serve the same objectives but with less of a disproportionate effect on minority and/or low-income populations. Examples of mitigation could include revising the transportation equity TIP criteria or funding one or more projects that directly benefit minority and/or low-income communities.
Figure 2
Flowchart of Proposed Implementation and Timing of the TIP Equity Analysis
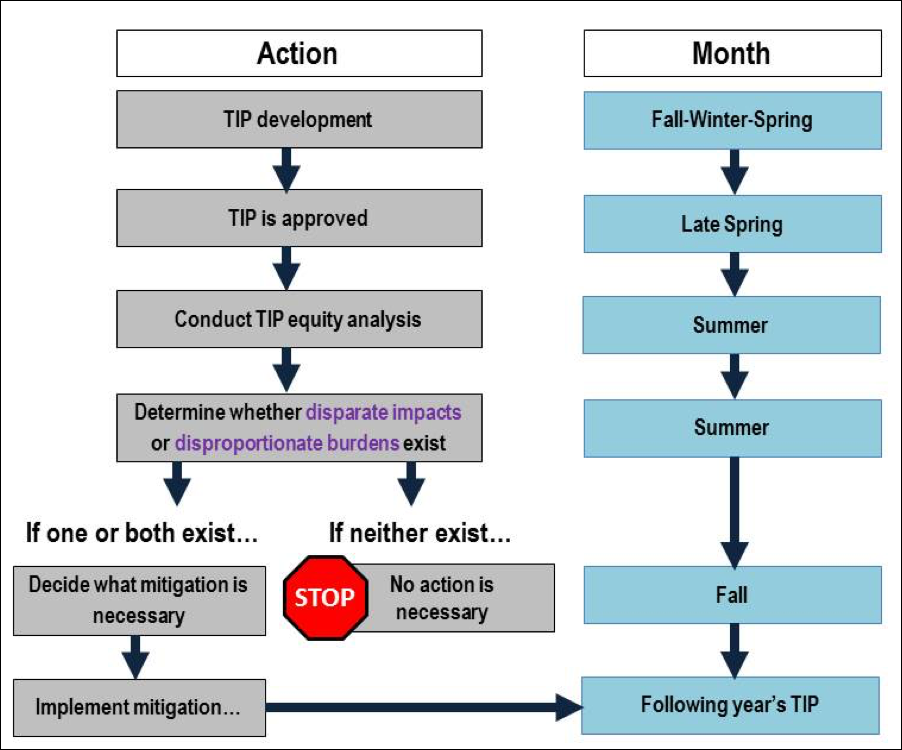
TIP = Transportation Improvement Program.
The MPO currently considers transportation equity throughout its TIP selection process and seeks to fund projects that reflect its established commitment to ensuring that minority and low-income communities receive a fair share of benefits, and are not subject to unfair burdens stemming from its transportation investments. The TIP equity analysis will verify that the MPO is successfully achieving these goals.
Staff has identified several necessary changes to this methodology that will be addressed prior to the final iteration of the TIP equity analysis. They are documented below.
In conclusion, staff explored and tested a methodology that determines whether highway projects in the TIP, in the aggregate, cause DI/DBs for minority and low-income populations. After undertaking several improvements to the methodology, as identified in the report, and upon approval by the MPO, it will be used to evaluate the DI/DBs of the MPO’s TIP each year.
1 The development of the DI/DB policy was not funded through this study, but was a part of the MPO’s ongoing TE program.
2 The main difference between the two terms is the legal recourse available to the public, which is based on whether the population is protected under Title VI—a law—or Executive Order 12898—an executive order.
3 Note that this report does not present the results of the final step, applying the DI/DB policy to the results of the metric evaluation.
4 Project link: a segment of a roadway in the RTDM that is part of a TIP project. Typically there are multiple links in a project.
5 A “trip” is travel between two activities, such as home and work. Only those trips that were produced in TAZs within the MPO region were analyzed, whether they ended within the MPO or outside of it. However, while the trips produced outside of the MPO were not analyzed, they were included as “background” trips, in other words, crashes involving these trips.
6 INRIX is a company that provides traffic data to the Boston Region MPO.
7 A DAF is a percentage that is applied to the travel time delay between the free-flow and observed traffic speeds in order to get the adjusted delay (increased or decreased) caused by project implementation. The DAF is the sum of all of the predicted delays caused by each element of the project (such as adding a travel lane, changing signal prioritization, etc.). For example, if the free-flow speed is 25 mph and the observed speed is 20 mph, then the travel time delay is five mph. Subsequently, if the DAF is +20 percent, then the adjusted delay is one mph (0.20 x 5).
8 A CMF is a multiplicative factor that is used to calculate the expected number of crashes after implementing a roadway improvement at a particular location. It reflects the impact on roadway safety of the improvement. For more information about how CMFs are calculated, see http://www.cmfclearinghouse.org/.
9 Based on a study of the 2009 National Household Travel Survey, Walking Distance by Trip Purpose and Population Subgroups, a half-mile was found to be the median walk distance. Therefore, a half-mile buffer was thought to reasonably capture the population directly affected by the TIP projects’ traffic impacts.
Appendix A—FFYs 2016–20 TIP Target Highway Projects Used in the Study
This appendix contains a list of the TIP projects used in this study. The three projects that were part of the FFYs 2016–20 TIP but not included in the study due to a lack of data are also noted.
Table A-1
FFYs 2016–20 TIP Target Highway Projects Programmed in 2016
| MassDOT Project ID |
Project Location |
Project Description |
Length (miles) |
|---|---|---|---|
029492 |
Bedford, Billerica, and Burlington |
Turnpike improvements from Crosby Drive north to Manning Road |
1.96 |
600518 |
Hingham |
Intersection improvements at Derby Street, Whiting Street, and Gardner Street |
0.38 |
601630 |
Abington and Weymouth |
Reconstruction and widening of Route 18, from Highland Place to Route 139 |
4.18 |
602077 |
Lynn |
Reconstruction of Route 29, from Great Woods Road to Wyoma Square |
0.72 |
602261 |
Walpole |
Reconstruction of Route 1A, from the Norwood town line to Route 27 |
2.33 |
604123 |
Ashland |
Reconstruction of Route 126, from the Framingham town line to the Holliston town line |
1.71 |
604810 |
Marlborough |
Reconstruction of Route 85 |
1.14 |
604935 |
Woburn |
Reconstruction of Montvale Avenue, from I-93 interchange to Central Street |
0.37 |
604989 |
Southborough |
Reconstruction of Main Street, from Sears Road to Park Street |
0.91 |
605034 |
Natick |
Reconstruction of Route 27, from North Avenue to the Wayland town line |
2.18 |
605110 |
Brookline |
Intersection and signal improvements at Route 9 and Village Square |
0.47 |
605721 |
Weymouth |
Intersection improvements at Middle Street, Libbey Industrial Parkway, and Tara Drive |
0.07 |
605789 |
Boston |
Reconstruction of Melnea Cass Boulevard |
0.94 |
606043 |
Hopkinton |
Signal and intersection improvements on Route 135 |
0.82 |
606117 |
Boston |
Traffic signal improvements at ten locations |
0.77 |
606453 |
Boston |
Improvements on Boylston Street, from intersection of Brookline Avenue and Park Drive to Ipswich Street |
0.63 |
606635 |
Needham and Newton |
Reconstruction of Highland Ave., Needham Street, and Charles River Bridge, from Webster Street to Route 9 |
3.05 |
607309 |
Hingham |
Reconstruction and related work on Derby Street, from Pond Park Road to Cushing Street |
0.83 |
607409 |
Lexington |
Reconstruction of Massachusetts Avenue, from Marrett Road to Pleasant Street |
0.73 |
607428 |
Hopedale and Milford |
Resurfacing and intersection improvements on Route 16, from Water Street to the Hopedale town line |
0.62 |
607652 |
Everett |
Reconstruction of Ferry Street, South Ferry Street, and a portion of Elm Street |
1.63 |
603711* |
Needham and Wellesley |
Rehab/replacement of 6 bridges on I-95/Route 128 |
3.25 |
604996* |
Woburn |
Bridge replacement, New Boston Street |
0.34 |
606226* |
Boston |
Reconstruction of Rutherford Avenue, from City Square to Sullivan Square |
2.94 |
TIP = Transportation Improvement Program.
*These projects were not included in the equity analysis due to a lack of data.
Source: Central Transportation Planning Staff.
Appendix B—Calculating a Low-income Measure and Threshold
This appendix describes the process through which MPO staff identified the low-income measure and threshold to use in this study.
One of the most common measures of income—and one that the MPO currently uses for its TE program—is household income. This is simply the total income reported for all individuals living at the same address within a given year, regardless of whether or not they are related. A similar measure, but less inclusive, is family income, the annual income for a household of related individuals. The MPO does not use family income because it leaves out a significant portion of the population, such as college students. (It is not uncommon for the number of family households to be just half of the total households in the region.)
For a given geographic area—such as a TAZ—the typical household income measure is the median household income of that area. Using the median instead of the average prevents very large or very small values from skewing the result. One of the benefits of using the household as the unit of measurement—instead of individual-based measures such as per capita income—is that it reflects the role of the household as an economic unit. A multi-person household benefits from sharing many household costs, such as utilities and food. Individual income measures do not take into account these economies of scale. One of the drawbacks of household income is that it does not include persons who live in group quarters, such as those living in prisons, dormitories, nursing homes, or military barracks. FHWA and FTA have encouraged the MPO to consider group quarter residents when identifying low-income populations. Therefore, MPO staff looked for another way to define low-income populations for the TIP equity analysis that would align as closely as possible with the household income measure used in the TE program.
One of these alternative metrics staff explored was poverty. Every year, the United States Census Bureau (USCB) publishes poverty thresholds for the entire country that are based on household size. They use these thresholds to report the number of people in poverty at various geographic scales in the ACS, down to the block group. FTA and FHWA recommend, but do not require, the use of national poverty guidelines, which are published by the U.S. Department of Health and Human Services (HHS) to identify low-income populations. The HHS poverty guidelines are based on the poverty thresholds and are used for administrative purposes such as determining income-based eligibility for certain federal programs. Because HHS slightly adjusts poverty thresholds when developing poverty guidelines, reported poverty levels vary between the two sources.1
Using poverty rather than household income as the metric for identifying low-income populations has two major advantages. One is that it accounts for household size in that it bases the poverty level on the number of people in the household. The second is that it makes it possible to calculate the actual number of people who live in poverty. A comparison of the different ways to measure low-income is shown in Table B-1.
Table B-1
Comparison of Methods for Calculating a Low-income Threshold
| Market Segment |
60% of Median HH Income |
Per Capita Income |
Below Poverty Level |
Below 200% of Poverty Level |
|||||
|---|---|---|---|---|---|---|---|---|---|
| HHs |
Percent |
Threshold |
Pop. |
Threshold |
Pop. |
Percent |
Pop. |
Percent |
|
Low-income |
399,815 |
32.2% |
— |
1,814,816 |
— |
330,674 |
10.9% |
692,723 |
22.8% |
Non-low-income |
843,380 |
67.8% |
— |
1,346,897 |
— |
2,711,941 |
89.1% |
2,468,990 |
77.2% |
Total* |
1,243,195 |
100.0% |
$45,624 |
3,161,713 |
$41,837 |
3,042,614 |
100.0% |
3,161,713 |
100.0% |
HH = Household.
*Differences due to varying data sources.
Source: United States Census Bureau.
In addition to the poverty level, the USCB also identifies the number of people who live at a certain percentage of the poverty level as a way to account for the higher costs of living in some areas of the country. Given the high cost of living in the Boston region, staff selected 200% of the poverty level as the low-income threshold (Table B-2).
| Household Size |
Related Children Under 18 Years |
||||||||
|---|---|---|---|---|---|---|---|---|---|
| 0 |
1 |
2 |
3 |
4 |
5 |
6 |
7 |
8+ |
|
One |
— |
— |
— |
— |
— |
— |
— |
— |
— |
Younger than 65 years |
$24,632 |
— |
— |
— |
— |
— |
— |
— |
— |
65 years and older |
$22,708 |
— |
— |
— |
— |
— |
— |
— |
— |
Two people |
— |
— |
— |
— |
— |
— |
— |
— |
— |
Householder younger than 65 years |
$31,706 |
$32,634 |
— |
— |
— |
— |
— |
— |
— |
Householder 65 years or older |
$28,618 |
$32,512 |
— |
— |
— |
— |
— |
— |
— |
Three |
$37,036 |
$38,110 |
$38,146 |
— |
— |
— |
— |
— |
— |
Four |
$48,836 |
$49,634 |
$48,016 |
$48,182 |
— |
— |
— |
— |
— |
Five |
$58,894 |
$59,750 |
$57,920 |
$56,504 |
$55,640 |
— |
— |
— |
— |
Six |
$67,738 |
$68,008 |
$66,606 |
$65,262 |
$63,266 |
$62,082 |
— |
— |
— |
Seven |
$77,942 |
$78,428 |
$76,750 |
$75,582 |
$73,402 |
$70,862 |
$68,072 |
— |
— |
Eight |
$87,172 |
$87,940 |
$86,358 |
$84,970 |
$83,002 |
$80,504 |
$77,906 |
$77,244 |
— |
Nine or more |
$104,860 |
$105,370 |
$103,968 |
$102,792 |
$100,860 |
$98,202 |
$95,798 |
$95,202 |
$91,536 |
Source: United States Census Bureau.
Because the MPO continues to define low-income as 60% of the median household income of the MPO’s area for its TE program, staff wanted to ensure that whichever measure was used for the TIP equity analysis mirrored 60% of the median household income—$45,624. To do so, the median household income and the percent of the population who live in poverty were determined for each TAZ. Staff then plotted median household incomes against the percent of the population who live in poverty. This analysis showed that the percentage of the population below 200% of the poverty line correlated strongly (-0.81) with 60% of the median household income (in other words, the higher the household income, the lower the percent in poverty). This measure enables MPO staff to: 1) calculate the percent of the population rather than households who are low income and 2) include some persons in group quarters. Because of these advantages, MPO staff used 200% of the poverty level as the low-income measure in this study. By doing so, staff could determine the number of low-income people in a TAZ (rather than the number of low-income households in a TAZ).
The charts below show how closely the poverty level correlates (Figure B-1), how 200% of the poverty level correlates (Figure B-2), and how per capita income (Figure B-3) correlates with the median household income. The results show that 200% of the poverty level most closely correlates with the median household income.
Figure B-1
Percent of Population Below Poverty Level by Median Household Income
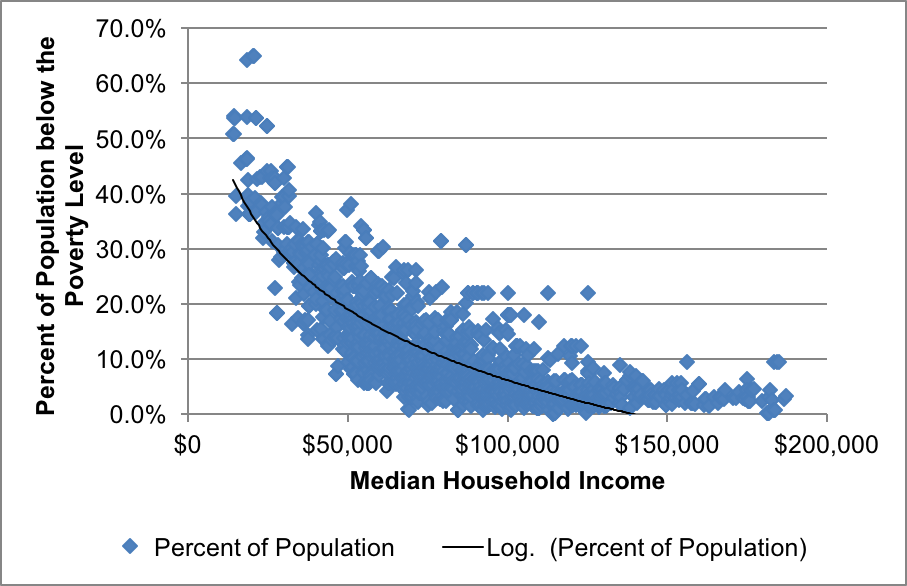
Notes:
i) The chart excludes TAZs with no households and those with median household incomes above $200,000 (the latter is due to the fact that the highest income bracket in the ACS is “over $200,000” making it impossible to know the actual median income for these TAZs).
ii) Regional median household income = $76,040.
iii) 10.9% of the population lives below the poverty level.
iv) Correlation coefficient: -0.70
Source: American Community Survey, 2010-2014.
Figure B-2
Percent of Population Below 200% of the Poverty Level by Median Household Income
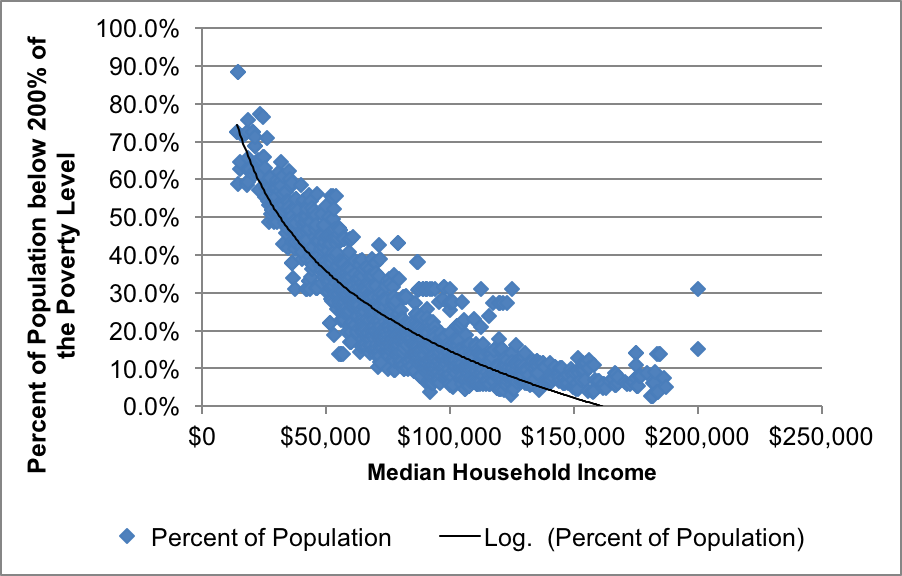
Notes:
i) The chart excludes TAZs with no households and those with median household incomes above $200,000 (the latter is due to the fact that the highest income bracket in the ACS is “over $200,000,” making it impossible to know the actual median income for these TAZs).
ii) Regional median household income = $76,040.
iii) 22.8% of the population lives below 200% of the poverty level.
iv) Correlation coefficient: -0.81
Source: American Community Survey, 2010-2014.
Figure B-3
Per Capita Income by Median Household Income
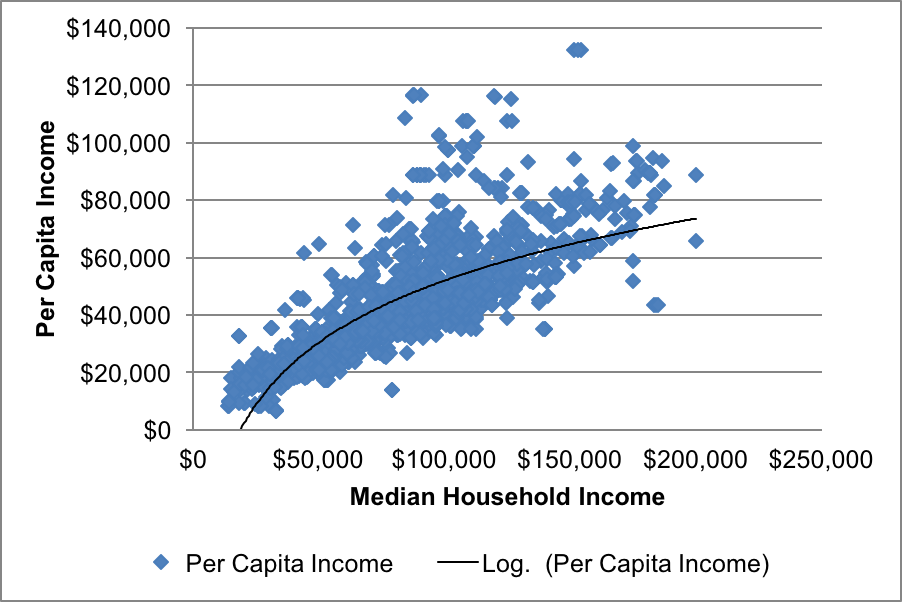
Notes:
i) Regional median household income is $76,040.
ii) Regional per capita income is $41,837.
iii) The chart excludes TAZs with no households and those with median incomes above $200,000 (the latter is due to the fact that the highest income bracket in the ACS is “over $200,000,” making it impossible to know the actual median income for these TAZs).
iv) Correlation coefficient: 0.77
Source: American Community Survey, 2010-2014.
This appendix describes findings from the Massachusetts Travel Survey (MTS-2011) regarding travel behavior of low-income and minority populations. This information was used to inform several aspects of this study, including the determination of trip rates.
The MTS-2011 compiled responses from 15,040 Massachusetts households about their travel activities. Based on the responses, travel characteristics for the MPO region were analyzed. This appendix looks in detail at the travel behavior by reported annual household income and minority status. Survey respondents reported their household income by selecting one of eight income brackets. For the purpose of this section, the threshold for low-income households is $49,999, which is the upper bound of the income bracket that most closely aligns with the low-income measure that the MPO uses in its TE program (60% of the regional median income, or $45,624).
The primary geographical building block of the Boston Region MPO’s transportation planning is the TAZ. The accepted practice at the MPO—a practice that is frequently used by other MPOs—is to characterize each TAZ in the region as being either a minority/nonminority or low-income/non-low-income, depending on the proportion of the population that is low-income or minority.
Two challenges inherent to this approach are particularly relevant to this study. The first is that inevitably a number of low-income residents live in TAZs that are classified as non-low-income and minority residents live in TAZs classified as nonminority. Conversely, non-low-income residents live in low-income TAZs and nonminority residents live in minority TAZs. The Decennial Census and the American Community Survey from the United States Census Bureau can be used to characterize the average income or racial/ethnic composition of a TAZ, but any policy benefiting or adversely affecting a TAZ is usually assumed to affect all residents of the TAZ, whether or not they are members of a particular population.
In addition, as an analysis of income data shows, trips are often made to other zones. An analysis of morning commuting data for low-income and non-low-income commuters shows that commuters who live in low-income TAZs commute to both low-income and high-income TAZs. A total of 29.6% of low-income commuters live in low-income TAZs. And yet, as Table C-1 shows, they are not always commuting to low-income TAZs. More than three-quarters (80.5%) of low-income commuters work in a non-low-income TAZ. Additionally, more than half (59.2%) of all low-income commuters live and work in non-low-income TAZs.
Table C-1
Commute Trip Characteristics of Low-income Commuters
| Home TAZ |
|
||
|---|---|---|---|
| Workplace TAZ |
Low-income* |
Non-low-income* |
Total |
Low-income* |
8.2% |
11.3% |
19.5% |
Non-low-income* |
21.4% |
59.2% |
80.5% |
Total |
29.6% |
70.4% |
100.0% |
TAZ = Transportation Analysis Zone.
*Percent of total number of commuters.
Source: 2011 Massachusetts Travel Survey.
Table C-2 similarly shows the number of non-low-income commuters who live and work in non-low-income and low-income TAZs. Overall, non-low-income commuters are less likely to live and work in low-income TAZs than low-income commuters are to work and live in non-low-income TAZs. Only 1.7% of non-low-income commuters live and work in low-income TAZs. However, 14.2% work in a low-income TAZ, regardless of where they live.
These data show that, regionwide, roadway improvements are likely to benefit people with a wide range of incomes, regardless of whether they live in a low-income or non-low-income TAZ. For this reason, one of the goals of this study was to identify a method of determining how many people are commuting via, and thus benefiting from, TIP projects. These data informed the MPO staff’s decision of determining the population of TAZs by using the actual proportion of each market segment within a TAZ, rather than an “all-or-nothing” approach of assigning the entire population of a TAZ as either minority/nonminority or low-income/non-low-income, as it had done in previous MPO equity analyses.
Table C-2
Commute Trip Characteristics of Non-low-income Commuters
|
|
Home TAZ |
|
|
|---|---|---|---|
| Workplace TAZ |
Low-income* |
Non-low-income* |
Total |
Low-income* |
1.7% |
12.5% |
14.2% |
Non-low-income* |
4.9% |
81.0% |
85.8% |
Total |
6.6% |
93.4% |
100.0% |
TAZ = Transportation Analysis Zone.
*Percent of total number of commuters.
Source: 2011 Massachusetts Travel Survey.
Respondents of the MTS-2011 were also asked to report their usual mode to work. Table C-3 shows mode shares by income and minority status. Both non-low-income (69.5%) and nonminority (71.7%) commuters are more likely to commute in a motor vehicle, whether as driver or passenger, than low-income (53.4%) and minority (50.2%) commuters. Conversely, minority or low-income residents are more likely to walk and commute via public transit. Data from the MTS-2011 also show that nonminority and non-low-income commuters commute further over every mode than low-income and minority commuters.
Table C-3
Commuting Mode Shares by Income and Minority Status
| Mode Share |
MPO Region |
Low-income |
Non-low-income |
Minority |
Nonminority |
|---|---|---|---|---|---|
| Auto (driver) |
63.5% |
48.9% |
66.5% |
46.9% |
68.4% |
| Auto (passenger) |
3.3% |
4.5% |
3.0% |
3.3% |
3.3% |
| Public transit |
23.3% |
31.7% |
21.6% |
37.1% |
19.3% |
| Walk |
6.5% |
12.1% |
5.4% |
9.9% |
5.5% |
| Bicycle |
3.0% |
2.0% |
3.2% |
2.4% |
3.1% |
| Other |
0.4% |
0.7% |
0.3% |
0.4% |
0.4% |
MPO = Metropolitan Planning Organization.
Source: 2011 Massachusetts Travel Survey.
As data from the MTS-2011 show, the common practice of designating the population of an entire TAZ as a minority/nonminority or low-income/non-low-income population regardless of the TAZ’s actual demographic distribution, while a useful simplification for some of the MPO’s purposes, could distort the TIP equity analysis results. Looking at the MTS-2011 helped clarify why this step in the equity analysis methodology is crucial.
Trip rates for the low-income and non-low-income populations were calculated based on responses to the MTS-2011. The low-income definition used in the MTS-2011 differs from the measure used in the rest of this study. While “low-income” for the purpose of setting low-income thresholds means persons who live below 200% of the poverty level, the proportion of trips made by low-income persons was calculated based on the household income threshold (60% of the regional median), as only household income is reported in the MTS-2011. Additionally, the income bracket in the MTS-2011 that most closely aligns with the household income threshold of $45,624 was $35,000–$49,000. Any household that fell within this bracket or the one below it was considered low-income.
Using these breakpoints, staff analyzed the number of trips (linked and non-linked) based on the market segments (Tables C-4 and C-5). Linked trips are defined as a trip between two activities, such as work and home, regardless of how many times the person changed transportation modes (such as walking to a train station, then taking the train, and then walking to the final destination). Unlinked trips are defined as each transportation mode used as a part of a trip, regardless of whether they start or end at an activity. The example includes three unlinked trips: a walk trip, followed by a train trip, and finally a walk trip.
Table C-4
Linked Trips and Trip Rates by Income Market Segment
Type of Resident |
Trips Taken by Residents in All MPO Households |
Trips Taken by Residents in Low-income Households |
Trips Taken by Residents in Non-low-income Households |
Commutersa |
5,028,943 |
810,018 |
4,218,925 |
Drove alone |
3,371,744 |
436,349 |
2,935,395 |
Driven by someone else |
143,853 |
34,179 |
109,674 |
Otherb |
1,513,346 |
339,490 |
1,173,856 |
Workers not commutingc |
611,119 |
95,921 |
515,198 |
Non-workersd |
4,421,037 |
1,285,552 |
3,135,485 |
All residents |
10,061,099 |
2,191,490 |
7,869,609 |
Trip rates for all residents |
3.31 |
2.93 |
3.43 |
MPO = Metropolitan Planning Organization.
aConsists of people who worked or took that day off from work on the day of the survey.
bConsists of all non-personal vehicle transportation, including public transit, walking, bicycling, ferry, and taxi.
cConsists of employed persons who indicated that they worked from home on the day of the survey.
dIncludes all people not in the workforce: unemployed persons, retired persons, children under 18, and university students who do not work.
Source: 2011 Massachusetts Travel Survey.
Table C-5
Unlinked Trips and Trip Rates by Income Market Segment
| Type of Resident |
Trips Taken by Residents in All MPO Households |
Trips Taken by Residents in Low-income Households |
Trips Taken by Residents in Non-low-income Households |
|---|---|---|---|
Commutersa |
7,501,549 |
1,391,167 |
6,110,382 |
Drove alone |
3,800,896 |
493,655 |
3,307,241 |
Driven by someone else |
181,361 |
41,255 |
140,106 |
Otherb |
3,519,292 |
856,256 |
2,663,036 |
Workers not commutingc |
787,835 |
144,861 |
642,974 |
Non-workersd |
5,944,061 |
2,151,448 |
3,792,613 |
All residents |
14,233,445 |
3,687,475 |
10,545,970 |
Trip rates for all residents |
4.68 |
4.92 |
4.60 |
MPO = Metropolitan Planning Organization.
aConsists of people who worked or took that day off from work on the day of the survey.
bConsists of all non-personal vehicles, including public transit, walking, bicycling, ferry, and taxi.
cConsists of employed persons who indicated that they worked from home on the day of the survey.
dIncludes all people not in the workforce: unemployed persons, retired persons, children under 18, and university students who do not work.
Source: 2011 Massachusetts Travel Survey.
Appendix D—Review of Current Practices of Peer MPOs
Staff reviewed the practices of several peer MPOs to determine whether any have undertaken an equity analysis or a similar analysis on the roadway projects in their TIPs, whether they applied DI/DB thresholds, and if so, what methodologies and thresholds they have used.
Staff reviewed the most recent TIP documents of these peer MPOs and found that few had completed TIP equity analyses, although several had completed a similar analysis for their LRTP. Some referred readers of their TIPs to their LRTP analyses, using the rationale that, because TIP projects are meant to be consistent with those that are recommended in the LRTP, the LRTP analysis would be sufficient. For example, the Chicago Metropolitan Agency for Planning’s (CMAP) 2014–19 TIP refers to an evaluation from their 2040 LRTP that analyzed access to jobs by auto and transit for EJ communities (low-income and minority). CMAP staff is currently developing a methodology for evaluating potential DI/DBs specifically for major capital projects included in the TIP. Metrics they are exploring include air pollution, climate change, and congested vehicle hours traveled, but no thresholds have been set.
Other MPOs that use a similar approach include the San Diego Association of Governments (SANDAG), the New York Metropolitan Transportation Council (NYMTC), and the Southern California Association of Governments (SCAG). None of these have developed equity analyses specifically for their TIPs, instead referring readers to the results of their LRTPs. Examples of metrics these MPOs examine in their LRTP include travel time, gentrification, access to employment, percent of income used for travel costs, and particulate matter.
Finally, some MPOs perform equity analyses based only on the distribution of TIP funding to minority and low-income populations. For example, METRO (the MPO for Portland, OR) compares the dollar investment per person per acre in each of the five EJ populations in the region to that of the entire region. If the first is lower than the second then there is a disparate impact.
The San Francisco Bay Area Metropolitan Transportation Council (MTC) determines whether minority persons receive an equitable share of the roadway user benefits compared with nonminority populations. The analysis calculates the TIP investment per capita for minority and nonminority populations; the results are then compared, expressed as rate (minority benefit per capita over nonminority benefit per capita). If the percentage result is statistically significant then a disparate impact is present.
Boston Region MPO staff believes it is expedient to explore direct travel impacts for its TIP equity analysis. None of the peer MPOs addressed these types of metrics to analyze the benefits or burdens resulting from TIP projects. In addition, TIP equity analyses did not address the impacts on people who live adjacent to TIP projects, only the users of the roadways. Some peer MPOs have evaluated the impact of projects proposed in LRTPs on project neighborhoods, and MPO staff explored ways to apply some of these methods to those neighborhoods. Metrics used by other MPOs for these types of analyses for LRTPs have included: gentrification, tax burdens, air quality, noise, investment share, and jobs-housing imbalance. (Note that these have been applied to residents in entire MPO regions, whereas this study looks only at residents who live adjacent to TIP projects.)
Association of Bay Area Governments and the Metropolitan Transportation Commission. (July 2013). Equity Analysis Report: Including Title VI, Environmental Justice and Equity Analysis for Plan Bay Area. http://www.planbayarea.org/sites/default/files/pdf/final_supplemental_reports/FINAL_PBA_Equity_Analysis_Report.pdf
Chicago Metropolitan Agency for Planning. (27 January 2016). Memo: Improvement of Environmental Evaluation of Major Capital Projects. http://www.cmap.illinois.gov/documents/10180/511545/2016-02-04-ENR-6.0-Next+Plan+Environmental+Evaluation+of+MCP.pdf/adede96f-4db4-4bf6-9826-114875b1a53a
Federal Transit Administration. (1 October 2012). Title VI Requirements and Guidelines for Federal Transit Administration. https://www.transit.dot.gov/sites/fta.dot.gov/files/docs/FTA_Title_VI_FINAL.pdf
Institute for Research on Poverty. “What are poverty thresholds and poverty guidelines?” http://www.irp.wisc.edu/faqs/faq1.htm
Massachusetts Department of Public Health, Bureau of Environmental Health. (2013). Health Impact Assessment of the Massachusetts Department of Transportation (MassDOT) Grounding McGrath Study.
Metropolitan Transportation Commission. (2017). Draft 2017 TIP Investment Analysis: A Focus on Low-income and Minority Populations, Seniors, and Persons with Disabilities. http://mtc.ca.gov/sites/default/files/2017_Investment_Analysis.pdf
New York Metropolitan Transportation Council. (4 September 2014). Title VI Program. https://www.nymtc.org/portals/0/pdf/NYMTC_TitleVI_Program_Adopted_9-4-2014.pdf
Oregon Metro. (17 July 2014). 2014 Regional Transportation Plan and 2015-2018 Metropolitan Transportation Improvement Program Environmental Justice and Title VI. http://www.oregonmetro.gov/sites/default/files/2014_civil_rights_assessment_071814.pdf
U.S. Department of Health and Human Services, Office of the Assistant Secretary for Planning and Evaluation. (n.d.) “U.S. Federal Poverty Guidelines Used to Determine Financial Eligibility for Certain Federal Programs.” https://aspe.hhs.gov/poverty-guidelines
Yang Y and Diez-Roux AV. (2012). Walking Distance by Trip Purpose and Population Subgroups. American Journal of Preventative Medicine. 43(1): 11-19.
1 For more information, see “What are poverty thresholds and poverty guidelines?” Institute for Research on Poverty, http://www.irp.wisc.edu/faqs/faq1.htm and “U.S. Federal Poverty Guidelines Used to Determine Financial Eligibility for Certain Federal Programs,” U.S. Department of Health & Human Services, https://aspe.hhs.gov/poverty-guidelines.