TECHNICAL MEMORANDUM
DATE: February 1, 2024
TO: Boston Region Metropolitan Planning Organization
FROM: Casey Cooper, Bicycle and Pedestrian Planning Program Manager, and Benjamin Krepp, Chief Data Scientist, MPO Staff
RE: Bicycle and Pedestrian Count Data Application Update
This memorandum summarizes improvements made to the Boston Region Metropolitan Planning Organization’s (MPO) Bicycle and Pedestrian Count Data application and describes updates being made to the MPO’s practices for counting people walking and bicycling as the program moves forward.
The Boston Region MPO’s Bicycle and Pedestrian Count Data application is a publicly accessible resource on the MPO’s website containing count data that documents people’s walking and bicycling behavior as far back as 1974. The MPO shares these data to inform transportation-planning decisions. Bicycle and pedestrian count data can be used to evaluate long-term volume trends, estimate demand for bicycle and pedestrian access, and assess changes in usage before and after projects are implemented. This information can support transportation planners’, traffic engineers’, and government officials’ decisions regarding bicycle and pedestrian projects, such as how projects are prioritized and how funding is allocated. The data also help to justify investments in bicycle and pedestrian facilities as an integral component of the region’s multimodal transportation network.
The Boston region’s bicycle and pedestrian count data were originally kept in paper format but have since been digitized, which made it possible for MPO staff to create a web application in 2009 to share this information with the public. For over a decade, the Boston Region MPO’s Bicycle and Pedestrian Count Data application has provided open access to data documenting the number of people walking and bicycling at a variety of locations and allowed for the information to be shared with municipalities, regional stakeholders, the Massachusetts Department of Transportation (MassDOT), and members of the public. In federal fiscal year 2023, the Boston Region MPO board funded a discrete project to update the original application to make the data more accessible to a variety of users.
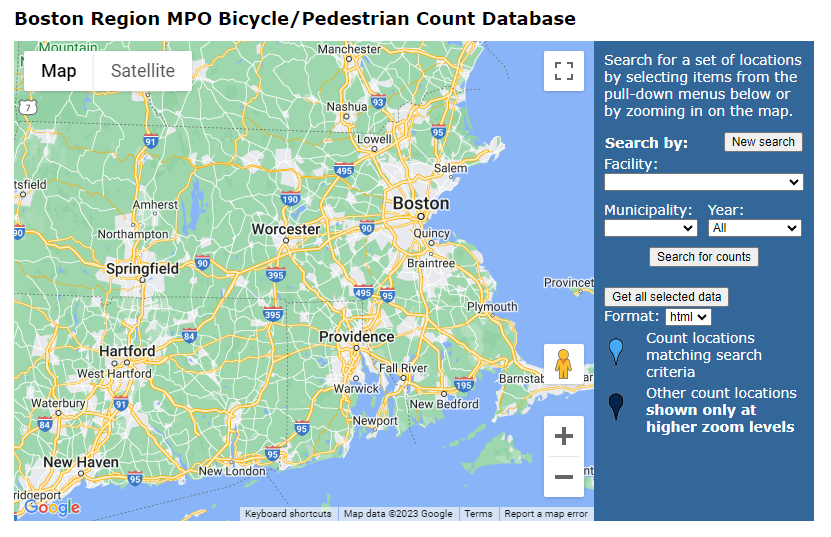
While the original application was still functional, the presentation of data was aesthetically dated and the application did not present information about people walking and bicycling in an easily consumable way. It used the Google Maps platform—one of only a few platforms available in 2009—which offered a limited number of ways to present geographic information. The opening view of the application showed a view of Massachusetts and parts of bordering states; while the map included the Boston region, no count location points were immediately visible (Figure 1).
Figure 1
Screenshot of the 2009 Count Data Application’s Initial View
Source: Central Transportation Planning Staff.
Users needed to zoom into the map for location points to appear, which users could then select. A box indicating the selected point would appear and, within the box, the count location’s name was hyperlinked, providing users with access to the data collected at the location (Figure 2). When count points met the search criteria they were shown as light blue on the map, while those locations that did not meet the search criteria were represented by navy blue points.
Figure 2
2009 Count Data Application Zoomed for Count Location Selection
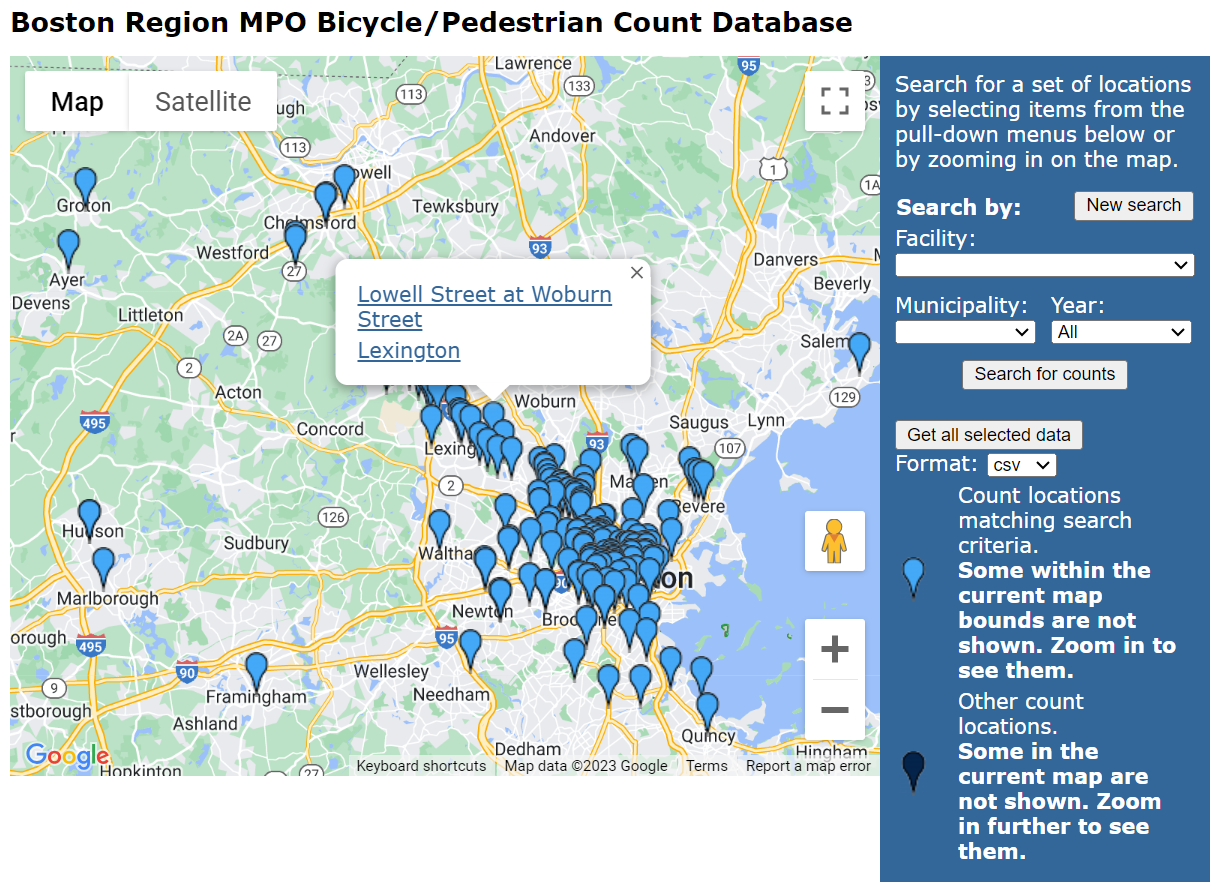
Source: Central Transportation Planning Staff.
Selecting the hyperlinks that would pop up when a user clicked the point on the map would yield one of two actions. If CSV was selected in the dropdown menu format, clicking the link would initiate the download of a CSV file containing all the bicycle and pedestrian count data for that location. If HTML was selected, clicking the link would open a new tab that would display all the available count data for the location in table format (Figure 3).
Figure 3
Screenshot of Data Displayed in 2009 HTML Format
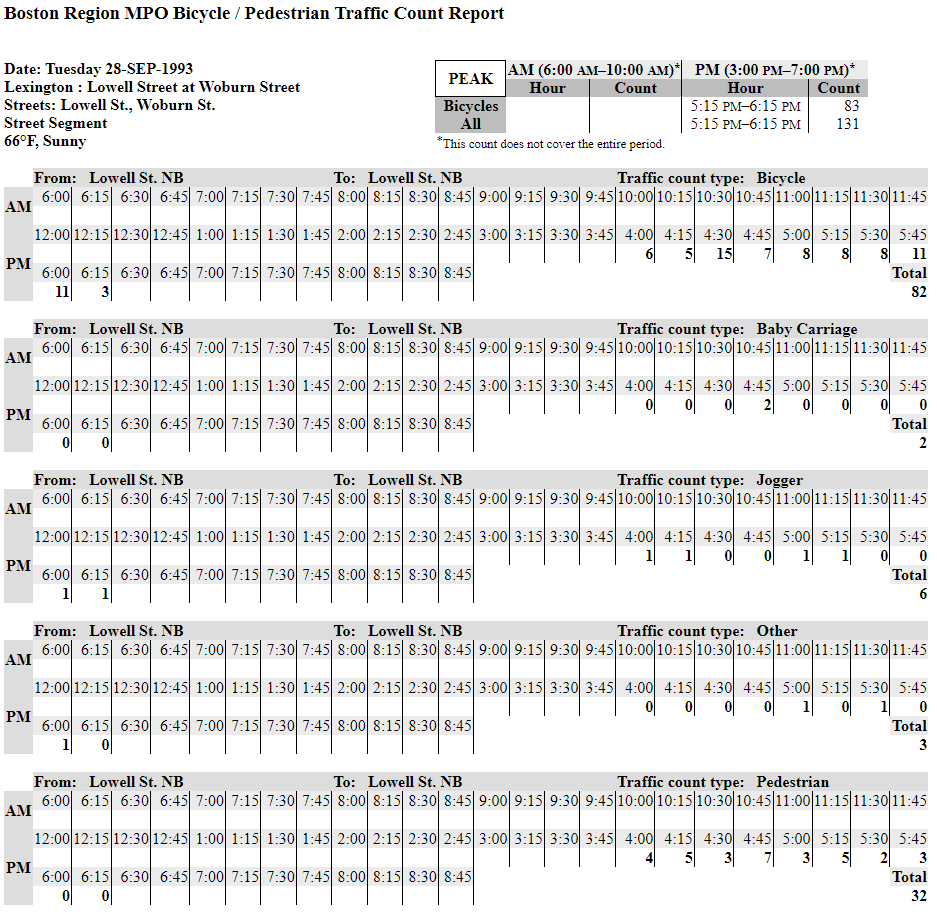
Source: Central Transportation Planning Staff.
The HTML format presented the data in a way that made it difficult to analyze trends and understand the travel patterns of people walking and bicycling at the location. Each set of count data featured details about the conditions during the count session (such as the date, location, temperature, type of weather, etc.) and provided a summary of the total number of people bicycling. This information would be followed by multiple static tables, one for each mode of transportation, each documenting the total travelers observed during every 15-minute period of the count session.
In 2023, MPO staff modernized the count data application’s aesthetic and usability, bringing it in line with the Boston Region MPO’s other applications (Figure 4). The new platform includes a legend that allows users to choose their basemap and toggle several features, such as the Boston Region MPO boundary and various types of bicycle facilities, on and off. A new “Download all data” button gives users a simple way to obtain all the MPO’s historical bicycle and pedestrian count data with one mouse click. Also, the addition of a “Metadata” button ensures that users understand the count data that they have downloaded.
Figure 4
2023 Count Data Application
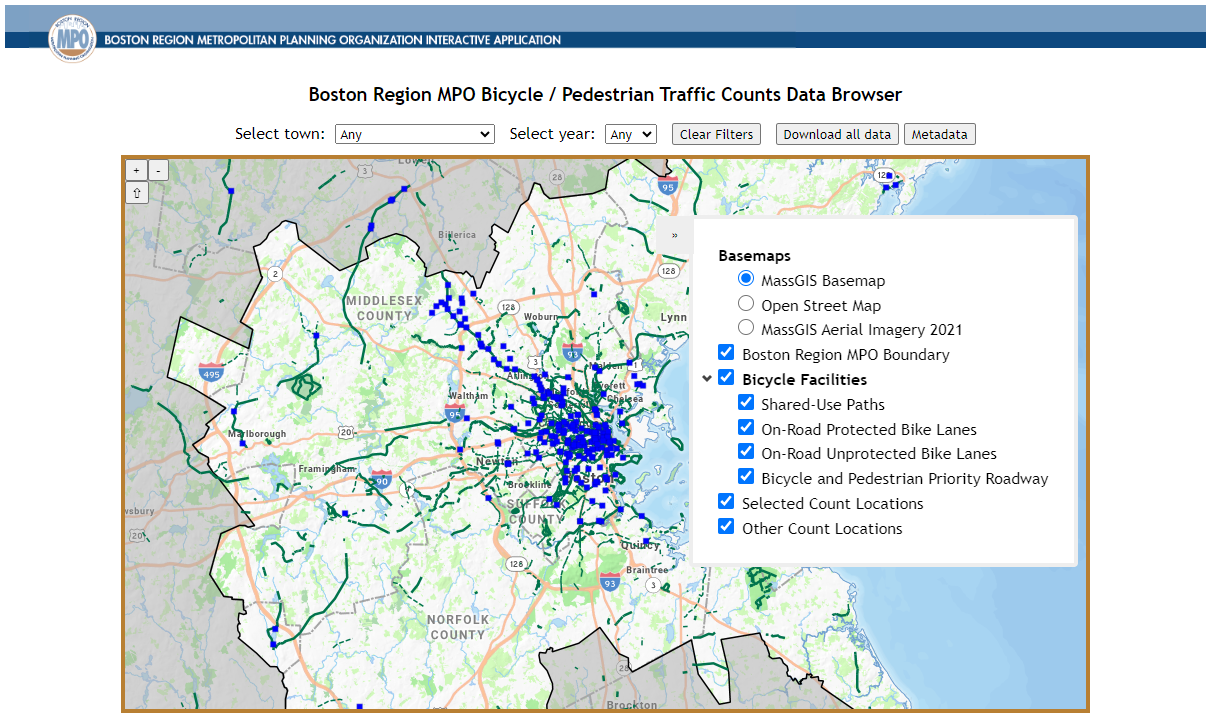
Source: Central Transportation Planning Staff.
Upon first opening the count data application, users can click any count location point visible on the map. It is also possible to search for count locations by municipality or find count data that was collected in a specific year using the dropdown menus at the top of the application page. After a user selects a point on the map, an informational box hovers above the point providing a brief overview of the count location (Figure 5). The box lists the location’s name and ID, along with the total number of count sessions that occurred at the location, the date of the most recent count session, the total volumes during the AM and PM peak periods on that date, and the first (oldest) count session. This information is followed by a hyperlink that opens a tab displaying data from the count location (Figure 6).
Figure 5
2023 Count Data Application
Count Location Information Box
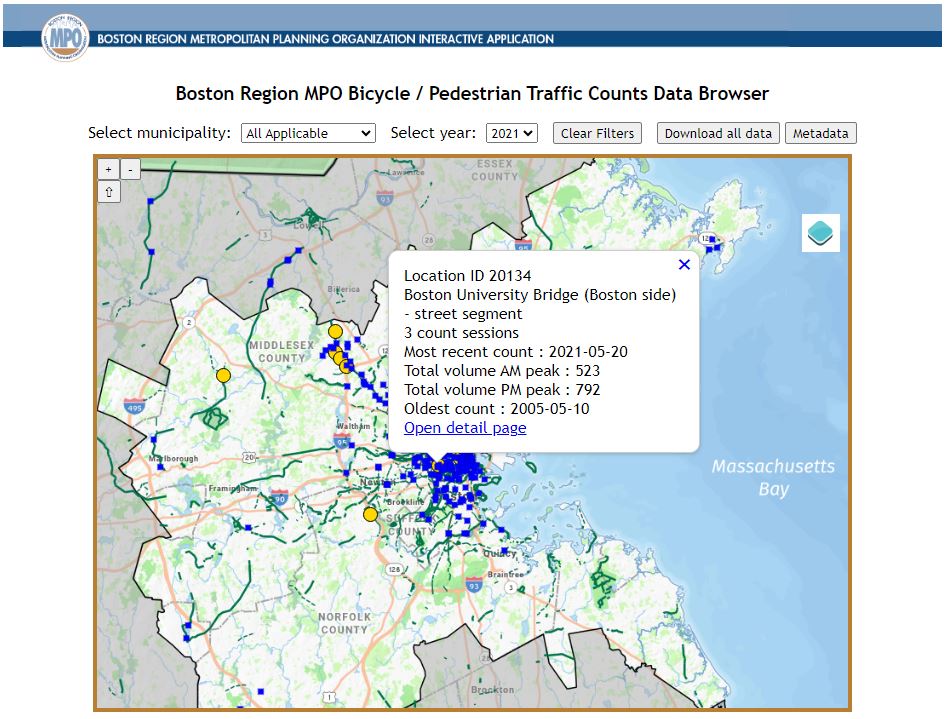
Source: Central Transportation Planning Staff.
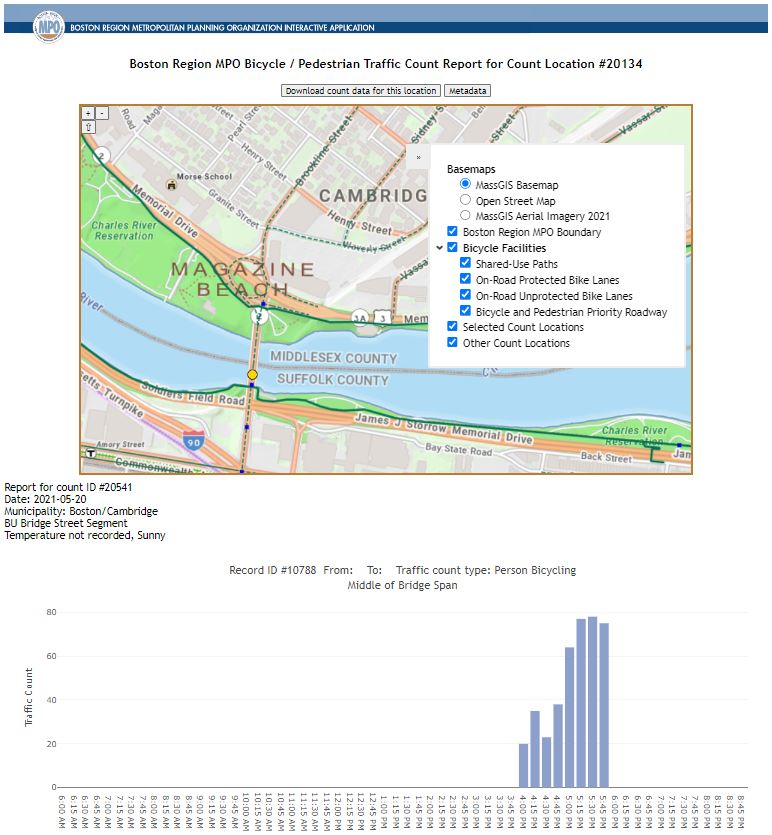
The new tab with count location details features a map at the top of the page that illustrates where the count data was collected. The map includes a legend similar to the one featured on the application’s main page to provide users with basemap options and illustrate where bicycle facilities are located relative to the count point. Above the map are “Download count data for this location” and “Metadata” buttons, providing users with the ability to download these data and analyze travel behavior at the specific location on their own.
Below the map are bar graphs illustrating the count data collected at the location in chronological order from most recent to oldest date of collection. The data are shown in 15-minute increments and each graph displays the count data for one mode, such as “person walking”, “person bicycling,” or “person using wheelchair.” Users can hover over each bar to see the specific number of people counted during each 15-minute segment of the count session. These bar graphs allow users to quickly understand temporal changes in pedestrian and bicyclist volumes throughout the day without having to download the data and create similar visualizations on their own. In locations where counts were recorded for multiple days, months, or years, temporal changes over time can also be easily observed.
Figure 6
Screenshot of Count Location Detail Page
Source: Central Transportation Planning Staff.
During FFY 2023, MPO staff worked on modernizing the user interface and “user experience” of the MPO's Bicycle and Pedestrian Count Data application, focusing on improving the “front end” of the application. Due to schedule constraints, we were not able to focus on replacing the “middleware” used to communicate between the client side of the application (the part that runs in a web browser) and a backing database. The existing middleware was implemented in a now largely antiquated technology, Cold Fusion. MPO staff plan to replace the middleware layer with one implemented in a more modern technology, such as PHP or Ruby.
The next phase of work on the application will entail connecting the client-side application, which currently reads count and count location data from files in the web server’s local file system, to the database containing the count and count location data by means of a layer of middleware software. This software will execute queries to harvest results from the backing database, making the data available for presentation in the client-side application and allowing the application to scale to much larger quantities of data, such as that produced by automated count devices.
The current lack of middleware for this version of the Bicycle and Pedestrian Count Data application limited staff’s ability to include some desired features on the application’s front end, but staff have compiled a list of improvements that they would like to implement in the future:
Figure 7
Screenshot of Current Information Display for a Specific Count Session
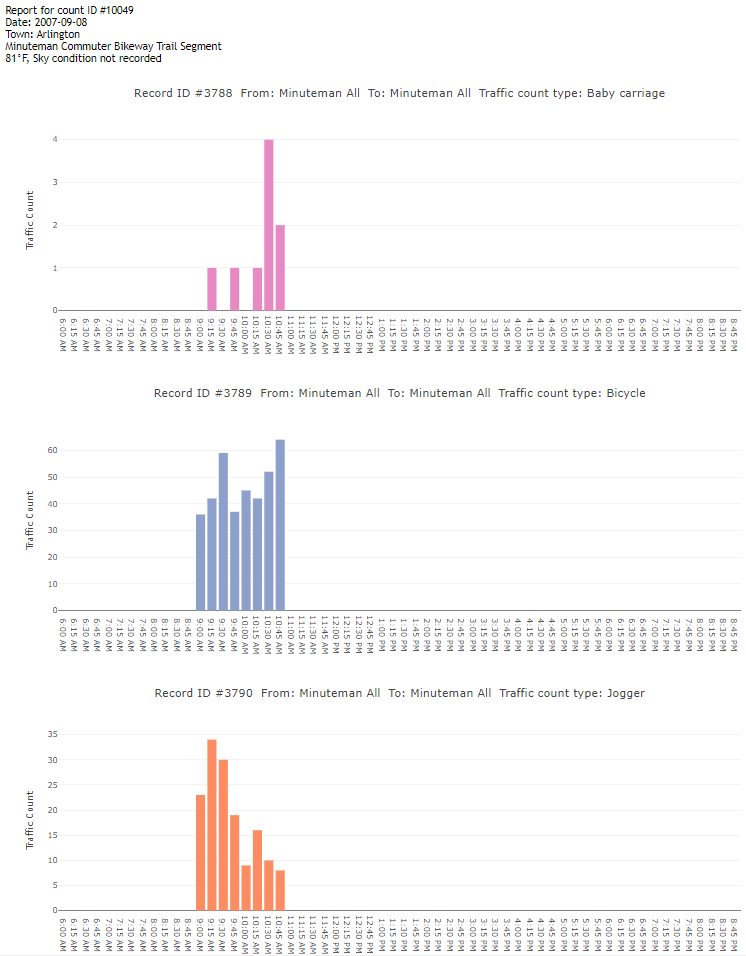
Source: Central Transportation Planning Staff.
Figure 8
Proposed Information Display for a Specific Count Session
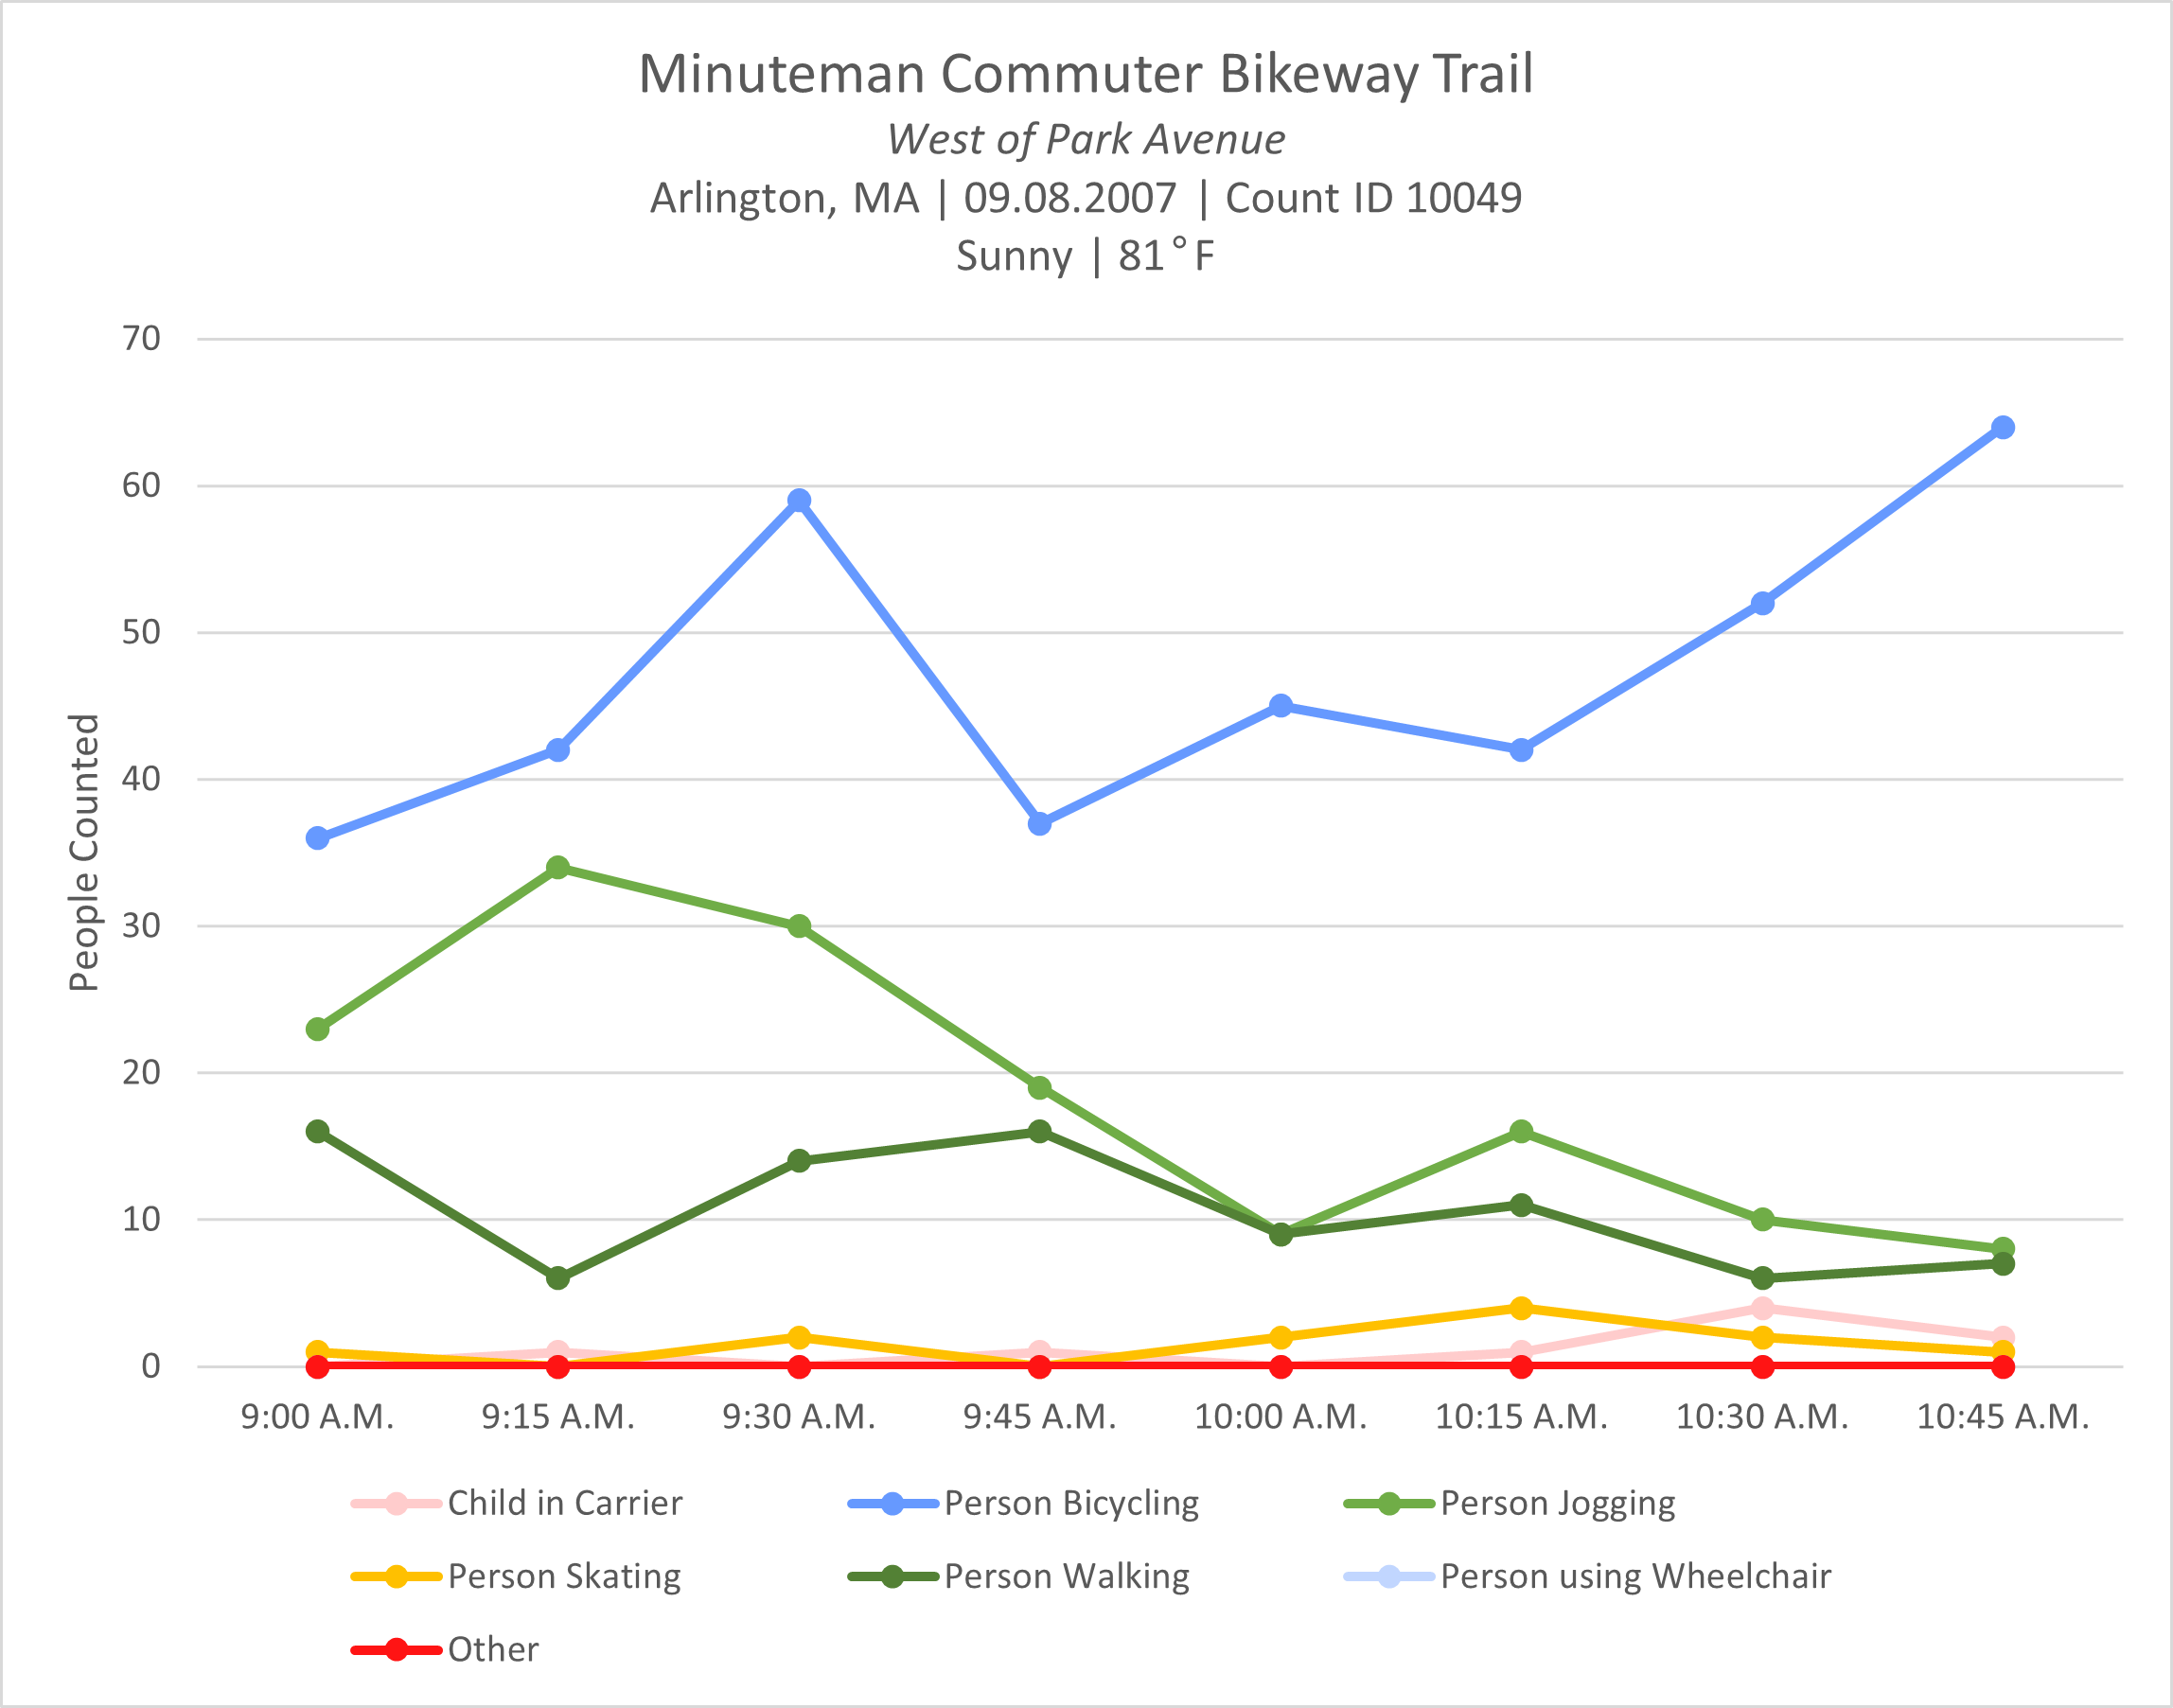
Source: Central Transportation Planning Staff.
Historically, the Boston Region MPO’s bicycle and pedestrian count data have been collected manually. Counts have typically been collected by volunteers, MPO staff, municipalities, state employees, and advocacy organizations during the months of May and September. MPO staff are improving and expanding the Boston region’s bicycle and pedestrian count data by updating the manual data collection process and acquiring automated bicycle and pedestrian count sensors.
MPO staff have developed a new bicycle and pedestrian count data collection spreadsheet that they will encourage all data collectors to use when they submit manually collected bicycle and pedestrian count data going forward. In the past, both an Excel spreadsheet and a PDF had been shared for data collection; but the two formats differed, complicating data standardization once the count information was submitted to MPO staff. Processing data submitted using the PDF template proved especially difficult because data were often submitted as an image of handwritten notes on a printed copy of the PDF document. This format created room for misinterpretation and made the process of inputting count information to the database time intensive.
To avoid confusion and streamline data input, MPO staff will replace both the previously distributed spreadsheet and the PDF data collection document. Manual data can now be collected using the newly designed spreadsheet on a tablet or other mobile device, or data collectors can write out their count notes and transcribe them into the spreadsheet after their count session.
MPO staff’s primary focus was making the new data collection spreadsheet as user-friendly as possible while ensuring a straightforward format for manual data collectors to report their bicycle and pedestrian count information. As part of this process, MPO staff protected every cell except the data entry cells, which means that data collectors will only be able to input information into the cells where data is expected. This update should minimize any confusion that might occur because of accidental cell modifications or deletions, especially if those cells contain explanatory information.
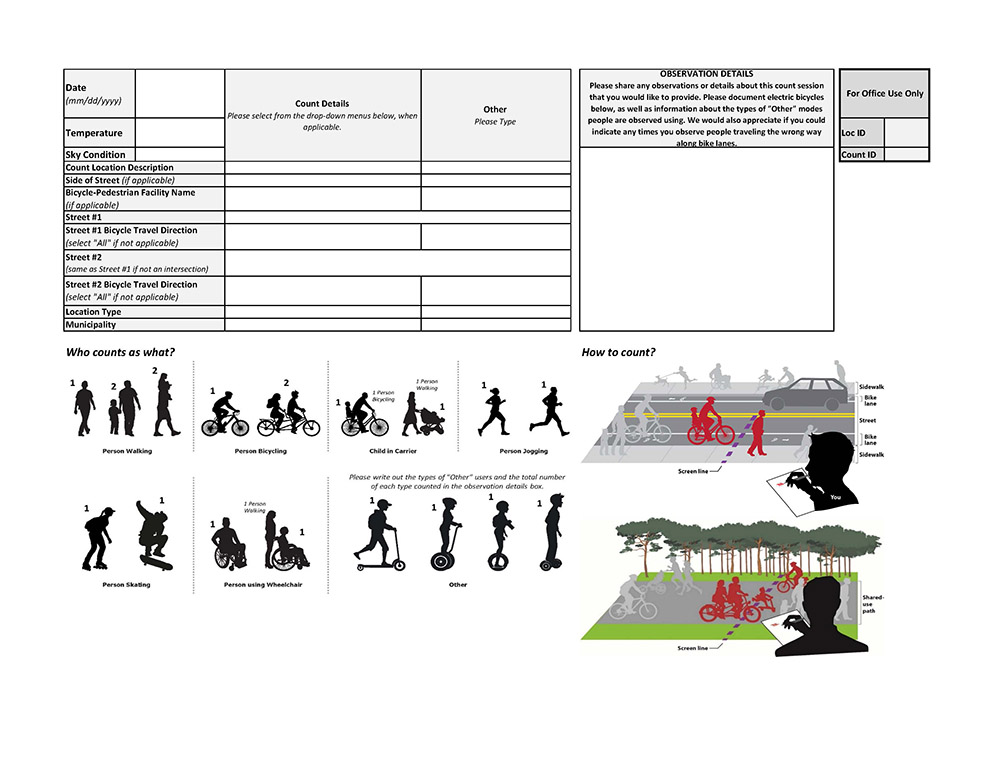
In the spreadsheet’s “Overview” tab, MPO staff created dropdown menus (Figure 9). These menus are populated with descriptions from the 2009 count data application that MPO staff clarified for ease of use. These dropdown options will allow data collectors to select the appropriate responses for their count sessions for several categories.1 To allow data collectors to record information about conditions not specified in the predetermined entries, MPO staff included cells beside the dropdown menus where data collectors could specify their count session details.
Other features that MPO staff added to the “Overview” tab include graphics to help data collectors identify how to categorize the different people that they observe traveling at their count location. The tab additionally incorporates graphics that show how data collectors should use an imaginary screen line to count people traveling along both roadway and shared-use path segments. The final component of the “Overview” tab that data collectors can use is a box where they are encouraged to provide any context from their count session. These notes could mention events that might have impacted volumes, describe the other modes people at the count location were seen using, or comment on the number and type of electric devices observed.
Figure 9
Updated Count Data Collection Spreadsheet Overview Tab
Source: Central Transportation Planning Staff.
MPO staff divided the spreadsheet to record eight data collection periods, creating a tab for each three-hour segment of the day, starting at 6:00 AM. While manual counts are typically constrained to daylight hours, MPO staff extended the spreadsheet to accommodate 24 hours of data collection because we anticipate adding automatic count sensor data, which are continuously collected.
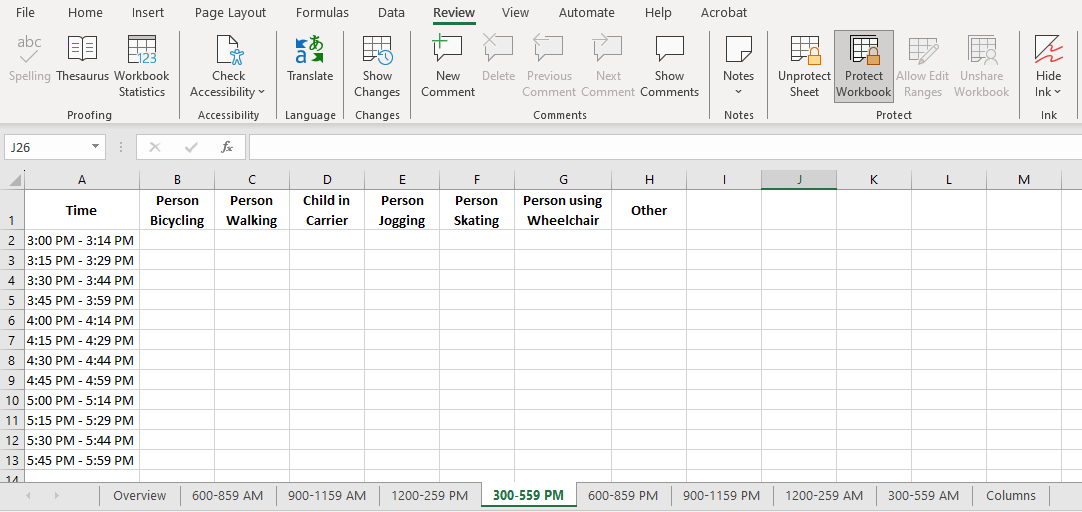
The rows of the data collection spreadsheet correspond to the 15-minute intervals within a data collection session, while each column represents one of the seven categories of the bicycle and pedestrian modes that the MPO has historically recorded when counting people bicycling and walking throughout the Boston region (Figure 10). This method indicates whether people are seen bicycling, walking, jogging, skating, or using a wheelchair, or whether there is a child in a stroller or bicycle carrier. The data collector can also indicate if a person is using another means of travel (e.g. riding a scooter, Segway, Jyroball, onewheel, etc.). Data collectors’ count sessions can include more than one spreadsheet tab, depending on when they are collecting data, but every peak period fits within one of the predefined tabs for data collection.2
Figure 10
PM Peak Data Collection Spreadsheet Tab
Source: Central Transportation Planning Staff.
In 2014, the Boston Region MPO’s Bicycle and Pedestrian Count Program moved away from sorting counts according to the seven categories of bicyclists and pedestrians shown in Figure 10. Instead, the program changed to conform with the recommendations of the National Bicycle and Pedestrian Documentation Project (NBPD), an Institute of Transportation Engineers (ITE)-sanctioned program. The NBPD advised consolidating counts into three groups: people bicycling, including children in bicycle carriers; people walking, including people jogging, people using wheelchairs, and children in strollers or carriers; and other users, such as rollerbladers, skaters, and skateboarders. The NBPD was discontinued after September 2019, however.
Fortunately, the Boston Region MPO has data stretching back decades that distinguishes between different types of pedestrians and bicyclists. As the MPO prepares to expand its Bicycle and Pedestrian Count Program with automated bicycle and pedestrian count data collection, MPO staff would like to take advantage of the additional detail that manually collected data can provide. Automated bicycle and pedestrian count sensors cannot differentiate beyond people bicycling and people walking to identify who is jogging and who is using a wheelchair, for example, so manual data collection will be valuable when trying to understand the different types of modes people choose to take at various locations throughout the Boston region.
One component that MPO staff are interested in collecting—even though it does not conform with the Boston region’s historic bicycle and pedestrian count data—is information regarding electric bicycle and scooter use. Currently, people using electric bicycles would be counted as “people bicycling” and people using electric scooters would be counted in the “other” category, but MPO staff encourage manual data collectors to make note of such users. The types and totals of electric travel modes seen by data collectors should be documented in the observation details box provided on the “Overview” tab of the data collection spreadsheet.
MPO staff developed a program to facilitate the process of entering manually collected bicycle and pedestrian count data into a database for the Boston Region MPO. This process makes it possible for every bicycle and pedestrian count submitted to the MPO using the new data collection spreadsheet to be extracted from the spreadsheet and programmatically submitted to a bicycle and pedestrian count database. The key to this process is that all counts must be submitted using the exact same spreadsheet format. Protecting the entirety of the spreadsheet except for the data entry cells, as MPO staff have done, should ensure that all the manually collected bicycle and pedestrian data that the Boston Region MPO receives can be quickly and easily posted to the MPO’s website via the count data application after MPO staff validate the information. By introducing this automated process, we can eliminate the potential for error during data entry and inputting as well as reduce the time spent by MPO staff on this task.
To better understand and plan for safe and comfortable walking and bicycling conditions throughout the Boston region, MPO staff have purchased three Eco-Counter Mobile MULTI units to collect continuous bicycle and pedestrian travel data. The ability to constantly gather information about people’s walking and bicycling behavior will provide insight into temporal variations within a given day as well as differences between travel choices on weekdays, weekends, and holidays at the same location. Such an exercise would be logistically challenging and prohibitively expensive to conduct using manual data collectors. The automated sensors will also allow MPO staff to collect data from the same location over time, providing continuity in a way that the practice of welcoming counts from those willing to collect and provide them often does not.
MPO staff hope to purchase a fourth Eco-Counter Mobile MULTI unit to have two sets of two automatic count sensors. Each set will be able to provide insight into the travel behavior of people walking and bicycling on both sides of the street at a given location. The units can be installed across the street from one another to count the number of people traveling along the sidewalk and in the roadway near the curb.
MPO staff selected the Eco-Counter Mobile MULTI unit because of three advantageous reasons. First, it can be moved to various locations instead of requiring permanent installation. Second, the unit can count both bicyclists and pedestrians at the same time. Finally, it is included among MassDOT’s list of pre-approved counters for continuous and temporary use. MPO staff reached out to other pre-approved providers from MassDOT’s list and found that the Eco-Counter Mobile MULTI unit best suited the Boston Region MPO’s needs.
In December 2023, MPO staff sent out manual data collectors to gather data about people walking and bicycling to validate the bicycle and pedestrian count data collected by their Eco-Counter Mobile MULTI units at the exact locations where the devices were installed. MPO staff are processing the data and, if discrepancies are noted between the automatically collected and manually counted data, MPO staff will develop a modification factor to use for future data collected using the automated sensors.
After MPO staff have compared the data collected by the Eco-Counter Mobile MULTI units with the information gathered by field staff, they intend to deploy the automatic count sensors at a variety of locations within the Boston region. One unit will be installed on each side of a roadway, counting people walking and bicycling along each side of the street. Each count device will remain in place for a two-week period at one location and will be rotated between the selected locations during two consecutive years, collecting data twice at each location for a total of four weeks of data per count location. Those locations where the Eco-Counter Mobile MULTI units are installed between mid-October and mid-April during the first year will be the site of another automated count sensor installation between mid-April and mid-October the following year. This will ensure that the Boston Region MPO has data for each location during both warmer, longer days and cooler, shorter ones.
To select the count locations, MPO staff identified municipalities for consideration by constructing an equity score that provided greater weight to municipalities with equity populations as well as populations who display less auto-dependent behavior. MPO staff used a combination of sociodemographic variables, such as age, race, ethnicity, limited English proficiency status, and disability status, and travel behavior indicators, such as private vehicle ownership and commute mode, to construct the equity score. This equity score helped staff create a ranked list of the 97 municipalities in the Boston region, which was further refined by the MPO’s eight subregions.
MPO staff narrowed their field of consideration to the top three ranked municipalities from each subregion, leaving 24 municipalities as potential locations for data collection. MPO staff then used MassDOT’s Potential for Everyday Biking and Potential for Walkable Trips datasets to assess the potential demand for walking and biking throughout the 24 municipalities. MPO staff also used infrastructure data to identify locations within the municipalities where there has been investment in bicycle and pedestrian accommodations. MPO staff anticipate selecting two locations within one municipality that have similar potential levels of demand by people walking and bicycling. Then they would install automatic data collection sensors at one location that has bicycle and pedestrian accommodations and at another location lacking those types of facilities.
The staff of the Boston Region MPO’s Bicycle and Pedestrian Planning Program have been working on three key efforts to expand its count program. First, MPO staff have updated the count data application, which was created in 2009, to make it easier for users to download and visualize bicycle and pedestrian counts at different locations across the region. These data go back all the way to 1974 and contain detailed information on different categories of pedestrians and bicyclists, which can be valuable for a diverse range of stakeholders.
Second, we addressed a critical bottleneck in our data storage process. Previously, manual data collectors had the option to submit their counts as handwritten notes on a paper printout of a PDF. This introduced the potential for misinterpretation when staff were inputting these data into a centralized database and added to staff time spent on this task. We designed a new data collection spreadsheet that can improve how the MPO receives manual count data. Additionally, we created an automated process to read data from the submitted spreadsheets and transfer them over to the database in a standardized manner, thereby reducing staff time and the potential for error.
Third, we are incorporating state-of-the-art automated count sensors in our data collection efforts. These sensors can provide continuous bicycle and pedestrian count data in 15-minute intervals. They can also be moved to different locations with relative ease. We are currently in the process of validating automated counts against manually collected data. Following this task, we are planning to use our inventory of automated sensors to collect data at 26 locations across the Boston region for two two-week periods, once from mid-April to mid-October and once from mid-October to mid-April.
While these changes will likely require continued learning and growth to establish, we believe they hold considerable promise for enhancing bicycle and pedestrian planning in the Boston region. Moving forward, we hope to expand our count data across the region, using both automated and manual collection techniques, and allow a wide variety of stakeholders to visualize, download, and engage with the data. The data resource we will create will help us better understand bicyclist and pedestrian travel behavior and enable us to make more data-informed planning decisions.
1 The dropdown menu categories are “Sky Condition,” “Count Location Description,” “Side of Street,” “Bicycle-Pedestrian Facility Name,” “Street #1 Bicycle Travel Direction,” “Street #2 Bicycle Travel Direction,” “Location Type,” and “Municipality.”
2 Historically, the Boston Region MPO has requested weekday AM peak period counts from 7:00 AM to 9:00 AM, weekday PM peak period counts from 4:00 PM to 6:00 PM, and weekend peak period counts from 12:00 PM to 2:00 PM.
The Boston Region Metropolitan Planning Organization (MPO) operates its programs, services, and activities in compliance with federal nondiscrimination laws including Title VI of the Civil Rights Act of 1964 (Title VI), the Civil Rights Restoration Act of 1987, and related statutes and regulations. Title VI prohibits discrimination in federally assisted programs and requires that no person in the United States of America shall, on the grounds of race, color, or national origin (including limited English proficiency), be excluded from participation in, denied the benefits of, or be otherwise subjected to discrimination under any program or activity that receives federal assistance. Related federal nondiscrimination laws administered by the Federal Highway Administration, Federal Transit Administration, or both, prohibit discrimination on the basis of age, sex, and disability. The Boston Region MPO considers these protected populations in its Title VI Programs, consistent with federal interpretation and administration. In addition, the Boston Region MPO provides meaningful access to its programs, services, and activities to individuals with limited English proficiency, in compliance with U.S. Department of Transportation policy and guidance on federal Executive Order 13166.
The Boston Region MPO also complies with the Massachusetts Public Accommodation Law, M.G.L. c 272 sections 92a, 98, 98a, which prohibits making any distinction, discrimination, or restriction in admission to, or treatment in a place of public accommodation based on race, color, religious creed, national origin, sex, sexual orientation, disability, or ancestry. Likewise, the Boston Region MPO complies with the Governor's Executive Order 526, section 4, which requires that all programs, activities, and services provided, performed, licensed, chartered, funded, regulated, or contracted for by the state shall be conducted without unlawful discrimination based on race, color, age, gender, ethnicity, sexual orientation, gender identity or expression, religion, creed, ancestry, national origin, disability, veteran's status (including Vietnam-era veterans), or background.
A complaint form and additional information can be obtained by contacting the MPO or at http://www.bostonmpo.org/mpo_non_discrimination.
To request this information in a different language or in an accessible format, please contact
Title VI Specialist
Boston Region MPO
10 Park Plaza, Suite 2150
Boston, MA 02116
civilrights@ctps.org
By Telephone:
857.702.3700 (voice)
For people with hearing or speaking difficulties, connect through the state MassRelay service:
Relay Using TTY or Hearing Carry-over: 800.439.2370
Relay Using Voice Carry-over: 866.887.6619
Relay Using Text to Speech: 866.645.9870
For more information, including numbers for Spanish speakers, visit https://www.mass.gov/massrelay