HELP SHAPE THE TRANSPORTATION VISION FOR THE FUTURE:
Interactive Discussion about the Boston Region MPO’s Long-Range Transportation Plan
MAPC WINTER COUNCIL MEETING
February 25, 2015
WHAT IS CHARTING PROGRESS TO 2040?
Charting Progress to 2040 is the Boston Region Metropolitan Planning Organization’s next Long-Range Transportation Plan (LRTP). The LRTP creates a 25-year vision for transportation in the region and sets priorities for future federally funded transportation planning studies and projects. It will guide the allocation of an expected $2 billion over the planning period.
GOALS FOR THE WORKSHOP
- Gather ideas for the MPO about how the region’s limited financial resources should be divided among its many transportation needs
- Generate input to guide the MPO’s priorities for capital project spending
TODAY’S ACTIVITIES
Creating Investment Portfolios
Attendees will participate in an activity through which they, like MPO members, will grapple with the challenge of prioritizing future transportation investments within the constraints of available funding by balancing the region’s goals with its needs. Each table will receive a stack of chips totaling $2 billion: the amount of discretionary funds that likely would be available for the Boston region between now and 2040.
Using their equal share of chips, each participant will express his/her initial, individual preferences for funding priorities by dividing their chips among the MPO’s spending programs (on the “board” at the center of the table). Participants at each table then will review the combined results and negotiate a group consensus for the amount of spending in each of the investment programs.
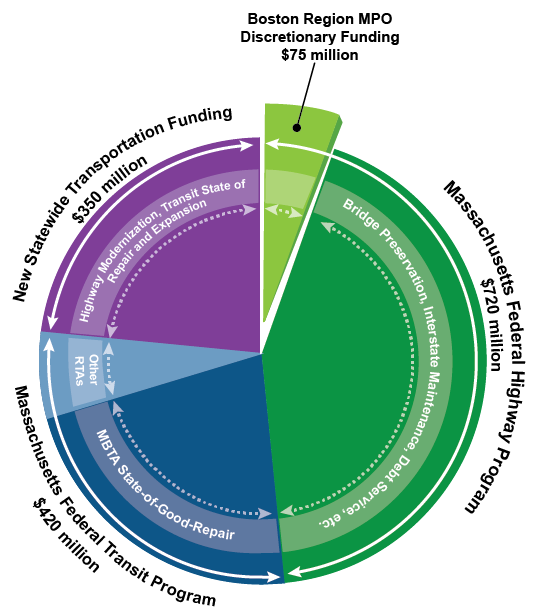
OVERVIEW OF AVERAGE ANNUAL TRANSPORTATION FUNDING
These sources provide the primary funding for maintenance, modernization, and expansion of the transportation system:
- Federal highway program – funds maintenance of the highway system through:
- Bridge preservation
- Interstate maintenance
- Roadway reconstruction
- Intersection improvements
- Bottleneck improvements (expressways and major arterials)
- Bicycle and multi-use paths and flex to transit
- Federal transit program – funds state-of-good-repair for the MBTA and other regional transit agencies
- Statewide program – funds various highway and transit needs in all corners of the Commonwealth
A portion of the funds from the federal highway program are allocated to each MPO to be programmed for transportation infrastructure priorities in their region.
The Boston Region MPO’s discretionary funding is indicated by the green slice of the pie chart. This is the funding the MPO will have available to fund its priorities for transportation infrastructure investments over the next 25 years.
Average Annual Transportation Funding
INTERSECTION IMPROVEMENTS

Description: Modernizes existing or adds new intersections to improve safety and mobility. Safety improvements could consist of turning lanes, shortened crossing distances for pedestrians, and striping and lighting for bicyclists. Improvements to sidewalks and curb cuts also will enhance accessibility for pedestrians. Updated signal operations will reduce delay and improve transit reliability.
Share of Past MPO Investments: 5%
Average Cost: $2.5 million per project
Example Projects:
- Hingham – Derby Street, Whiting Street (Route 53), and Gardner Street
- Norwood – Route 1 and University Avenue/Everett
- Boston – Traffic signal improvements at 11 Locations
- Holbrook – Weymouth Street, Pine Street, Sycamore Street
- Weymouth – Middle Street, Libbey Industrial Pkwy, and Tara Drive
- Marlborough – Route 20 at Concord Road
Needs:
- More than one in five fatalities in the state occurs at an intersection.
- A majority of intersections in the region have substandard signal equipment.
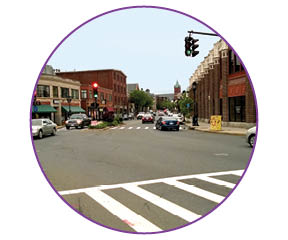
COMPLETE STREETS

Description: Modernizes roadways to improve safety and mobility for all users. Improvements could consist of continuous sidewalks and bike lanes, cycle tracks, and other bicycle facilities, and update signals at intersections along a corridor. Improvements will reduce delay and improve transit reliability. Expanded transportation options and better access to transit will improve mobility for all and encourage mode shift.
Share of Past MPO Investments: 33%
Average Cost: $6 million per mile
Example Projects:
- Lexington – Reconstruction of Massachusetts Avenue
- Everett – Reconstruction of Ferry Street
- Natick – Reconstruction of Route 27
- Hopkinton – Improvements on Route 135
- Boston – Improvements on Boylston St.
- Walpole – Reconstruction of Route 1A
Needs:
- Urban roadway corridors are high crash locations for multiple modes.
- Only three percent of the region’s streets and roads have bike lanes or cycle tracks.
- 46 percent of the MassDOT-maintained arterial roadways have substandard pavement condition.
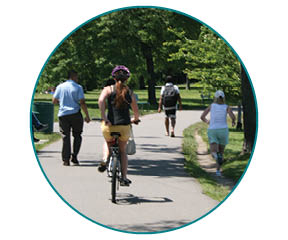
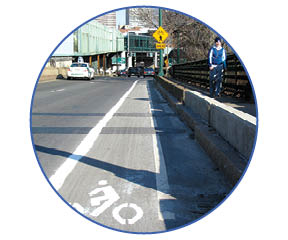
BICYCLE NETWORK AND PEDESTRIAN CONNECTIONS

Description: Expands the bicycle and pedestrian networks to improve safe access to transit, schools, employment centers, and shopping destinations. Projects could include constructing new, off-road bicycle or multi-use paths, improving bicycle and pedestrian crossings, or building new sidewalks.
Share of Past MPO Investments: 3%
Average Cost: $2 million per mile
Example Projects:
- Natick – Cochituate Rail Trail, phase two
- Boston – Multi-use path construction on New Fenway
- Bedford – Minuteman bikeway extension, Loomis Street to the Concord town line
- Salem – Canal Street bikeway
- Brookline– Emerald Necklace bicycle and pedestrian crossings
- Sudbury – Bruce Freeman Rail Trail, phases 2D and 2E
- Dedham – Pedestrian improvements along Elm Street and Rustcraft Road
Needs:
- 11 high priority gaps in the bike network have been identified, totaling approximately 30 miles.
- Outside the Inner Core, only 45 percent of the region’s streets and roads have sidewalks.
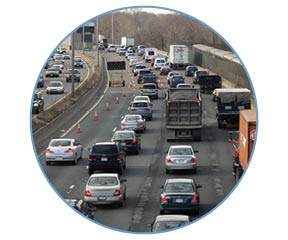
MAJOR INFRASTRUCTURE

Description: Modernizes and/or expands expressways and major arterials to reduce congestion and improve safety. Projects could include reconstructing expressway interchanges to eliminate weaving and reduce the likelihood of rollovers, adding travel lanes on expressways, or adding/removing grade separations on major arterials.
Share of Past MPO Investments: 54%
Cost Range: $20–$300 million
Example Projects:
- Woburn – interchange improvementsto I-93/I-95
- Malden, Revere and Saugus – Widening on Route 1
- Boston – Reconstruction of Rutherford Avenue
- Framingham – Intersection improvements at Route 126 and Route 135
- Braintree – I-93/Route 3 interchange (Braintree split)
- Somerville– McGrath Highway
- Natick – Route 27 over Route 9 interchange improvements
- Beverly – Interchange reconstruction at Route 128/Exit 19 at Brimbal Avenue
- Southborough and Westborough – improvements at I-495 and Route 9 interchange
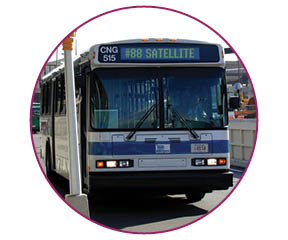
COMMUNITY TRANSPORTATION AND PARKING

Description: Provides funding to launch locally developed transit services that support first-mile/last-mile connections to existing transit services and other destinations by purchasing shuttle buses and/or funding operating costs. This program also targets funding to construct additional parking at transit stations already at capacity. Other projects to improve mobility and air quality and promote mode shift could be included in the future.
Share of Past MPO Investments: 2%
Cost Range: $35,000 per parking space, $100,000–$400,000 per Clean Air and Mobility project, and $1.5 million per new service
Example Projects:
- Hubway expansion
- Parking at transit stations
- Transportation demand management strategies
- Metrowest RTA routes 1 and 7
Needs:
- 20 percent of transit parking lots are at capacity. More than 60 percent of those lots are located at commuter rail stations.
- Many municipalities are interested in improving links to existing transit service and expanding local transit service.
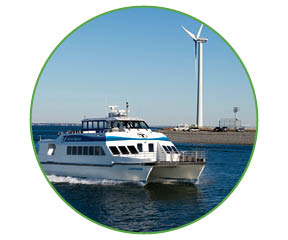
FLEX TO TRANSIT

Description: Funds transit improvements beyond those needed to bring the system into a state-of-good-repair and to conduct routine maintenance and modernization. Projects could include expanding the transit system (such as bus rapid transit routes or ferry service) or upgrading transit assets (such as transit vehicles, vessels, or other equipment).
Share of Past MPO Investments: 3%
Cost Range: $10–$250 million
Example Projects:
- Diesel multiple unit service
- Improved inner harbor ferry service
- Cross-town/circumferential transit
- Green Line cars
- Green Line extension to Route 16
- Assembly Square station
Needs:
- One-quarter of the stations in both the commuter rail and rapid transit system are not ADA accessible.
- Fleet overhaul of the No. 3 Red Line cars that are 20 years old.
- Replacement of Green Line cars that are beyond their useful life.