Memorandum
Date November 1, 2012
To MassDOT Highway Division District 4 Town of Danvers
From Chen-Yuan Wang, Mark Abbott, Steven Andrews, and Christine Bettin MPO Staff
Re Route 114 in Danvers, Interstate 95 to the Peabody City Line:
Safety, Operations, and Access Management Study
The arterial segment of Route 114 between Interstate 95 (I-95) and the Peabody city line in Danvers is one of two corridors that were selected for analysis as part of a larger study: Priority Corridors for the Long-Range Transportation Plan (LRTP) Needs Assessment that is included for funding in the federal fiscal year (FFY) 2012 Unified Planning Work Program (UPWP).1 The selected segment of Route 114 is located within MassDOT Highway Division District 4.
The Boston Region Metropolitan Planning Organization’s LRTP identified several priority arterial segments in need of maintenance, modernization, safety and mobility improvements, and transit service enhancements and modernization. The identification of these arterial segments was based on previous and ongoing transportation planning work, including the Boston Region MPO’s Congestion Management Process (CMP), the MBTA’s Program for Mass Transportation (PMT), and other MPO planning studies. To help identify solutions for addressing problems in some of these arterial segments, a priority corridor study was included in the FFY 2012 Unified Planning Work Program (UPWP) to address mobility, safety, and preservation concerns for arterial segments.
MPO staff worked closely with the Massachusetts Department of Transportation (MassDOT) Highway and Planning divisions and communities in the Boston Region MPO area to identify two high-priority arterial segments for study. The selection was performed through a comprehensive process that included the screening of 31 arterial segments in 52 communities in the MPO region and correspondence with MassDOT Highway Division District offices and MPO communities. Criteria applied in the selection included:
The arterial segments that were selected for study are:
An arterial segment study is usually a logical way to address multimodal transportation needs in a corridor, as it allows a roadway corridor to be evaluated comprehensively for users of all modes: pedestrians, bicyclists, motorists, and public transportation users are considered, using a holistic approach to the analysis of the issues and associated improvement recommendations. The resulting solution is an improved roadway corridor, where it is safe to cross the street and walk or cycle to shops or schools, and for recreation; where buses can run on time, and where it is safe for people to walk to and from train stations. Typically, an arterial segment study addresses issues, analyzes services, makes recommendations for the area within the roadway’s right-of-way, and takes into account the needs of the abutters and users.
Route 114, in the North Shore region, is a principal arterial that connects three major highways (Route 1, I-95, and Route 128). It proceeds through commercial and high-density residential areas in Danvers, Peabody, and Salem. The segment of Route 114 east of I-95 in Danvers was selected for study due to its regional significance in serving regional traffic demand and providing access to a number of major commercial developments. It is a congested section that has a relatively high number of crashes. Although pedestrian and bicycle crashes were not noticeably high, a fatal crash involving a pedestrian occurred in February 2012. MassDOT and the Town of Danvers are concerned about the lack of sufficient pedestrian and bicycle accommodation in the corridor. The Town of Danvers is interested in making improvements for bicyclists and pedestrians, while continuing to meet business and other transportation needs.
This study focuses on a one-mile section of Route 114, also known as Andover Street, in Danvers between the I-95 interchange (not included) and the Peabody line. Relevant transportation and land use data in the North Shore region and the areas adjacent to the study section were also collected in support of the analyses in this study.
The purpose of this study is to identify the safety, mobility, access, and other transportation-related problems for all transportation modes and to develop multimodal transportation recommendations for improvements to address those problems.
This memorandum contains the following sections:
This memorandum also includes technical appendices that contain relevant data and methods and data that were applied in the study.
Figure 1 shows the location of the study corridor and major transportation facilities in the region. Route 114 is a state-owned principal arterial located in northeastern Massachusetts. It is mainly a two-lane roadway (one travel lane in each direction) that runs in the east-west direction from Salem to Lawrence. In the North Shore region, it goes through commercial and high-density residential areas in Danvers, Peabody, and Salem and widens to four lanes between Route 1 and Route 128.
The region has a one major interstate highway (I-95) and three principal arterials (Route 1A, Route 128, and Route 114). Although Route 1 is classified as a rural minor/urban principal arterial, it is a four-lane highway with access controls in the section parallel to I-95. Route 114 can be regarded as the major roadway connecting I-95, Route 1, and Route 128. Its parallel routes, Route 62 and Lowell Street in Peabody, have a generally lower travel speed and limited access to both I-95 and Route 128.
Major transit services in the region include the Massachusetts Bay Transportation Authority (MBTA) commuter rail Rockport Line and a number of MBTA bus routes. The commuter rail runs along the coast parallel to Route 1A and has two stations, Salem Depot and Beverly Depot, which are a few miles from the study corridor.
Among the MBTA bus routes in the region, Routes 435, 436, and 465 are the most relevant to the study corridor. Bus Route 435 runs between Central Square in Lynn and Liberty Tree Mall in Danvers via downtown Peabody and the Northshore Mall. Bus Route 436 also runs between Central Square and Liberty Tree Mall but via Lynnfield Street in Lynn and the Northshore Mall. Bus Route 465 runs between Salem Depot and Danvers Downtown via the Northshore Mall and Liberty Tree Mall. Generally, these routes provide bus service one time per hour in each direction during both the AM and PM peak periods.
Recently two major bike trails were constructed and opened to the public. Peabody Bikeway, built in 2008, is a 6.6-mile bike path that runs from the trailhead at the Northshore Mall through West Peabody near Lowell Street to neighboring Middleton and provides links to several conservation areas located along the path. The Danvers Rail Trail, which opened in June 2012, is a 4-mile multiple-use trail that runs on a converted railroad right-of-way from the Wenham town line to just south of the study corridor at the Peabody city line (see Appendix A for the rail trail map and information). It is a part of the Border-to-Boston Bike Trail, which is still under construction, but most of the sections from the New Hampshire border in Salisbury to the southern end of the trail are now open to users. The trail will continue farther south from the Peabody city line and eventually will reach Boston.
Two other railroads in the study area have been discussed for conversion to bike trails. The Essex Railroad Rail Trail would be located north of Route 114 and would run from Lawrence to downtown Peabody. In the study area, it would run parallel to Route 35 between Route 62 and Route 114. The other trail would be located mainly in Peabody and would run parallel to Washington Street and Lynnfield Street from downtown Peabody to the Lynn city line. There are no concrete plans for the design or construction of the two proposed trails at the moment.
Figures 2 and 3 show the average travel speeds in the AM and PM peak periods on Route 114 and other major roadways in the region. The AM peak-period travel speeds were collected between 6:30 AM and 9:30 AM; the PM peak-period travel speeds were collected between 3:30 PM and 6:30 PM. The data were collected as part of the Boston Region MPO’s congestion management process (CMP).
Speed runs for Route 114 were conducted for both directions. The areas of Route 114 that have the slowest observed travel speeds are near the historical downtown section of Salem, where observed travel speeds are generally under 20 mph. From downtown Salem to Route 128, the observed travel speeds were generally less than 30 mph. There are also slow speeds in the vicinity of Route 128. The eastbound speed between the Route 128 interchange and Pulaski Street in Peabody is lower than 20 mph.
West of Route 128 and east of Sylvan Street in Peabody, travel speeds on Route 114 are generally less than 30 mph in both directions, and the eastbound speed in the PM peak-period was less than 20 mph. West of Sylvan Street, as developments become less dense, travel speeds on Route 114 gradually increase. The study corridor generally has an observed travel speed of over 30 mph, except for the eastbound section just east of I-95. The section from I-95 to Garden Street in the AM peak period and to Brooksby Village Drive in the PM peak period has a travel speed ranging from 25 to 30 mph.
In addition to Route 114, the area’s major east-west arterials are Route 62 and Lowell Street in Peabody. Route 62 goes though mostly residential areas and generally has a travel speed of over 30 mph. It has lower speeds in the vicinity of Route 128 and Route 35, with its lowest travel speeds in the westbound direction approaching Route 128 and Route 35. Lowell Street is a principal arterial that does not have a route number designation. It goes through commercial and dense residential areas. Most sections of the roadway have a travel speed of 30 mph or lower in both directions during both peak periods. Travel speeds in the PM peak period are generally lower than the AM peak period.
The posted speed limit in the study section of Route 114 is 40 miles per hour (mph) in both directions. A recent traffic study indicated that the section of Route 114 (Andover Street) adjacent to Brooksby Village Drive has an average travel speed of 33 mph in the eastbound direction and 30 mph in the westbound direction, with 85th-percentile speeds of 42 mph in the eastbound direction and 43 mph in the westbound direction, based on a 24-hour automatic traffic recorder’s spot speed measurement.3 The speeds along Andover Street were observed to be lower or generally consistent with the posted speed limit of 40 mph, most likely due to the number of traffic signals in the study corridor.
Figure 4 shows the existing traffic and pedestrian facilities, driveway locations, and adjacent developments in the study corridor. The corridor provides access to a number of major commercial developments and is designated as a regional business district. There are six signalized intersections and four unsignalized intersections in the one-mile study section. In total, 35 driveways directly connect to Route 114 in this section, including four from individual homes. Only the driveway for Lowe’s is clearly marked as a right-in-only driveway. The widths of the driveways vary at different locations. Most of them allow two-way traffic. A few of them are only wide enough to accommodate one-way traffic but are not clearly marked as right-in-only or right-out-only.
The corridor also provides access to a number of side streets, including Avalon Bay Drive, Garden Street, Brooksby Village Drive, McArthur Boulevard, and Palmer Avenue. Most of them are local streets that connect neighborhoods. Garden Street is an urban minor arterial that connects with Centre Street and Holten Street further north. It is a popular route for reaching downtown Danvers and the areas further north or east.
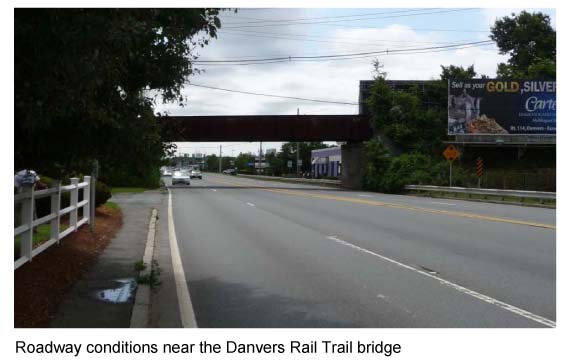
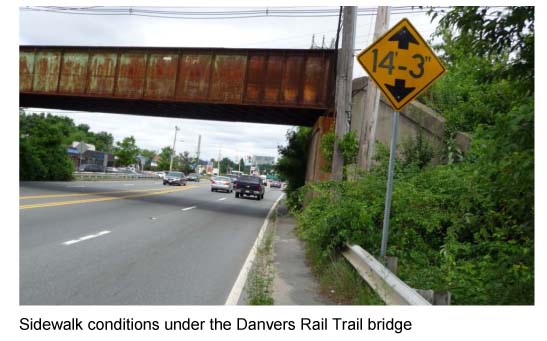
In this corridor, a bridge that used to carry trains and now is a section of the Danvers Rail Trail spans Route 114 located about 300 feet east of Garden Street. The area under the bridge is the narrowest section of the corridor, which has a lateral clearance of about 60 feet or less (see the picture below).
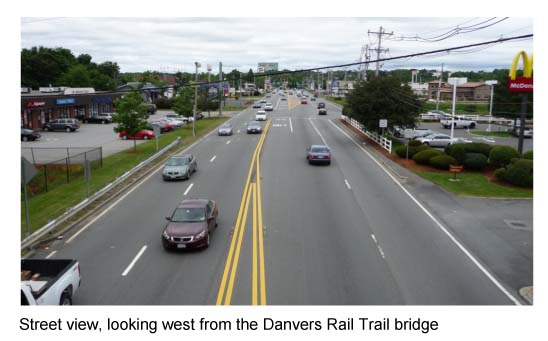
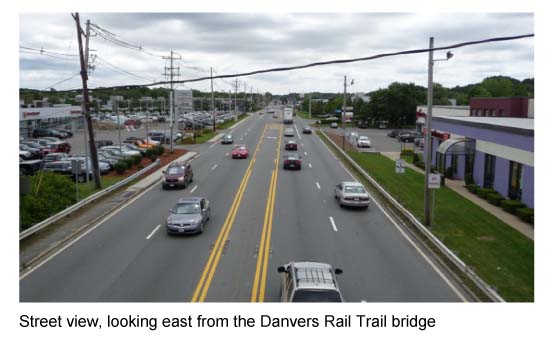
Most sections in the corridor contain five travel lanes, two in each direction for through and right-turning traffic and a middle lane for left-turning traffic. The middle lane is configured either as an exclusive left-turn lane or as a two-way left-turn lane (TWLTL). The following two pictures show the existing roadway conditions on Route 114 in the vicinity of the rail bridge.
One foreseeable change in development in the corridor is the relocation of the existing Toyota dealership north of the intersection of Route 114 at Avalon Bay Drive. It will merge with existing dealerships north of the intersection of Route 114 at Brooksby Village Drive. The intersection will be converted from three-way to four-way. These changes are shown in Figure 4.
Along Route 114, there is a four-foot-wide sidewalk on the north side of Route 114 and no sidewalk on the south side. In the one-mile study section, there is only one crosswalk across Route 114, located west of Brooksby Village Drive. The pedestrian crossing distance across Route 114 varies from approximately 60 feet to 80 feet. Most sections of the sidewalk are in fair condition. The section under the Danvers Rail Trail bridge is somewhat narrower than four feet and is deteriorating. Weeds growing from the sidewall occupy sidewalk space. It is uncomfortable and unsafe for pedestrians to walk in this section (see the picture below).
There are no bus stops in the study corridor. MBTA bus Routes 435, 436, and 465 travel on Route 114 near the Northshore Mall and turn off onto Sylvan Street, which is located about half a mile east of the study corridor.
There are no bicycle facilities along Route 114. The combination of the lack of paved shoulders, 11-foot outside travel lanes, a 4-foot sidewalk on the north side, and lack of a sidewalk on the south side create an environment with very little space for bicyclists. Although there are no bicycle accommodations, occasionally bicyclists were observed on this section of Route 114.
The Danvers Rail Trail crosses over Route 114 just east of Garden Street. The Danvers Rail Trail merges with the Border-to-Boston Bike Trail to the north and south, which also connects with the Peabody Bikeway. Route 114 provides a major east-west connection between residential areas and numerous commercial areas in the vicinity of the corridor, as well as to downtown Salem and the Salem commuter rail station, which are farther east.
Street cross-sections are essential for analyzing the accommodation of various travel modes in a transportation corridor. This study corridor was classified into three different cross-sections for this study. Figure 5 shows the major components in the three different sections. The cross-sections present street views looking east by an eastbound driver. The major characteristics of each of the three sections are summarized below. It should be noted that the measurement of the various roadway elements were approximated from field observations and aerial photography, not from actual field surveys.
Based on the 2011 MassDOT Road Inventory file, the entire study corridor has a 90-foot right-of-way. However, the available right-of-way appears to be less than 90 feet in some sections, since a quick review of the Danvers assessor’s maps indicates that some sections in the corridor have a right-of-way of about 80 feet. These include the sections between Garden Street and the rail trail bridge, between the Walmart driveway and Brooksby Village Drive, and between McArthur Boulevard and Palmer Avenue.
Land uses in the study corridor consist of mainly retail and commercial uses. A section on the north side of Route 114 between Palmer Avenue and McArthur Boulevard is residential. The areas on both sides of Route 114 in Danvers are designated as Zone 114A, a regional business zone (see Appendix B: Zoning Map, Town of Danvers). The areas adjacent to the study corridor in Peabody are designated as Regional Business (BR) and Single-Family Residence (R1B, see Appendix C: Zoning Map, City of Peabody).
It should be noted that the vacant land east of Brooksby Village Drive and south of the existing car dealerships and the nursery is currently designated as R1B. It is the same zoning designation as Brooksby Village. The vacant land has a potential for development in the near future.
The study corridor carries about 40,000 to 45,000 vehicles per day. The MassDOT Road Inventory file’s 2009 average daily traffic (ADT) estimate for a number of sections in the study corridor is 40,659 vehicles per day. This ADT refers mostly to the sections east of Garden Street. However, the section west of Garden Street, upstream from I-95, probably has an ADT of about 45,000 vehicles per day, because a three-weekday traffic count in June 2008 performed by MassDOT indicated that the section of Route 114 just east of I-95 had an average of about 45,500 vehicles per day (see Appendix D).
Traffic delays in the corridor occur mainly at signalized intersections. Further analyses of delays at the signalized intersections are summarized in the section “Arterial Operations Analysis” in this memorandum.
Table 1 shows the approach volumes and total intersection entry volume in the weekday PM peak hour and the Saturday peak hour at major signalized intersections in the study corridor. On average, these intersections each carry about 3,250 to 4,550 vehicles per peak hour and are expected to increase 5 percent to 6 percent in the next five years.
The available traffic counts used in recent traffic studies show that the study corridor carried average or slightly low truck volumes. During the weekday PM peak hour and the Saturday peak hour, the percentage of total vehicles entering the intersections in the study corridor that are trucks is about 1.0 to 1.5 percent. Buses are scarce in the corridor. School buses usually do not operate in the weekday PM peak hour or the Saturday peak hour.
The corridor is located in a suburban area and usually has a relatively low number of pedestrians and bicycle users. In general, Massachusetts residents have increased awareness of health and environmental benefits from walking and bicycling as their transportation modes. Presumably the number of pedestrians and bicyclists will increase gradually in the study corridor in the future.
No pedestrian or bicycle counts are readily available for the study corridor. A recent traffic study provides a glance of pedestrian activities in the corridor .4 Table 2 shows the number of pedestrian crossings during the weekday PM and Saturday peak periods and peak hours at four intersections in the middle section of the study corridor, from counts performed in October 2011. The table shows that pedestrians are generally more active on Saturdays than on weekdays. The intersection of Route 114 at Garden Street carried more pedestrians than the other intersections in the section. It had about 5 pedestrian crossings during the three-hour PM peak traffic period and about 15 crossings during the Saturday peak period.
Crash data are an essential source for identifying safety and operational problems in a study area. Analyses of crash locations, collision types, time of day, roadway conditions, and other factors can also assist in developing improvement strategies. To obtain sufficient data for analysis, staff collected three sets of data from available resources. The three data sets are:
Based on the MassDOT crash data, Table 3 shows that, on average, about 52 crashes occur within the study area each year. About 43 percent of the crashes resulted in personal injuries, and about 57 percent of the crashes involved property damage only or had unknown severity. There were no crash fatalities along the study corridor during the five-year period. The crash types consist of approximately 39 percent angle collisions, 38 percent rear-end collisions, 9 percent sideswipe collisions, 8 percent single vehicle collisions, and 3 percent head-on collisions.
During the five-year period, one crash involved a pedestrian and two crashes involved bicyclists. Traffic congestion does not appear to be a factor, as 16 percent of the crashes occurred during peak periods. About 35 percent of the crashes occurred when the pavement was wet or icy. About a quarter of the crashes occurred in dark conditions.
The Town also provided crash data from the police department’s database. The data included crashes from January 2007 to December 2011. The data did not specify the geographical location, and the collision types were not categorized in the same manner as in MassDOT data set. MPO staff reviewed the data and used the data for supporting the intersection crash rate estimations. One other major purpose of examining this additional data set was to identify pedestrian and bicycle crashes in the corridor. The data show that there was only one bicycle crash that occurred in the corridor in 2010.
To identify locations in the study corridor that have potential safety concerns staff analyzed the 2005–09 MassDOT data by intersections and by segments. The intersections include signalized and unsignalized locations and the segments consist of the three sections of different cross-sections. Figure 6 shows the location and the total number of crashes by intersection and for each of the three sections, including pedestrian and bicycle crash locations.
Among the intersections examined, the intersection of Route 114 at Garden Street had a relatively higher number of crashes than other intersections of the study corridor. It had 49 crashes in the five-year period. Most of the crashes that occurred at the intersection were angle crashes.
It should be noted that among the 130 crashes in Section II, 62 crashes occurred along the segment of Route 114 between Brooksby Village Drive and MacArthur Boulevard where there are many driveways and with no signal controls. Angle and rear-end collisions contributed the largest share of the crashes in this segment. The quarter-mile segment has a two-way left-left lane (TWLTL) in the middle of the roadway and connects with 18 driveways from the adjacent commercial developments. The majority of the crashes were caused by vehicles entering or exiting developments.
Figure 6 also shows the locations of pedestrian and bicycle crashes. One pedestrian crash (in Section I) and two bicycle crashes (one each in Sections II and III) were identified from the MassDOT 2005–09 crash data set. Both bicycle crashes involved westbound traffic. In addition, a pedestrian crash and a bicycle crash (both in Section I) were identified through news reports and a crash report filed with the Danvers Police Department. The pedestrian crash was a fatal crash that occurred in February 2012. It involved a pedestrian crossing Route 114 near 151 Andover Street at 8:30 at night. The cause of the crash was not attributed to the roadway operations, nor was it the driver’s fault.
Crash rates are another effective metric for examining the relative safety of a particular location. Using both crash data sets and traffic volume data obtained from recent traffic studies, staff estimated the crash rates for the intersections in the study corridor. The crashes rates of the signalized intersections, in order from west to east, are:
The crash rates of the unsignalized intersections are:
Crashes at intersections are measured in terms of crashes per million entering vehicles. For example, the crash rate at the intersection of Route 114 at Brooksby Village Drive indicates that for every two million vehicles entering the intersection, approximately one crash is expected to occur. The average number of crashes for signalized intersections in MassDOT Highway Division District 4 is 0.78 crashes per million entering vehicles. The average number of crashes for unsignalized intersections in District 4 is 0.54 crashes per million entering vehicles. All of the intersection crash rates are lower than the District average. The intersection of Route 114 at Garden Street has the highest crash rate of 0.69.
Staff also estimated crash rates in terms of roadway segments, using the 2005–09 MassDOT crash data.
Crashes along corridors are measured in terms of crashes per million miles traveled. The average number of crashes for principal arterials in the state is 1.99 per million miles traveled. It should be noted that these segment crash rates include crashes at intersections. The relatively high crash rate in this corridor is due to the number of intersections, most of which are signalized, and the high number of driveways. For example, the section between Brooksby Village Drive and MacArthur Boulevard has a high crash rate due to the two-way left-turn lane (TWLTL) operation, with many conflict points from the adjacent driveways.
The Town also provided crash reports that had been filed with the police department from January 2007 to December 2011. Staff used all of the usable crash reports and created crash diagrams for the three intersections that had the highest crash rates in the corridor. The collision diagrams are included Appendix E.
The collision diagram for this intersection was constructed using 27 crash reports (see Figure E-1 in Appendix E). The most common crash scenario at this location was crashes between vehicles turning left onto Garden Street and vehicles traveling westbound on Route 114. Many of the rear-end crashes for vehicles approaching the intersection appear to be due to delays and queues associated with approaches at a signalized intersection.
There were a number of crashes related to the gas station located at the intersection’s southwest corner. Five crashes involved a vehicle leaving the gas station and an eastbound through vehicle traveling in the inside lane. Mostly vehicles in the outside lane stopped and obstructed the view of vehicles in the inside lane, causing the collisions. One case involved an eastbound bicycle colliding with a westbound left-turning vehicle. .
Two rear-end crashes occurred adjacent to the McDonald’s driveway. A police officer noted that it was difficult to see in the section of Route 114 under the rail trail bridge. An out-of-control crash was caused by a vehicle leaving the McDonald’s driveway. The layout of the driveway appears to be right-in only. However, the driveway is relatively wide and lacks “no exit” signs.
The collision diagram for this intersection was constructed using 13 crash reports (see Figure E-2 in Appendix E). Two crashes were caused by vehicles leaving the Guitar Center driveway. The vehicles were attempting to turn left out of the driveway when they collided with an eastbound vehicle. A rumble strip was installed at the flush median on Route 114 to discourage vehicles from making this maneuver. An eastbound vehicle was involved in a rear-end collision just before (west of) the Guitar Center driveway. It was caused by a driver who abruptly tried to turn into the Guitar Center. Closing off this entrance and forcing drivers to travel to the intersection would prevent these crashes. The other crashes at this intersection did not exhibit a noticeable crash pattern.
The collision diagram at this intersection was constructed using 16 crash reports (see Figure E-3 in Appendix E). The collision types were predominately rear-end crashes. Five of the crashes involved vehicles approaching from the east, which has a relatively long stretch with no traffic signals. Three involved vehicles approaching the intersection from the west. Five rear-end crashes occurred at the westbound departure approaches of the intersection. These crashes were related to the driveways at the banquet hall and auto dealership at 105 Andover Street.
Based on the above analyses, the findings for the corridor can be summarized as:
This section reviews three major subjects related to the corridor’s operations and safety. The three subjects are (1) traffic operations at signalized intersections, (2) treatments of traffic medians, and (3) the potential applications of the “complete-streets” design concept.
Using the available turning movement counts and signal timing data, staff performed intersection capacity analyses at five signalized intersections in the study corridor.5 Three intersections in Section I were analyzed by using Synchro software,6 and two intersections in Section II were evaluated by using the analysis results from a traffic study completed in February 2012.7
The three intersections in Section I are:
The two intersections in Section II are:
Intersection capacity analyses were performed for the existing (2012) traffic conditions and the projected future (2017) traffic conditions. The future year analyses are based on the assumption that of all the intersections’ layouts and operations remain the same as in the base year, except at the intersection of Route 114 at Brooksby Village Drive because it is assumed that when the scheduled rebuilding of the car dealerships is implemented, the intersection will be reconfigured as a four-way intersection.
The corridor is located in a regional business district, and traffic usually experiences minor delays in the weekday AM peak hour. The analyses were therefore performed for the worst conditions of the average weekday PM peak hour and the Saturday midday peak hour.
Table 4 summarizes the PM peak-hour analyses for the 2012 and 2017 traffic conditions at the three intersections, and Table 5 summarizes the PM peak-hour analyses for the two intersections. Table 6 summarizes the Saturday peak-hour analyses for the 2012 and 2017 traffic conditions at the three intersections, and Table 7 summarizes the Saturday peak-hour analyses for the two intersections.
Overall, these five intersections in the corridor are operating at acceptable levels of service (LOS) of D or better in the weekday PM peak hour and in the Saturday midday peak hour. Most of the individual approaches at the intersections also operate at an acceptable LOS, except some turning movements at the intersection of Route 114 at Garden Street. At that intersection, the eastbound and southbound left turns operate at LOS F during the PM peak hour. The undesirable levels of service are due to the relatively large number of left-turns and the high through volumes on Route 114. During Saturday’s midday peak hour, the same situations are occurring at the intersection.
The signals at these intersections are currently coordinated on the Route 114 approaches. The analyses indicate that the timing settings for the intersections are generally appropriate.
Traffic medians are helpful in separating opposite traffic flows and enhancing traffic and pedestrian safety, especially on multilane roadways. Basically there are two types of medians for arterial roadways: raised medians and flush medians. Another type, usually used for highways in rural areas, is a depressed median.
In the study corridor, about a quarter of the length of the roadway (from Avalon Bay Drive to Garden Street) currently does not have clearly marked traffic medians, except in two short sections: one just west of Garden Street and one in the vicinity of the rail trail bridge. About three-quarters of the roadway (from Garden Street to Palmer Avenue) currently operates with a two-way left-turn lane (TWLTL) as a flush median.
There is a potential for installing traffic medians in the section of Route 114 between Avalon Bay Drive and Garden Street. This section is relatively wide, with the inside lane currently used as an exclusive left-turn lane for both directions. The numbers of left turns at the intersections of Route 114 at Avalon Bay Drive and at the Lowe’s driveway are moderate and do not require the entire lane for storage. A left-turn pocket of 150 to 200 feet would be sufficient.8
It appears that the two inside lanes in both directions could be combined and become a traffic median with left-turn bays.9 This treatment could be applied to the section between Avalon Bay Drive and the Lowe’s driveway. In the section between the Lowe’s driveway and Garden Street, the eastbound left-turn lane has to be preserved due to high left-turn demand, but the westbound left-turn lane could be converted to a median followed by a 200-feet left-turn bay.
The section between Garden Street and Palmer Avenue currently operates with a two-way left-turn lane (TWLTL) in order to provide access between the arterial and the adjacent developments. TWLTL is a special application of flush medians that allows turning movements along its entire length. TWLTs may be appropriate in areas with closely spaced driveways in highly developed or commercialized areas. They are applicable on roadways with no more than two though lanes in each direction and where operating speeds are in the range of 30 mph. TWLTLs are not appropriate on roadways with design speeds greater than 45 mph.10
In general, TWLTLs function well when traffic levels are moderate, the percentage of turning volumes is high, and the density of commercial driveways is moderate. TWLTLs are appropriate for arterials with low to moderate commercial driveway density and where the average daily traffic is in the range of 10,000 to 28,000 vehicles per day. In addition, the raised median treatment is usually associated with fewer accidents than the undivided cross-section and TWLTL, especially for average daily traffic demands that exceed 20,000 vehicles per day.11
Based on the above analyses, TWLTL is not an appropriate option for this section of roadway. The study corridor has a speed limit of 40 mph, which is higher than the 30 mph range. The corridor has average daily traffic of about 40,000 vehicles or more. And the driveway density in this section is relatively high. On the other hand, TWLTL appears to be the only option in this section under the current roadway and development conditions. Raised medians would not be able to provide access to the many businesses on both sides of the roadway. The future developments or redevelopments should be encouraged to combine and share driveways in order to reduce the driveway density.
The MassDOT Project Development and Design Guide provides guidance for accommodation of all individual roadway users, including pedestrians, cyclists, and transit users, in various functional classes of roadways. Arterials vary widely in character, depending upon the areas through which they pass. In most instances, arterials should be designed to accommodate pedestrians and bicyclists under either separate or shared accommodation.
In addition to developed areas (suburban high-density areas, suburban villages, town centers, and urban areas), sidewalks are also desirable in areas with lower development density, such as suburban low-density areas. The minimum desirable width for a sidewalk is five feet, excluding the width of the curb, although a three-foot clear width (without vegetation, sign posts or other obstructions) is allowable to bypass occasional obstructions. Usable shoulders are usually provided on arterials outside of densely developed areas. These shoulders need to be at least four feet wide to accommodate bicycle travel.
Although the corridor is located in a regional business zone, next to and behind the business zone the predominant use is residential. Avalon Apartments and Brooksby Village were built recently, and the vacant land west of Brooksby Village Drive could potentially be developed into a major residential area similar to Brooksby Village. A more complete-street design or retrofit would be beneficial to both the residents and the businesses in the corridor.
The study corridor has four-foot sidewalks on the north side of the roadway and no sidewalks on the south side. It would be desirable to widen the sidewalks on the north side to at least five feet for pedestrians’ comfort and safety. It would also be desirable to install sidewalks on the south side of the roadway.
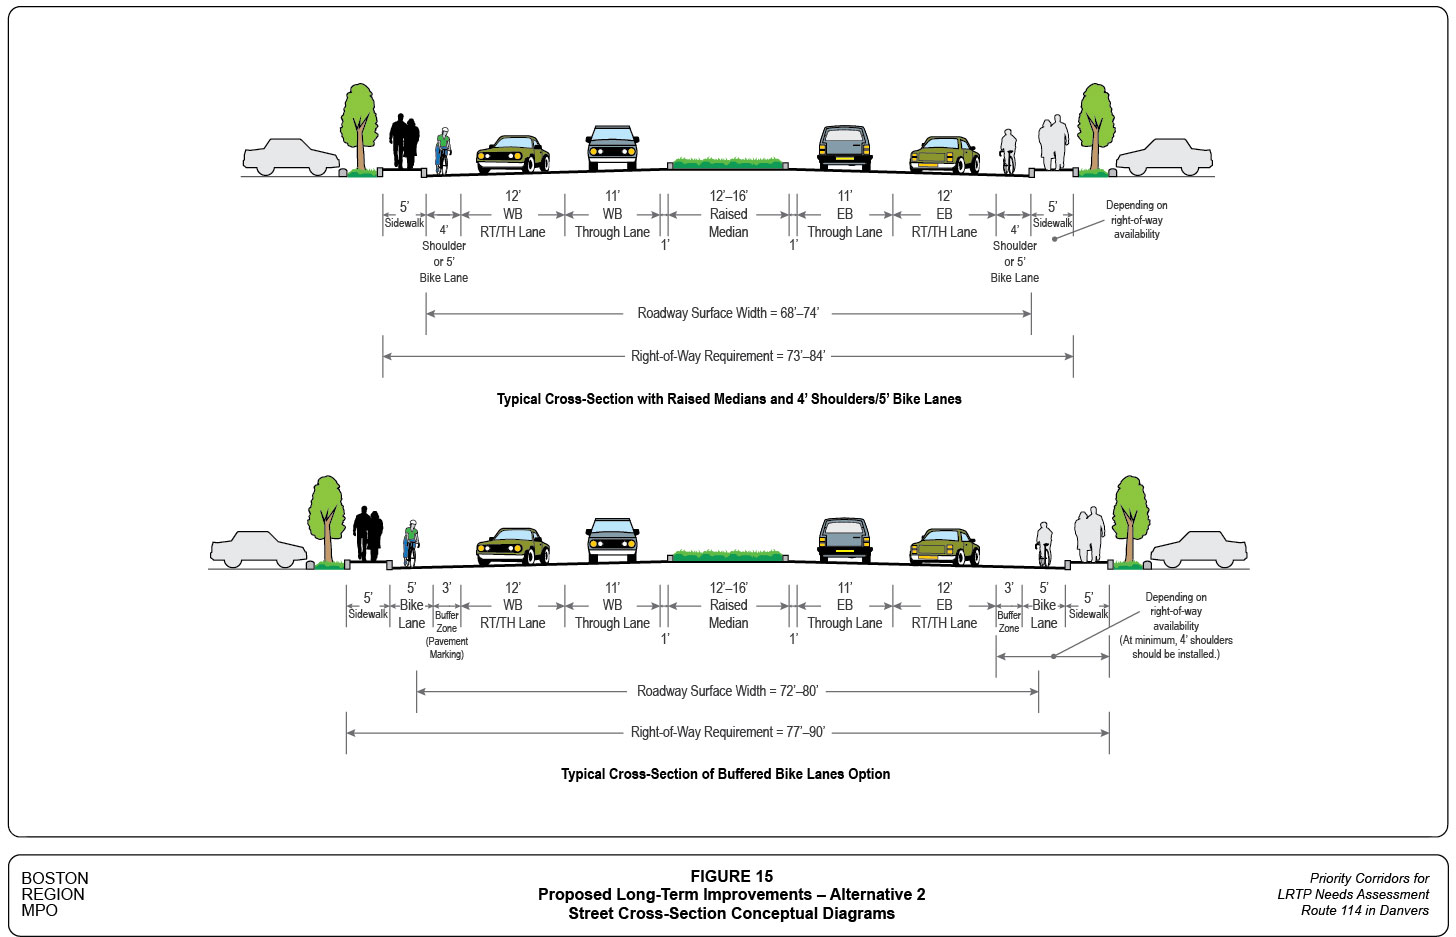
The corridor has a right-of-way of about 80 to 90 feet. Buffered bike lanes in each direction would provide a separated accommodation for bicycle travel, while also providing a buffer between pedestrians and traffic in the curb lane. A buffered bike lane, which is suitable for multilane streets with higher speeds, is comprised of a five-foot-wide bike lane with a recommended buffer between the bike lane and the outside travel lane of a minimum of three feet wide. Where there isn’t sufficient right-of-way for buffered bike lanes, a combination of five-foot bike lanes and four-foot paved shoulders could be provided along the corridor.
Based on the above analyses, staff developed short- and long-term improvements for the study corridor. They were developed progressively, from simple to more involved options. The short-term improvements are options that may be implementable in a short timeframe with relatively low costs, such as installing signs and pavement markings. These are generally associated with high benefit-cost ratios.
Figure 7 shows the locations and conceptual sketches of proposed key short-term improvements. The proposed short-term improvements in the corridor are:
The proposed median installations, pavement markings, and maintenance in the corridor could be considered and implemented by MassDOT. The proposed driveway treatments would require consultation and cooperation with the adjacent businesses.
In addition to the short-improvements, staff developed two long-term improvement alternatives for the study corridor. Alternative 1, which is smaller in scale, modifies the corridor within the existing roadway surface. Alternative 2, which is larger in scale, builds on Alternative 1.16 It includes a major expansion of the roadway surface that would require more capital-intensive redesign and reconstruction, which would in turn necessitate the identification and allocation of resources and entail a longer implementation schedule.
To show the locations and layouts of the proposed improvements in Alternative 1 for the entire study corridor, the conceptual plan is presented in three parts: the western section, from the I-95 Interchange to Danvers Rail Trail (see Figure 8); the middle section, from Danvers Rail Trail to the storefront retail (see Figure 9); and the eastern section, from the storefront retails to the Peabody City line (see Figure 10). The proposed improvements in Alternative 1 include the following roadway modifications and reconstruction:
In addition to the proposed driveway treatments in the short-term improvement alternative, Alternative 1 proposes a number of driveway modifications in the section between the Walmart driveway and Palmer Avenue (see Figures 9 and 10).
Figure 11 shows the proposed cross-section modifications in Alternative 1. The major changes are in the section near and under the rail trail bridge. In order to improve pedestrian safety in this section, Alternative 1 proposes to widen the sidewalk and to install a guardrail to protect pedestrians.
Figures 12, 13, and 14 show the locations and layouts of the proposed improvements of Alternative 2, in three parts (western, middle, and eastern) of the study corridor’s conceptual plan. Figure 15 shows the proposed roadway cross-sections for Alternative 2.
This alternative is an expansion of Alternative 1 and includes major roadway modifications in order to accommodate a wider sidewalk on the north side, a new sidewalk on the south side, and a separated facility for bicycle travel in both directions. The selection of the bicycle facility will be dependent on the availability of right-of-way space and whether or not a new sidewalk is constructed on the south side, which should be based on pedestrian demand along the corridor and community input. Options for the separated bike facility include a buffered bike lane, a five-foot bike lane without a buffer, and/or a four-foot paved shoulder.
The following summarizes the proposed major roadway improvements in Alternative 2:
Alternative 2 also includes all of the proposed driveway treatments in Alternative 1. It would have more significant impacts on the adjacent businesses. The proposed driveway treatments would require intensive consultation and cooperation with the adjacent businesses in the corridor.
The developments abutting Route 114 between Brooksby Village Drive and Palmer Avenue, and the vacant land west of Brooksby Village Drive, have the potential of being redeveloped or developed. It would be an opportunity for consolidating the many driveways in the area. Alternative 2 could provide a vision for the future complete-street design in this section of roadway.
This study performed a series of safety and operations analyses, identified safety and operational concerns in the corridor, and proposed a number of low-cost improvements for addressing some of the concerns that were identified. The study also provides a vision to further enhance safety and operations, and to accommodate all users in the corridor through two conceptual long-term improvement plans.
For the short term, staff recommend the implementation of all of the proposed short-term improvements. For the long term, staff recommend Alternative 2 of the two conceptual plans for consideration; at the very least, the cross-section that includes a five-foot sidewalk and a four-foot shoulder or a five-foot bike lane in the westbound direction and a four-foot shoulder in the eastbound direction should be considered.
In addition, the corridor would benefit from a comprehensive access management program. It would require a collaborative effort between the Town of Danvers, the City of Peabody, MassDOT, the area’s businesses, and nearby neighborhoods to ensure that the corridor operates efficiently and safely for all users.
CW/MSA/SPA/CB/cw
1 Unified Planning Work Program, Federal Fiscal Year 2012, endorsed by the Boston Region Metropolitan Planning Organization, August 18, 2011.
2 Boston Region MPO draft report, Route 203 (Gallivan Boulevard and Morton Street): Safety, Mobility, and Access Management, September 2012.
3 Greenman-Pedersen Inc., "Traffic Impact and Access Study: Proposed Car Dealership Expansion,” Danvers, Massachusetts, February 2012.
4 Greenman-Pedersen Inc., “Traffic Impact and Access Study: Proposed Car Dealership Expansion,” Danvers, Massachusetts, February 2012.
5 The purpose of this analysis was to provide a synopsis of the operations of the signalized intersections in the corridor using the available traffic counts. There were no recent counts available for the sixth intersection, Route 114 at Palmer Avenue. However, it has a relatively low crash rate and was considered to operate acceptably during peak hours based on site observations.
6 Synchro Version 8 was used for these analyses. This software is developed and distributed by Trafficware Ltd. It can perform capacity analysis and traffic simulation (when combined with SimTraffic) for an individual intersection or a series of intersections.
7 Greenman-Pedersen Inc., “Traffic Impact and Access Study: Proposed Car Dealership Expansion,” Danvers, Massachusetts, February 2012.
8 The intersection capacity analyses estimate that 95th-percentile queues for the left turns on Route 114 at the two intersections are about 50 feet or less under the existing and 2017 projected traffic conditions.
9 The left-turn lane should have a storage length of about 200 feet in order to cover unexpected traffic growth or unusual traffic surges.
10 MassDOT Project Development and Design Guide, Chapter 5: Cross-section and Roadside Elements, 2006 Edition.
11 National Cooperative Highway Research Report 395, “Capacity and Operational Effects of Midblock left-turn Lanes,” Transportation Research Board, 1997
12 The flush medians would help separate the opposing traffic and deter traffic from crossings midblock.
13 The stamped concrete median would alert drivers in opposite directions to keep their distance in this narrow section.
14 The left turns on Route 114 at this intersection operate under a protected/permitted phasing sequence. The sign would help clarify that a solid green ball indicates a permitted phase and drivers should yield to opposite traffic. This improvement could also be applied to other intersections with the same operation for the left turns as on Route 114.
15 Currently there is a small-size substandard “Do Not Enter” sign facing the driveway. It should be replaced by a standard MUTCD (R5-1) sign.
16 The major improvements proposed in Alternative 1, such as the installation of a ramp to the Danvers Rail Trail for pedestrians and bicyclists and the expansion of the sidewalk between Garden Street and the Walmart driveway would also be included in Alternative 2.
17 The proposed ramp would significantly improve access to the rail trail for pedestrians and cyclists from the adjacent neighborhoods and the region.
TABLE 1
Summary of Peak-Hour Approach Volumes at Route 114 Intersections
| Intersection/Approach |
|
2012 Peak Hour |
|
2017 Peak Hour |
||
|---|---|---|---|---|---|---|
|
|
PM1 |
Saturday2 |
|
PM |
Saturday |
|
Route 114 at Avalon Bay Drive/Ira Motors driveway1 |
|
|
|
|
|
|
Route 114 – EB |
|
1,770 |
2,057 |
|
1,880 |
2,191 |
Route 114 – WB |
|
2,232 |
1,924 |
|
2,386 |
2,050 |
Avalon Bay Drive – NB |
|
174 |
139 |
|
194 |
139 |
Ira Motors Driveway – SB |
|
84 |
78 |
|
84 |
72 |
Total intersection volume |
|
4,260 |
4,198 |
|
4,544 |
4,452 |
Route 114 at Lowe’s driveway3 |
|
|
|
|
|
|
Route 114 – EB |
|
1,707 |
2,000 |
|
1,818 |
2,131 |
Route 114 – WB |
|
2,103 |
1,845 |
|
2,251 |
1,969 |
156 Andover St. Plaza – NB |
|
60 |
47 |
|
60 |
47 |
Lowe’s Driveway – SB |
|
158 |
124 |
|
158 |
124 |
Total intersection volume |
|
4,028 |
4,016 |
|
4,287 |
4,271 |
Route 114 at Garden Street4 |
|
|
|
|
|
|
Route 114 – EB |
|
1,655 |
1,980 |
|
1,762 |
2,112 |
Route 114 – WB |
|
1,900 |
1,869 |
|
2,039 |
1,999 |
136 Andover St. Plaza – NB |
|
52 |
71 |
|
52 |
71 |
Garden Street – SB |
|
435 |
474 |
|
482 |
505 |
Total intersection volume |
|
4,042 |
4,394 |
|
4,335 |
4,687 |
Route 114 at Walmart driveway4 |
|
|
|
|
|
|
Route 114 – EB |
|
1,538 |
2,053 |
|
1,645 |
2,186 |
Route 114 – WB |
|
1,709 |
1,784 |
|
1,824 |
1,843 |
Walmart Driveway – NB |
|
383 |
536 |
|
384 |
537 |
Total intersection volume |
|
3,630 |
4,374 |
|
3,853 |
4,566 |
Route 114 at Brooksby Village driveway4
|
|
|
|
|
|
|
Route 114 – EB |
|
1,460 |
1,944 |
|
1,582 |
2,090 |
Route 114 – WB |
|
1,721 |
1,811 |
|
1,798 |
1,873 |
Brooksby Village Driveway – NB |
|
81 |
164 |
|
86 |
173 |
Proposed Car Dealership* – SB |
|
- |
|
86 |
96 |
|
Total intersection volume |
|
3,262 |
3,919 |
|
3,552 |
4,232 |
1PM peak period from 4:00 PM to 6:00 PM.
2Saturday peak period from 11:00 AM to 2:00 PM.
3GPI, “Traffic Impact and Access Study: Proposed Indoor Sports Facility,” Danvers, Mass., December 8, 2009.
4GPI, “Traffic Impact and Access Study: Proposed Car Dealership Expansion,” Danvers, Mass., February 2012.
*Proposed Ira car dealership driveway, constructed with project for 2017.
Note: 2017 traffic volumes for the Avalon Bay Drive/Ira Motors driveway and Lowe’s driveway intersections were developed by applying a growth factor to 2012 traffic volumes.
TABLE 2
Pedestrian Crossing Counts at Route 114 Intersections
| Intersection/Approach |
|
Peak Period |
|
Peak Hour |
||
|---|---|---|---|---|---|---|
|
|
PM1 |
Saturday2 |
|
PM |
Saturday |
|
Route 114 at Garden Street |
|
|
|
|
|
|
Route 114 – EB |
|
0 |
0 |
|
0 |
0 |
Route 114 – WB |
|
3 |
2 |
|
0 |
0 |
136 Andover St. Plaza – NB |
|
0 |
9 |
|
0 |
1 |
Garden Street – SB |
|
1 |
2 |
|
0 |
1 |
Total intersection volume |
|
4 |
13 |
|
0 |
2 |
Route 114 at Walmart Driveway |
|
|
|
|
|
|
Route 114 – EB |
|
0 |
1 |
|
0 |
1 |
Route 114 – WB |
|
0 |
0 |
|
0 |
0 |
Walmart Driveway – NB |
|
0 |
0 |
|
0 |
0 |
Total intersection volume |
|
0 |
1 |
|
0 |
1 |
Route 114 at Brooksby Village Driveway
|
|
|
|
|
|
|
Route 114 – EB |
|
0 |
2 |
|
0 |
2 |
Route 114 – WB |
|
0 |
0 |
|
0 |
0 |
Brooksby Village Driveway – NB |
|
0 |
0 |
|
0 |
0 |
Total intersection volume |
|
0 |
2 |
|
0 |
2 |
Route 114 at Judith Road/Herb Chambers Driveway |
|
|
|
|
|
|
Route 114 – EB |
|
0 |
0 |
|
0 |
0 |
Route 114 – WB |
|
0 |
0 |
|
0 |
0 |
Herb Chambers Driveway – NB |
|
0 |
0 |
|
0 |
0 |
Judith Drive – WB |
|
0 |
2 |
|
0 |
0 |
Total intersection volume |
|
0 |
2 |
|
0 |
0 |
1PM peak period from 4:00 PM to 6:00 PM.
2Saturday peak period from 11:00 AM to 2:00 PM.
Note: Pedestrian counts taken from report: “Traffic Impact and Access Study: Proposed Car Dealership Expansion,” Danvers, Mass., GPI, February 2012.
TABLE 3
Summary of Crash Statistics by Year for the Study Corridor
MassDOT Crash Data 2005–09
2005 |
2006 |
2007 |
2008 |
2009 |
5-Year Total |
Annual Avg. |
||
Total number of crashes |
58 |
51 |
43 |
63 |
46 |
261 |
52.2 |
|
Severity |
Property damage only |
28 |
28 |
22 |
36 |
15 |
129 |
25.8 |
Non-fatal injury |
25 |
19 |
16 |
23 |
29 |
112 |
22.4 |
|
Fatality |
0 |
0 |
0 |
0 |
0 |
0 |
0.0 |
|
Not reported/unknown |
5 |
4 |
5 |
4 |
2 |
20 |
4.0 |
|
Collision type |
Single-vehicle |
4 |
4 |
4 |
4 |
5 |
21 |
4.2 |
Rear-end |
22 |
17 |
18 |
20 |
22 |
99 |
19.8 |
|
Angle |
20 |
23 |
17 |
26 |
15 |
101 |
20.2 |
|
Sideswipe, same direction |
4 |
4 |
3 |
3 |
3 |
17 |
3.4 |
|
Sideswipe, opposite direction |
3 |
0 |
0 |
1 |
0 |
4 |
0.8 |
|
Head-on |
2 |
1 |
1 |
3 |
1 |
8 |
1.6 |
|
Rear-to-rear |
1 |
0 |
0 |
0 |
0 |
1 |
0.2 |
|
Not reported/unknown |
2 |
2 |
0 |
5 |
0 |
9 |
1.8 |
|
Involved pedestrian(s) |
0 |
0 |
0 |
1 |
0 |
1 |
0.2 |
|
Involved cyclist(s) |
1 |
0 |
0 |
1 |
0 |
2 |
0.4 |
|
Occurred during peak traffic periods* |
14 |
8 |
6 |
8 |
7 |
43 |
8.6 |
|
Wet or icy pavement conditions |
24 |
18 |
13 |
18 |
16 |
89 |
17.8 |
|
Dark conditions (lit or unlit) |
11 |
13 |
10 |
15 |
11 |
60 |
12.0 |
|
TABLE 4
Intersection Capacity Analyses at Three Intersections
PM Peak Hour
| Intersection/Approach |
Lane |
|
2012 Existing |
|
2017 Projection |
||||
|---|---|---|---|---|---|---|---|---|---|
|
|
LOS |
Delay1 |
Q2 |
|
LOS |
Delay1 |
Q2 |
||
Route 114 at Avalon Bay/Ira Motors |
|
|
|
|
|
|
|
|
|
Route 114 – EB |
L |
|
d |
45.8 |
50 |
|
d |
45.8 |
50 |
|
T |
|
c |
23.8 |
#680 |
|
c |
31.9 |
#760 |
|
R |
|
b |
10.0 |
54 |
|
b |
10.4 |
55 |
Route 114 – WB |
L |
|
b |
15.1 |
13 |
|
b |
16.9 |
8 |
|
TR |
|
a |
8.5 |
340 |
|
a |
9.2 |
90 |
Avalon Bay – NB |
LTR |
|
d |
54.3 |
#200 |
|
e |
60.4 |
#235 |
Ira Motors driveway – SB |
L |
|
d |
37.2 |
57 |
|
d |
36.5 |
57 |
|
TR |
|
d |
35.1 |
30 |
|
c |
34.5 |
30 |
Overall |
|
|
b |
17.1 |
- |
|
c |
20.8 |
- |
Route 114 at Lowe’s driveway |
|
|
|
|
|
|
|
|
|
Route 114 – EB |
L |
|
c |
20.1 |
13 |
|
c |
23.2 |
9 |
|
T |
|
a |
1.4 |
35 |
|
a |
1.9 |
37 |
Route 114 – WB |
L |
|
a |
8.7 |
4 |
|
b |
10.2 |
4 |
|
TR |
|
a |
9.1 |
236 |
|
a |
9.5 |
239 |
156 Andover St. plaza – NB |
LT |
|
d |
44.5 |
48 |
|
d |
44.5 |
48 |
|
R |
|
d |
39.9 |
15 |
|
d |
39.9 |
15 |
Lowe’s driveway – SB |
LT |
|
d |
42.2 |
39 |
|
d |
42.2 |
39 |
|
R |
|
d |
42.4 |
122 |
|
d |
42.7 |
122 |
Overall |
|
|
a |
8.3 |
- |
|
a |
8.6 |
- |
Route 114 at Garden Street |
|
|
|
|
|
|
|
|
|
Route 114 – EB |
L |
|
f |
106.7 |
#309 |
|
f |
122.7 |
#332 |
|
TR |
|
a |
1.9 |
16 |
|
a |
2.2 |
18 |
Route 114 – WB |
L |
|
a |
8.4 |
8 |
|
a |
8.9 |
8 |
|
TR |
|
d |
44.6 |
#847 |
|
e |
70.9 |
#952 |
136 Andover St. plaza – NB |
LTR |
|
d |
37.1 |
58 |
|
d |
37.9 |
59 |
Garden Street – SB |
LT |
|
e |
77.6 |
#241 |
|
f |
110.8 |
#280 |
|
R |
|
c |
31.7 |
228 |
|
c |
33.2 |
255 |
Overall |
|
|
c |
34.5 |
- |
|
d |
49.8 |
- |
1Delay in seconds per vehicle
295th-percentile queues in feet
Note: # means that the 95th-percentile volume exceeds capacity so the queue may be longer.
TABLE 5
Intersection Capacity Analyses at Two Intersections
PM Peak Hour
| Intersection/Approach |
Lane |
|
2012 Existing |
|
2017 Projection |
||||
|---|---|---|---|---|---|---|---|---|---|
|
|
LOS |
Delay1 |
Q2 |
|
LOS |
Delay1 |
Q2 |
||
Route 114 at Walmart driveway* |
|
|
|
|
|
|
|
|
|
Route 114 – EB |
TR |
|
b |
11.7 |
147 |
|
b |
12.3 |
195 |
Route 114 – WB |
L |
|
e |
56.3 |
#118 |
|
e |
61.1 |
100 |
|
T |
|
b |
10.5 |
6 |
|
a |
6.8 |
20 |
Walmart driveway – NB |
LTR |
|
d |
40.6 |
#212 |
|
d |
45.0 |
#213 |
Overall |
|
|
b |
15.6 |
- |
|
B |
14.5 |
- |
Route 114 at Brooksby Village Drive/Ira Motors* |
|
|
|
|
|
|
|
|
|
Route 114 – EB |
L |
|
- |
- |
- |
|
d |
37.2 |
40 |
|
TR |
|
b |
13.5 |
308 |
|
b |
14.9 |
310 |
Route 114 – WB |
L |
|
D |
51.2 |
105 |
|
d |
51.7 |
109 |
|
T |
|
a |
3.8 |
206 |
|
b |
10.6 |
473 |
Brooksby Village Drive – NB |
LR |
|
c |
22.4 |
57 |
|
c |
24.4 |
64 |
Ira Motors – SB |
LT |
|
- |
- |
- |
|
d |
45.4 |
61 |
|
R |
|
- |
- |
- |
|
b |
19.5 |
39 |
Overall |
|
|
b |
10.1 |
- |
|
b |
10.5 |
- |
1Delay in seconds per vehicle
295th-percentile queues in feet
* LOS, Delay, and 95th percentile queue information gathered from “Traffic Impact and Access Study, Proposed Car Dealership Expansion, Danvers, Mass.,” GPI, February, 2012.
Note: # means that the 95th-percentile volume exceeds capacity so the queue may be longer.
TABLE 6
Intersection Capacity Analyses at Three Intersections
Saturday Peak Hour
| Intersection/Approach |
Lane |
|
2012 Existing |
|
2017 Projection |
||||
|---|---|---|---|---|---|---|---|---|---|
|
|
LOS |
Delay1 |
Q2 |
|
LOS |
Delay1 |
Q2 |
||
Route 114 at Avalon Bay/Ira Motors |
|
|
|
|
|
|
|
|
|
Route 114 – EB |
L |
|
d |
51.6 |
72 |
|
d |
51.7 |
74 |
|
T |
|
b |
15.7 |
696 |
|
b |
18.7 |
#902 |
|
R |
|
a |
6.2 |
33 |
|
a |
6.3 |
34 |
Route 114 – WB |
L |
|
c |
21.1 |
22 |
|
c |
29.3 |
29 |
|
TR |
|
a |
8.5 |
119 |
|
a |
9.8 |
342 |
Avalon Bay – NB |
LTR |
|
f |
80.5 |
109 |
|
f |
80.5 |
#194 |
Ira Motors driveway – SB |
L |
|
d |
45.2 |
23 |
|
d |
45.2 |
51 |
|
TR |
|
d |
43.3 |
1 |
|
d |
43.3 |
33 |
Overall |
|
|
b |
15.9 |
- |
|
b |
17.8 |
- |
Route 114 at Lowe’s driveway |
|
|
|
|
|
|
|
|
|
Route 114 – EB |
L |
|
b |
15.9 |
25 |
|
b |
13.8 |
46 |
|
T |
|
a |
2.8 |
35 |
|
a |
4.6 |
198 |
Route 114 – WB |
L |
|
a |
9.8 |
7 |
|
b |
12.1 |
6 |
|
TR |
|
a |
9.9 |
285 |
|
b |
10.4 |
284 |
156 Andover St. plaza – NB |
LT |
|
d |
51.8 |
49 |
|
d |
51.8 |
49 |
|
R |
|
d |
47.5 |
18 |
|
d |
47.5 |
18 |
Lowe’s driveway – SB |
LT |
|
d |
52.2 |
55 |
|
d |
52.2 |
55 |
|
R |
|
d |
46.1 |
99 |
|
D |
46.1 |
99 |
Overall |
|
|
a |
8.9 |
- |
|
a |
9.8 |
- |
Route 114 at Garden Street |
|
|
|
|
|
|
|
|
|
Route 114 – EB |
L |
|
f |
116.4 |
#304 |
|
f |
144.5 |
#313 |
|
TR |
|
b |
19.0 |
791 |
|
b |
15.7 |
844 |
Route 114 – WB |
L |
|
b |
15.6 |
12 |
|
b |
18.4 |
12 |
|
TR |
|
c |
33.0 |
#860 |
|
d |
48.0 |
#968 |
136 Andover St. plaza – NB |
LTR |
|
d |
40.5 |
77 |
|
d |
41.5 |
79 |
Garden Street – SB |
LT |
|
F |
153.5 |
#390 |
|
f |
185.4 |
#423 |
|
R |
|
c |
33.5 |
213 |
|
c |
34.0 |
229 |
Overall |
|
|
d |
38.9 |
- |
|
d |
47.3 |
- |
1Delay in seconds per vehicle
295th--percentile queues in feet
Note: # means that the 95th-percentile volume exceeds capacity so the queue may be longer.
TABLE 7
Intersection Capacity Analyses at Two Intersections
Saturday Peak Hour
| Intersection/Approach |
Lane |
|
2012 Existing |
|
2017 Projection |
||||
|---|---|---|---|---|---|---|---|---|---|
|
|
LOS |
Delay1 |
Q2 |
|
LOS |
Delay1 |
Q2 |
||
Route 114 at Walmart driveway* |
|
|
|
|
|
|
|
|
|
Route 114 – EB |
TR |
|
b |
18.2 |
469 |
|
c |
30.7 |
#971 |
Route 114 – WB |
L |
|
f |
281.6 |
#376 |
|
f |
277.5 |
#354 |
|
T |
|
a |
4.2 |
156 |
|
a |
4.2 |
164 |
Walmart driveway – NB |
LTR |
|
f |
151.4 |
#327 |
|
f |
154.3 |
#328 |
Overall |
|
|
d |
43.5 |
- |
|
b |
48.0 |
- |
Route 114 at Brooksby Village Drive/Ira Motors* |
|
|
|
|
|
|
|
|
|
Route 114 – EB |
L |
|
- |
- |
- |
|
e |
59.1 |
59 |
|
TR |
|
a |
8.6 |
235 |
|
a |
9.0 |
198 |
Route 114 – WB |
L |
|
e |
75.8 |
#185 |
|
e |
78.5 |
199 |
|
T |
|
a |
4.6 |
208 |
|
b |
11.5 |
459 |
Brooksby Village Drive – NB |
LR |
|
d |
38.5 |
159 |
|
d |
40.3 |
171 |
Ira Motors – SB |
LT |
|
- |
- |
- |
|
d |
49.3 |
56 |
|
R |
|
- |
- |
- |
|
c |
26.3 |
63 |
Overall |
|
|
b |
10.5 |
- |
|
b |
15.2 |
- |
1Delay in seconds per vehicle
295th-percentile queues in feet
* LOS, Delay, and 95th percentile queue information gathered from “Traffic Impact and Access Study, Proposed Car Dealership Expansion, Danvers, Mass.,” GPI, February, 2012.
Note: # means that the 95th-percentile volume exceeds capacity so the queue may be longer.
Figure 1
Study Corridor and Major Transportation Facilities in the Region
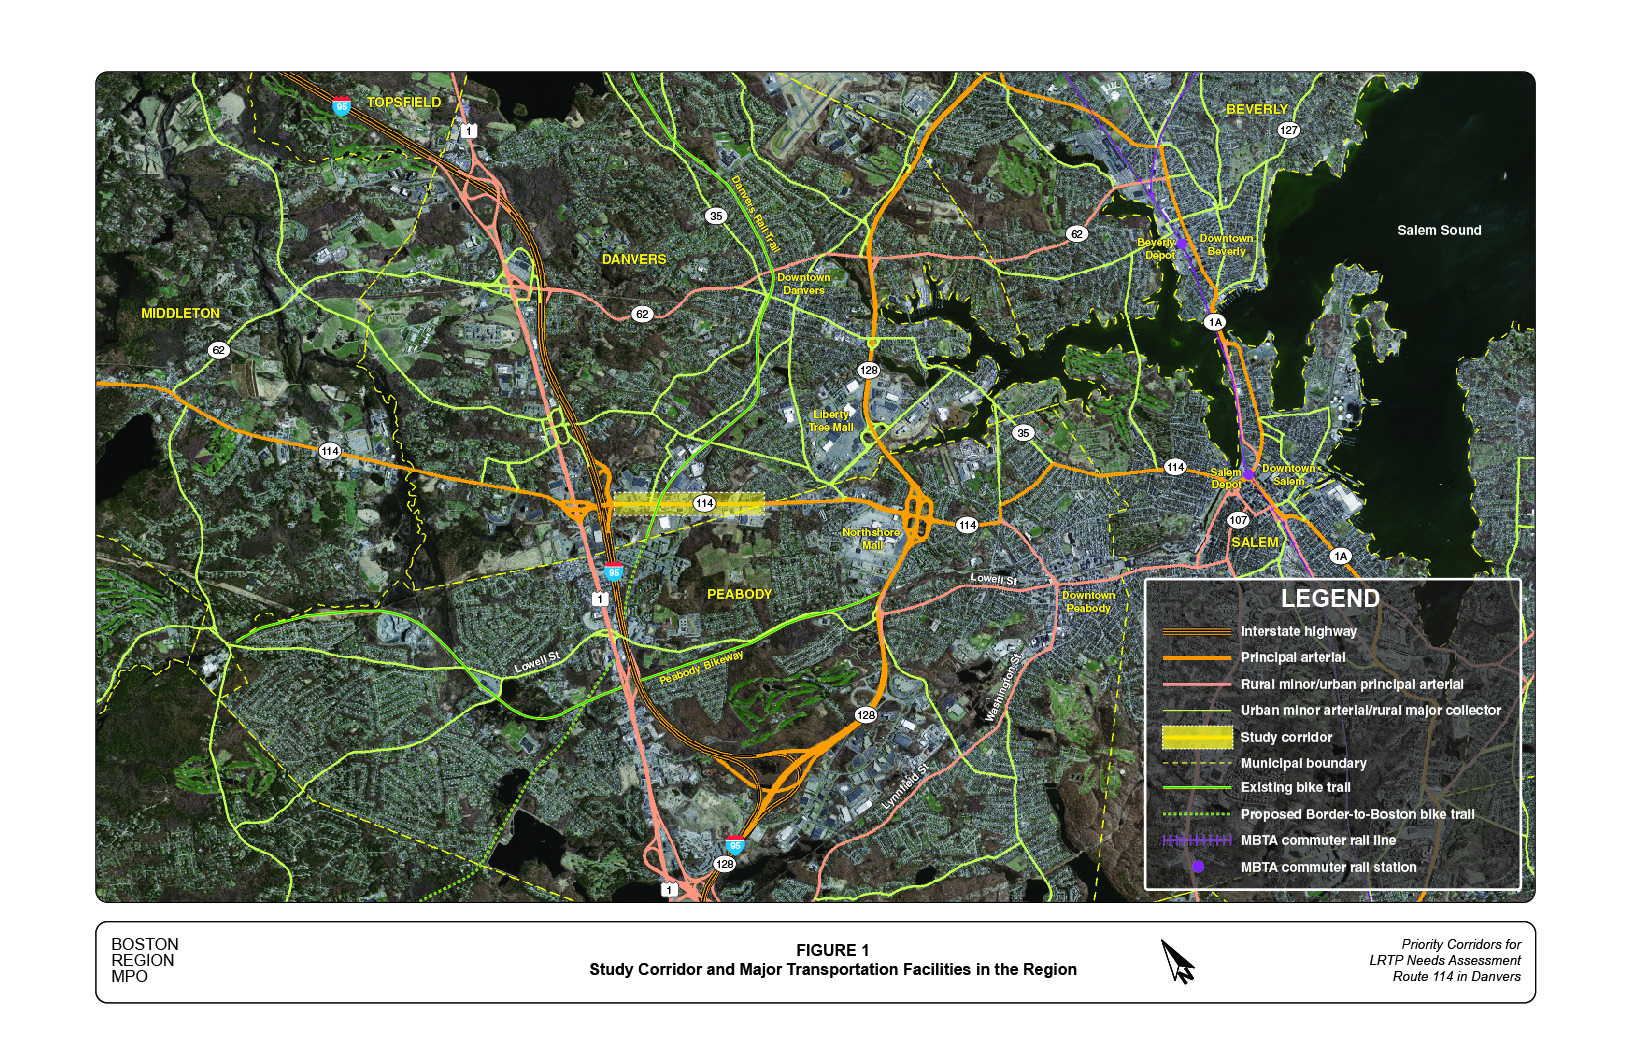
Figure 2
Roadway Travel Speeds in the Region: AM Peak Period
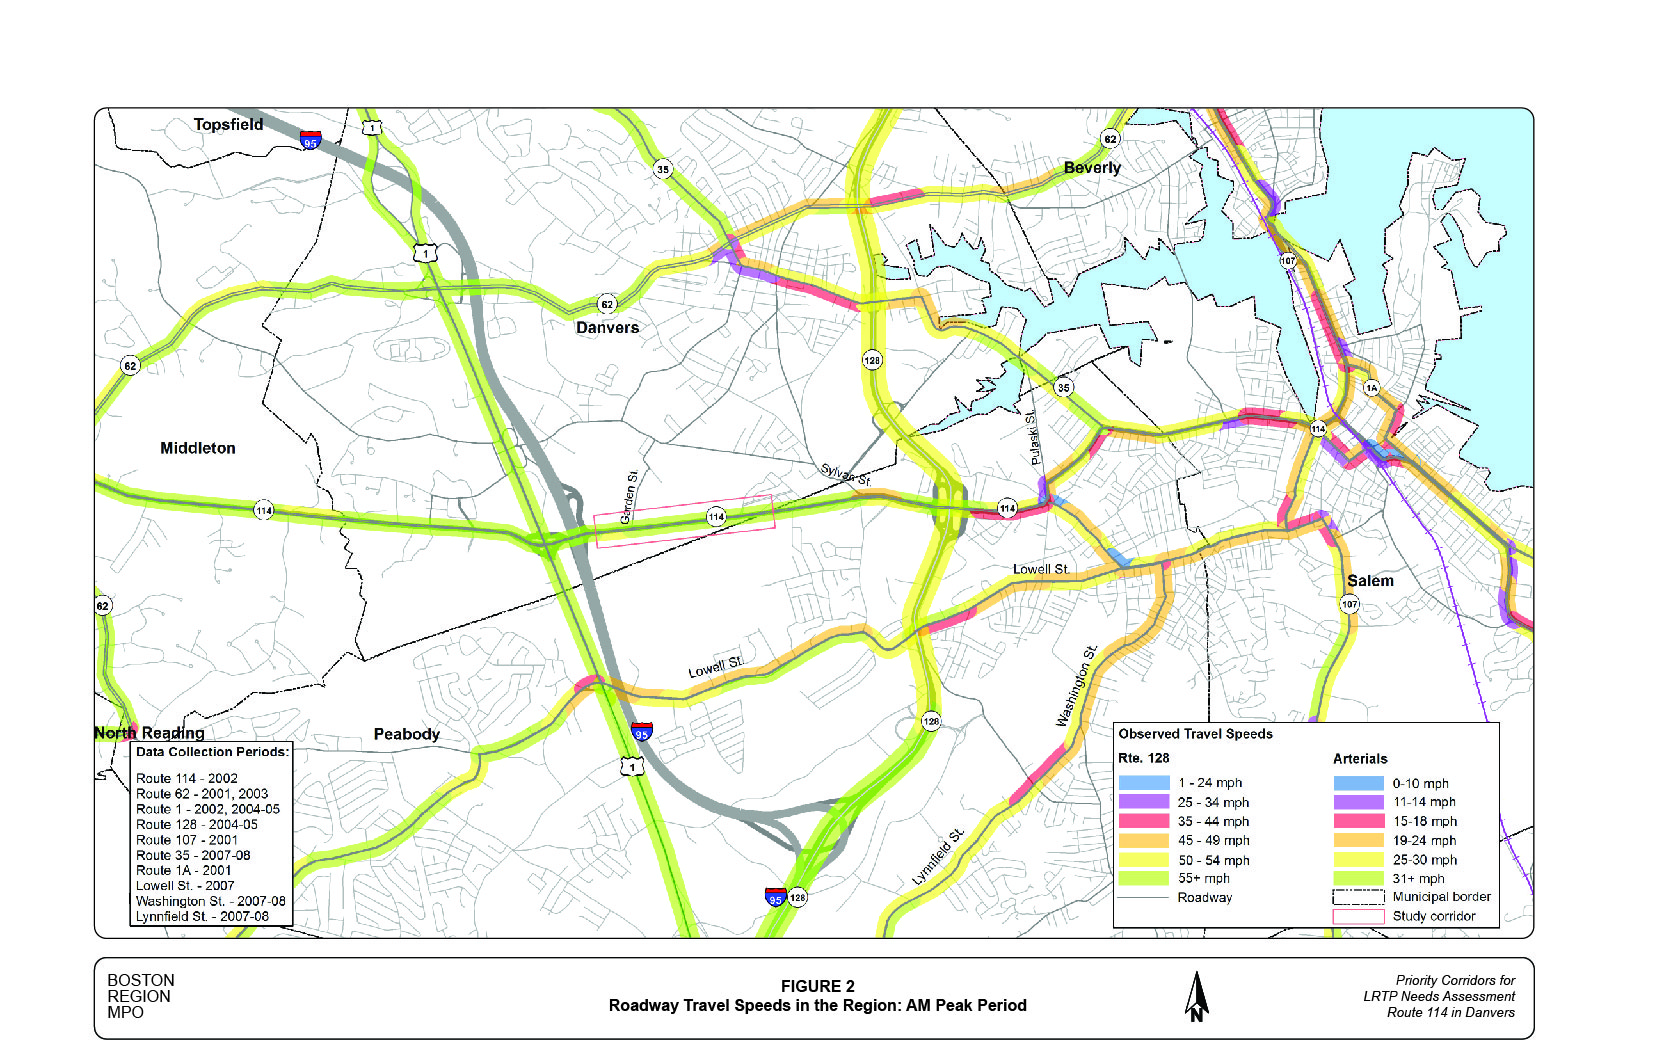
Figure 3
Roadway Travel Speeds in the Region: PM Peak Period
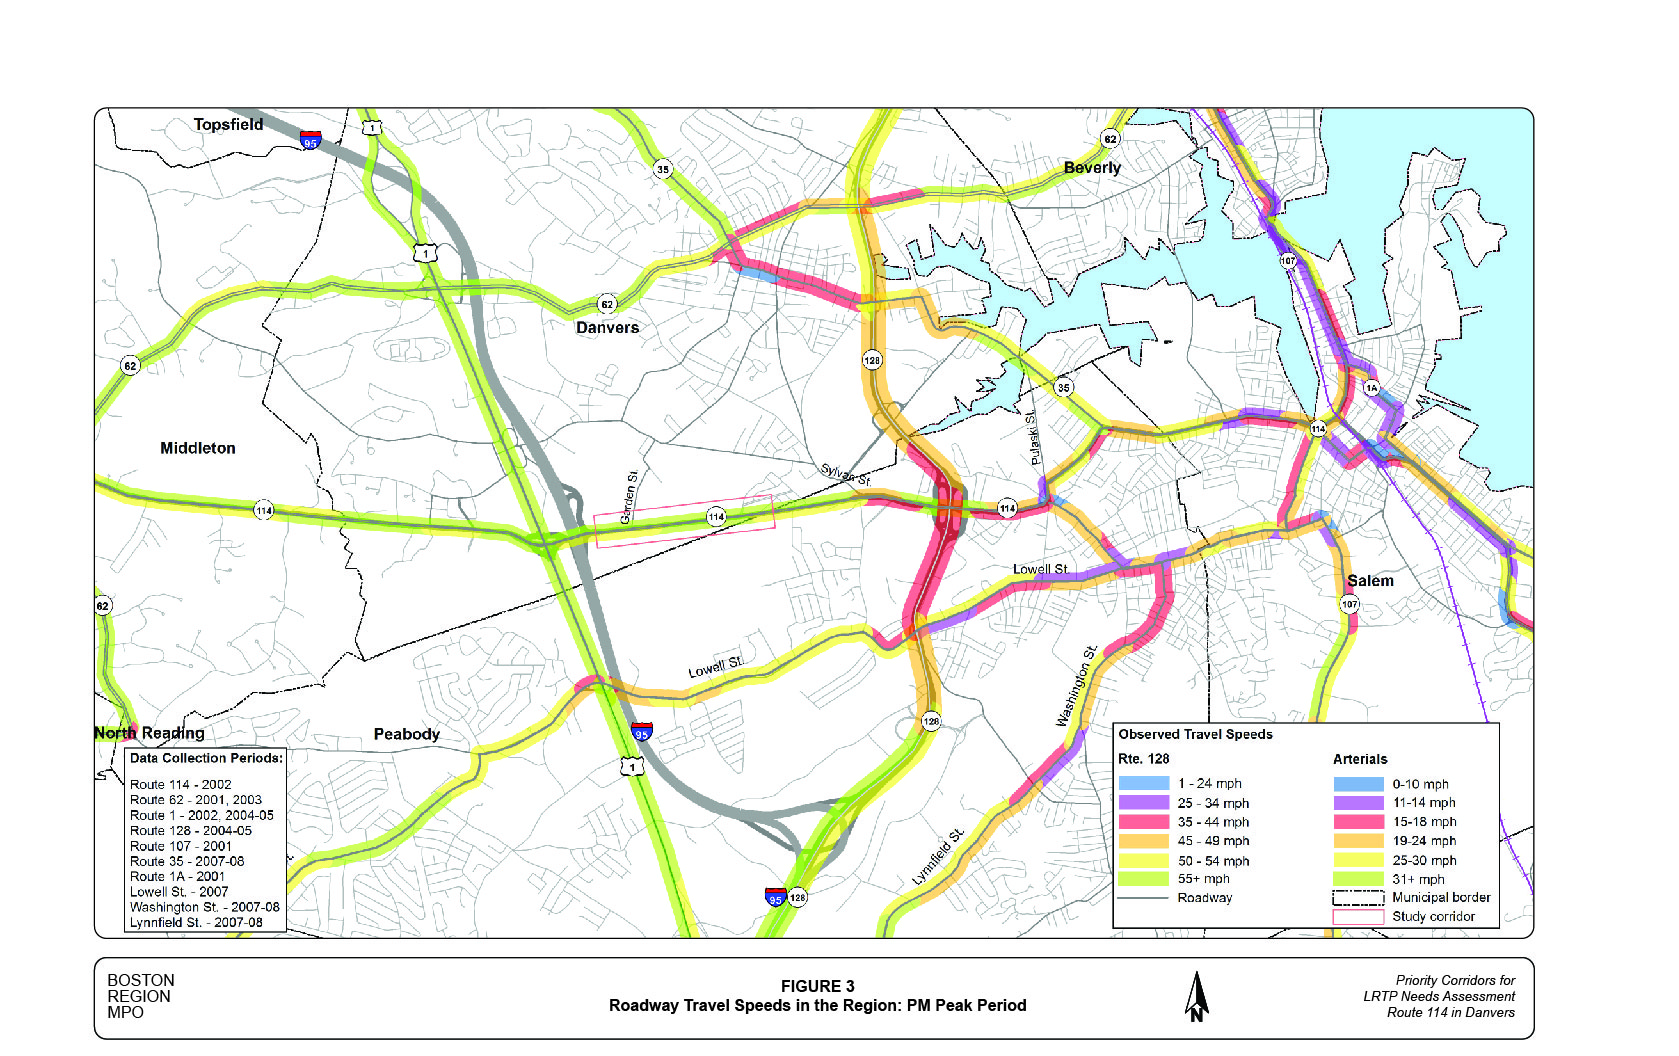
Figure 4
Existing Roadway Conditions and Adjacent Developments
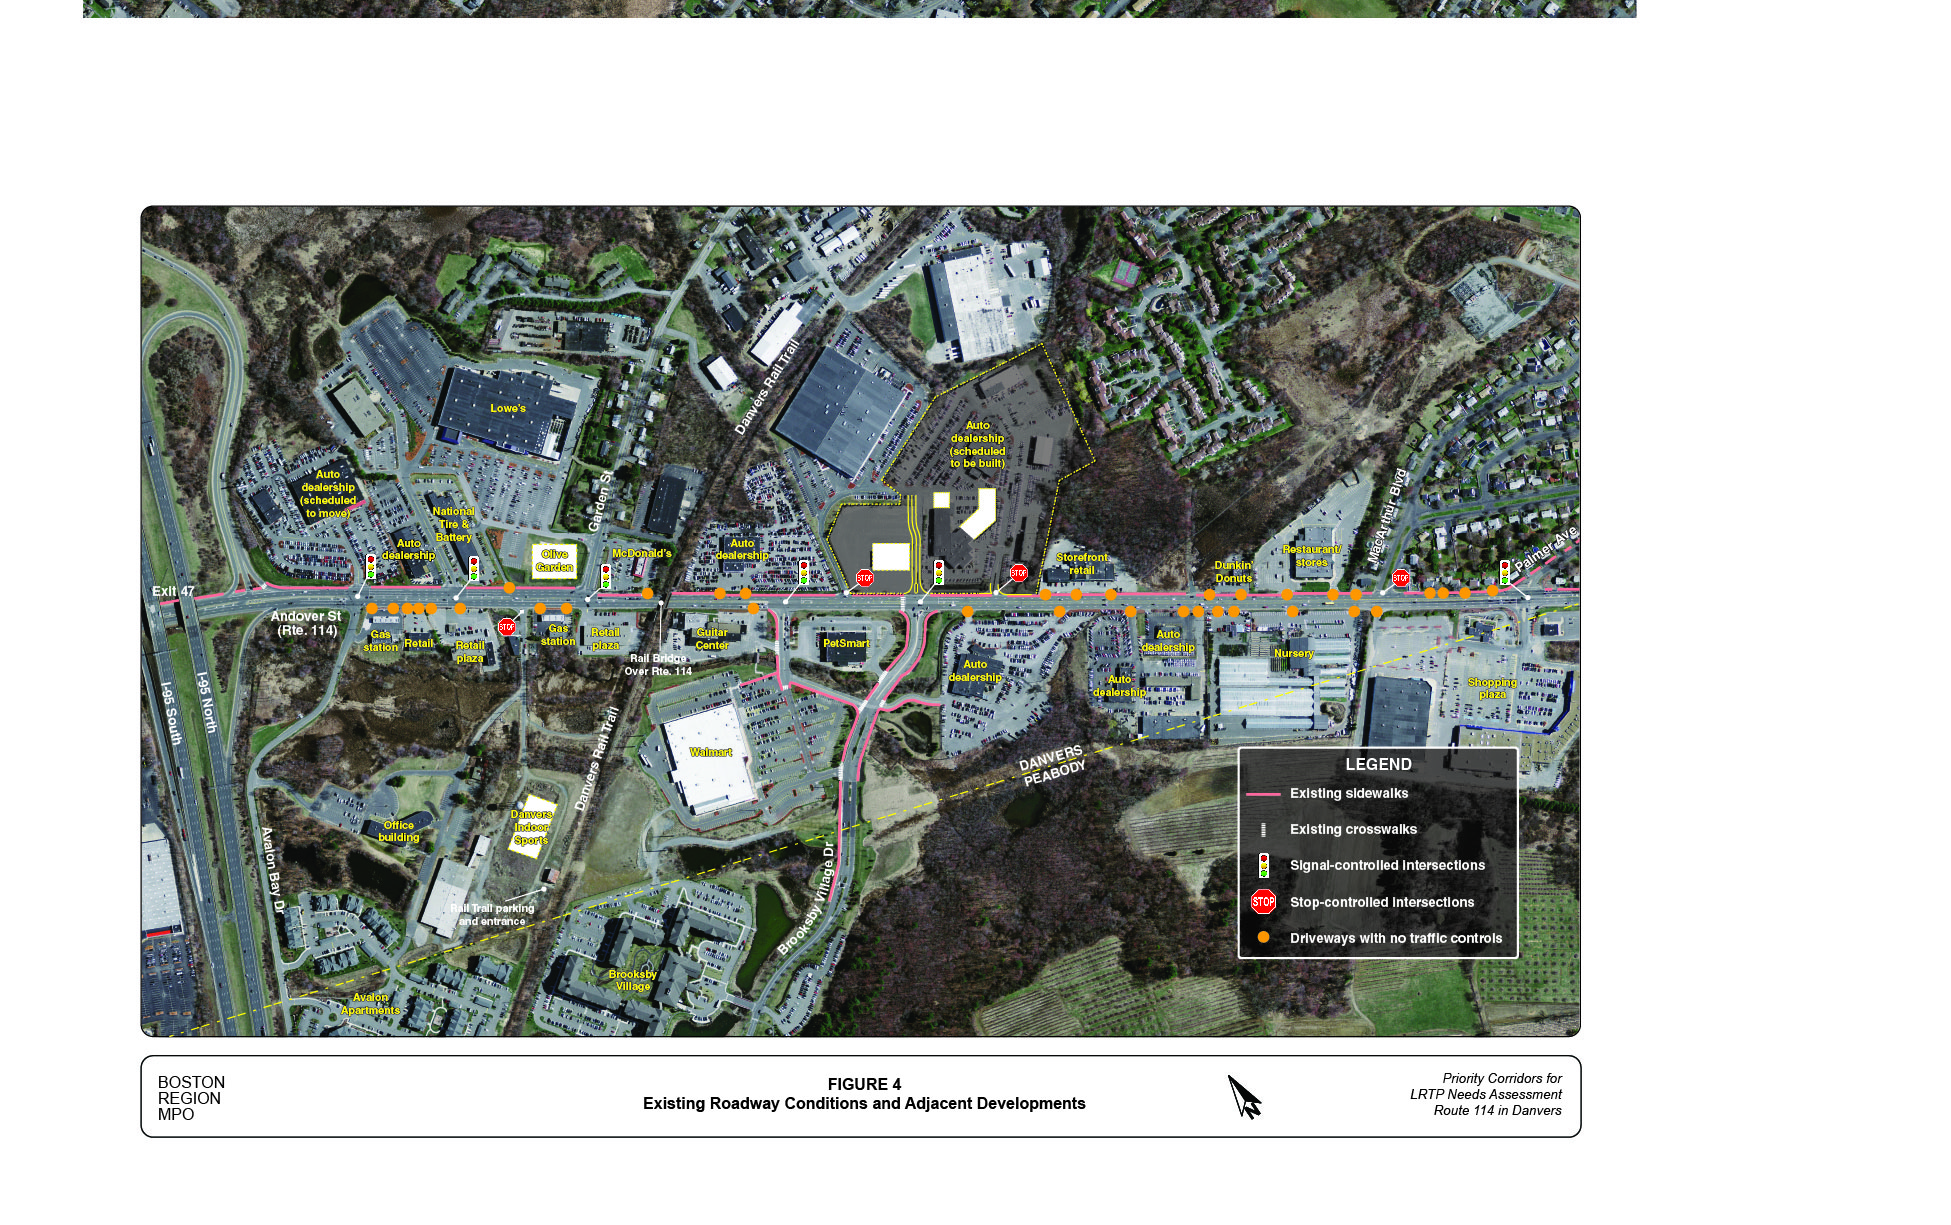
Figure 5
Existing Street Cross-Sections
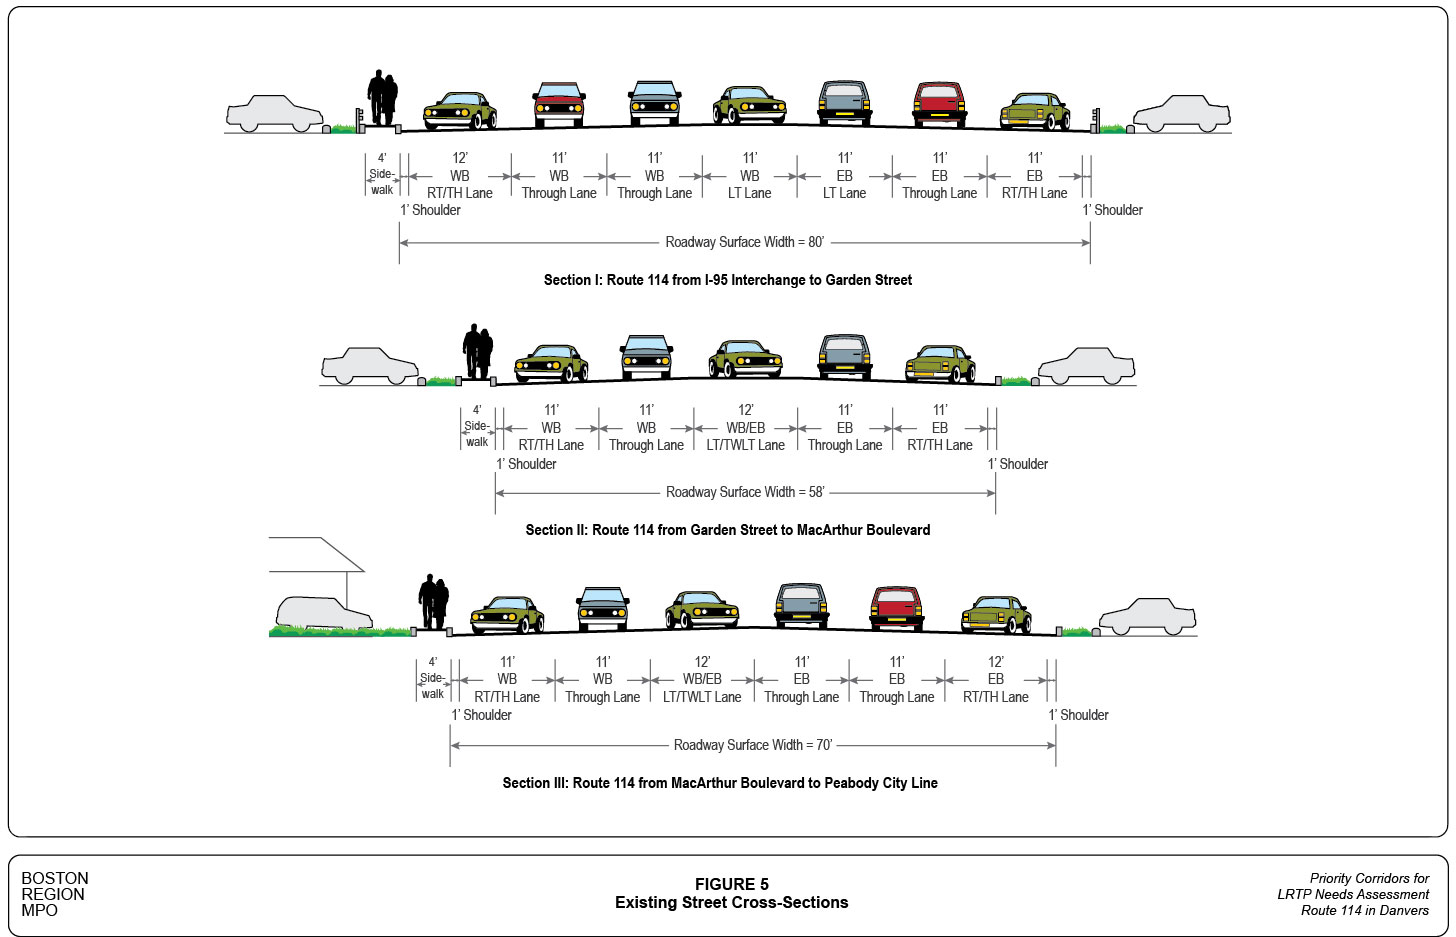
Figure 6
Crash Locations 2005-09
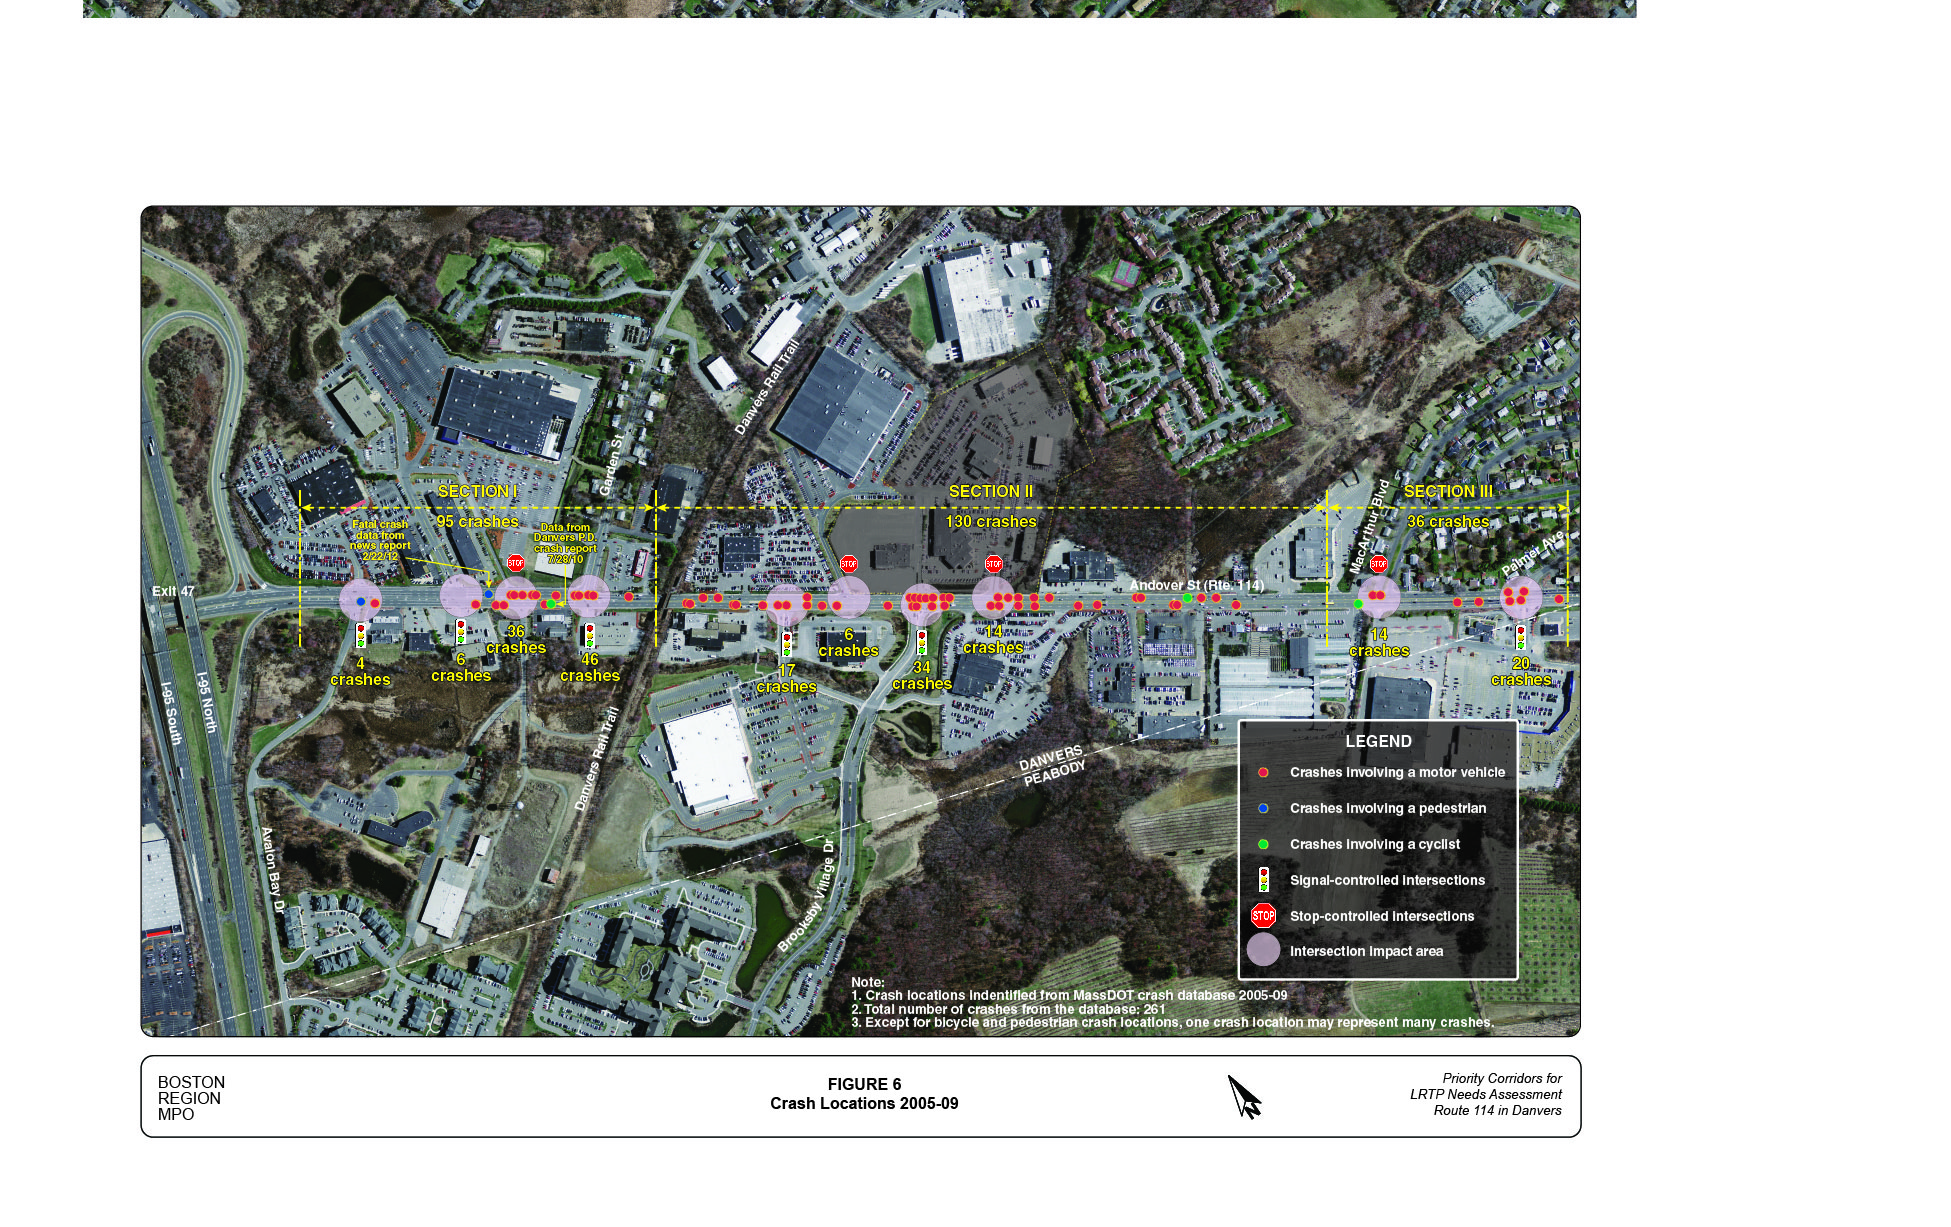
Figure 7
Proposed Key Short-Term Improvements Locations and Conceptual Sketches
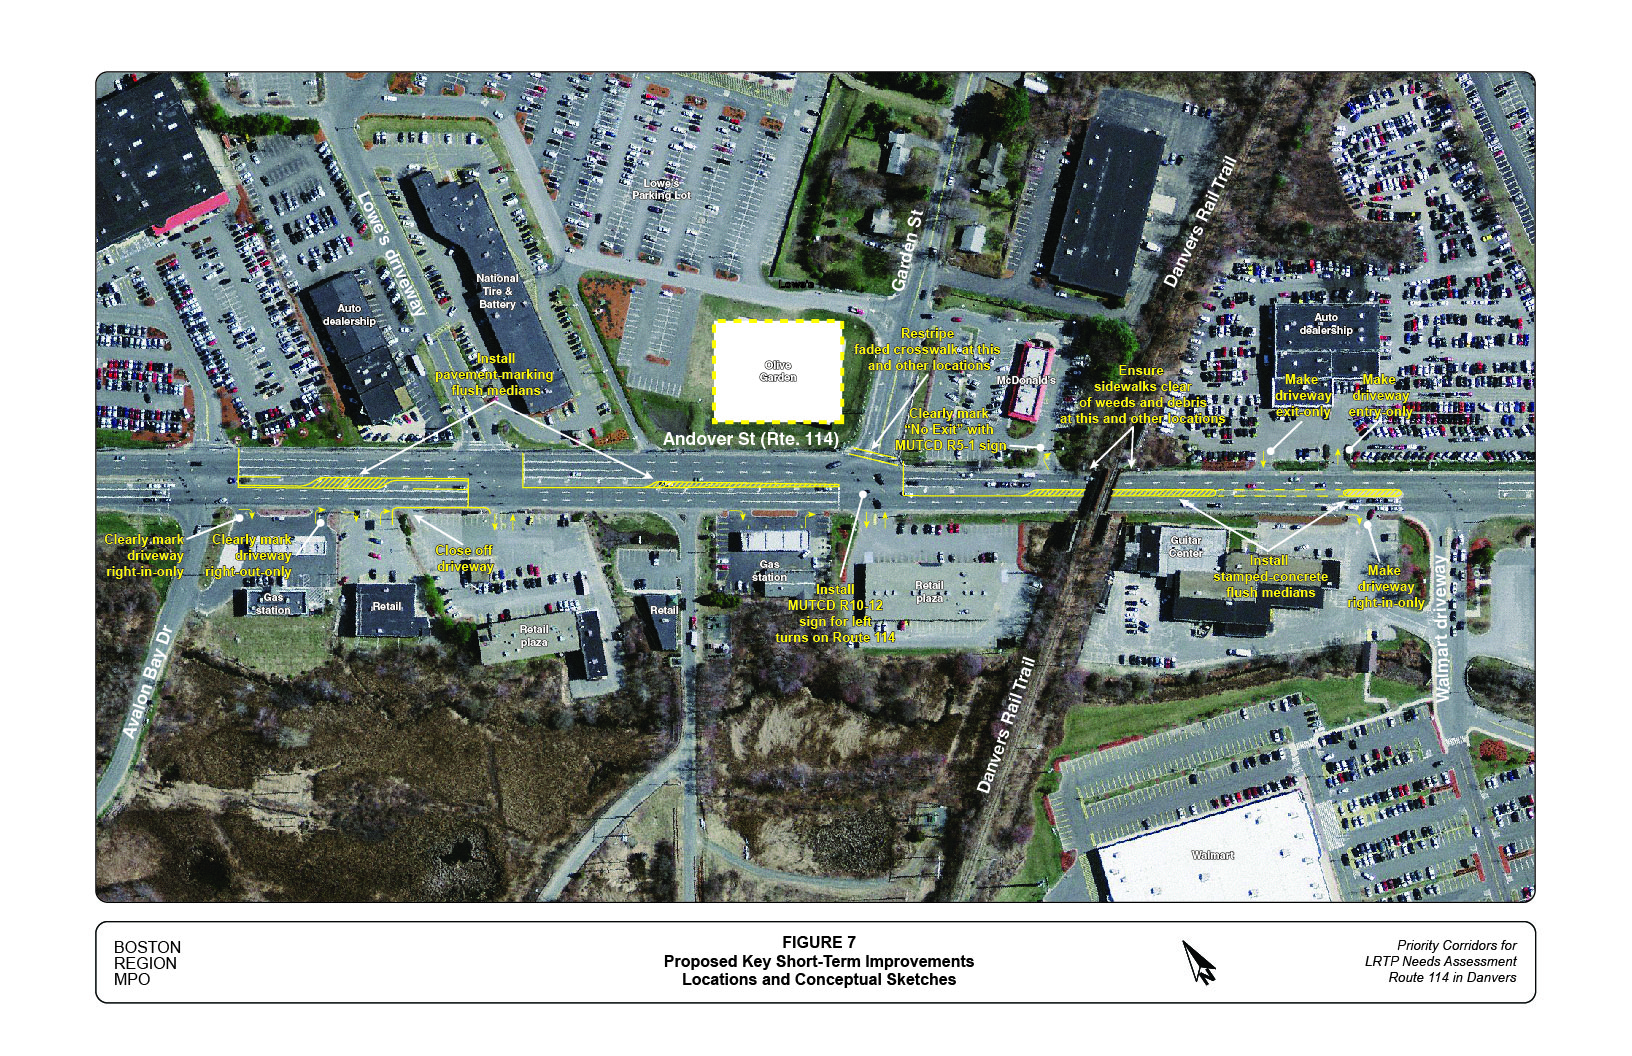
Figure 8
Proposed Long-Term Improvements - Alternative 1 Conceptual Plan (Western Section)
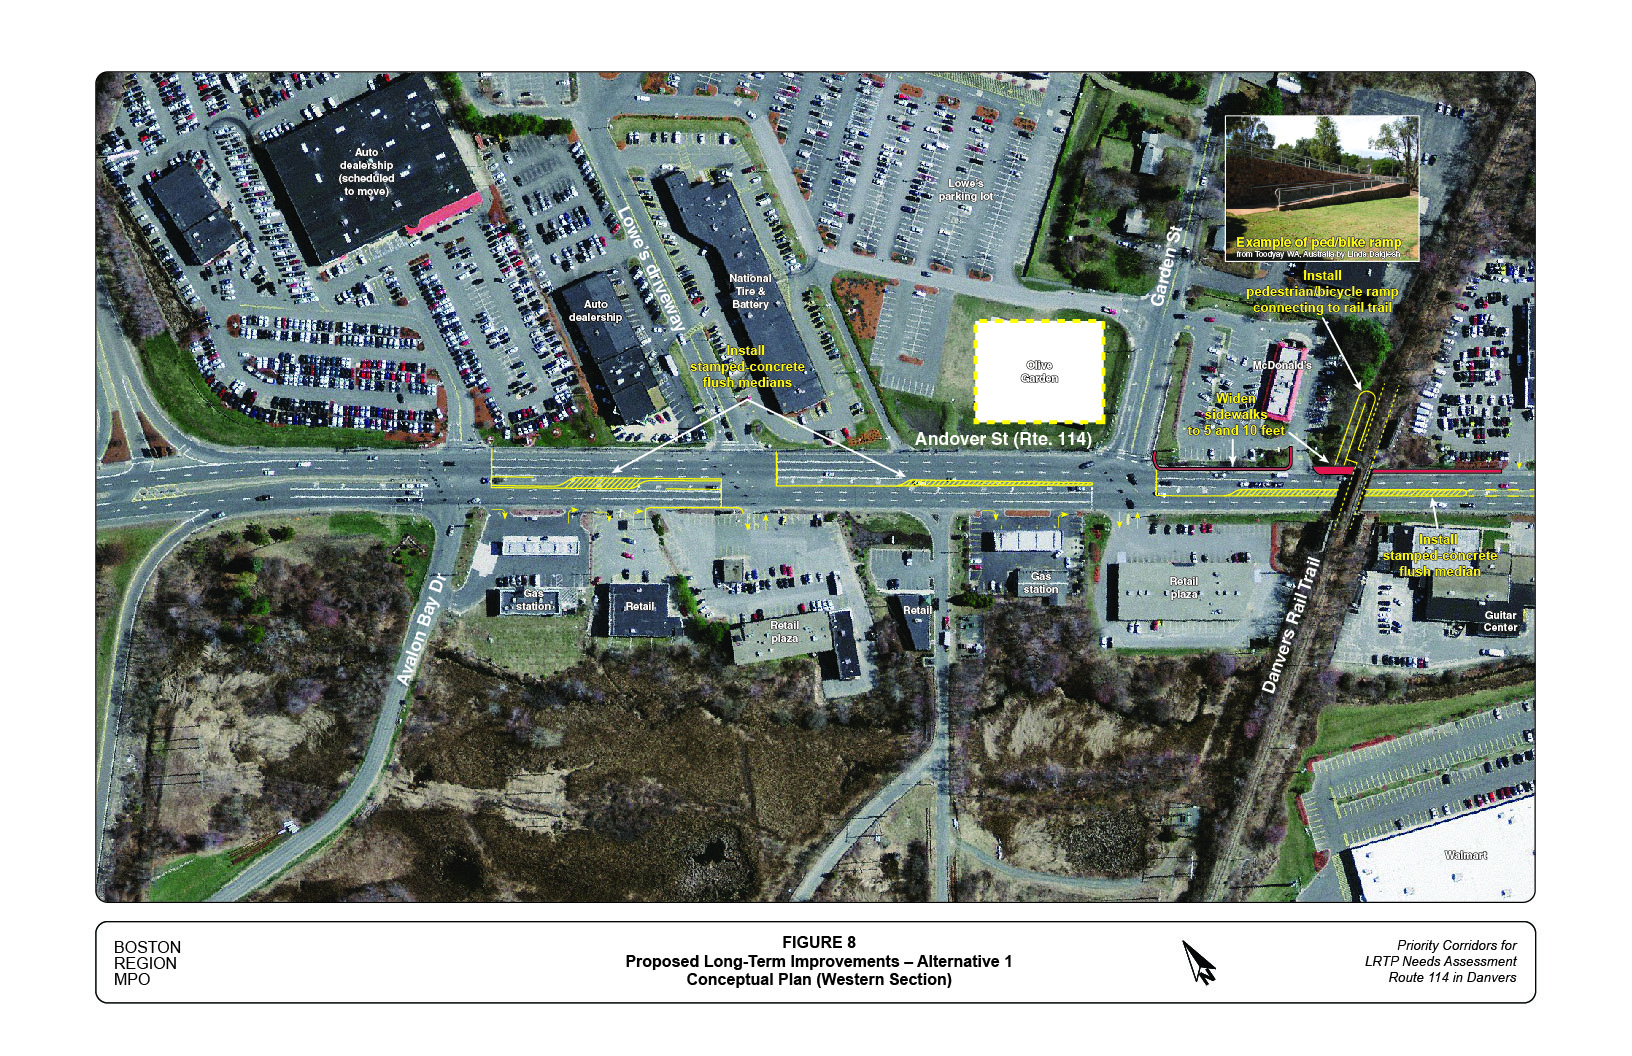
Figure 9
Proposed Long-Term Improvements - Alternative 1 Conceptual Plan (Middle Section)
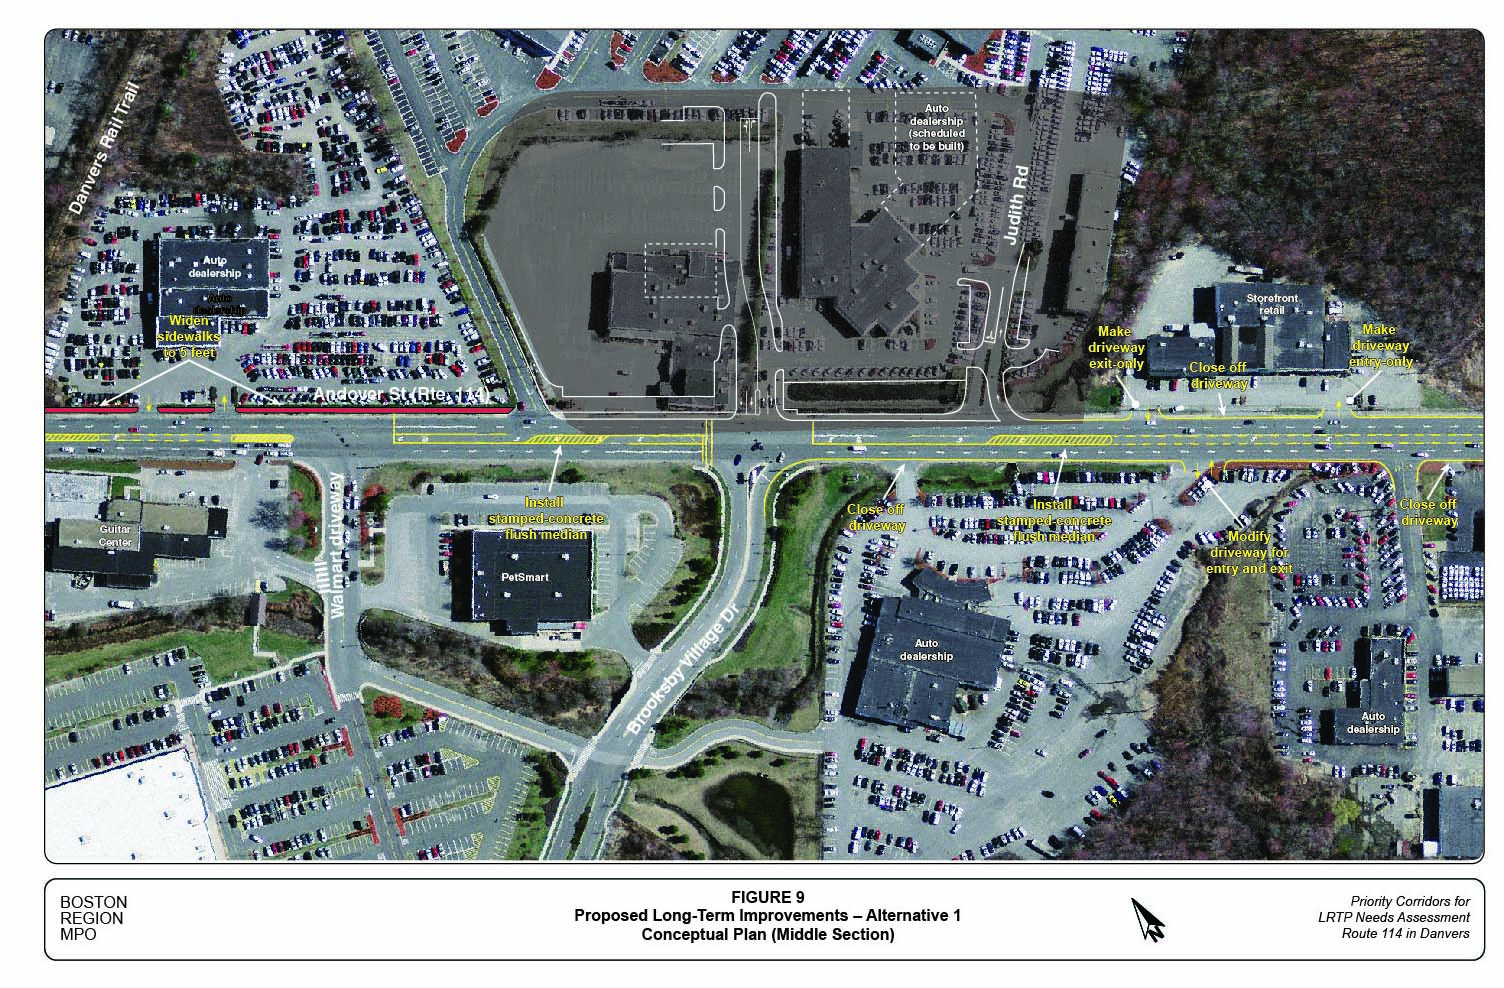
Figure 10
Proposed Long-Term Improvements - Alternative 1 Conceptual Plan (Eastern Section)
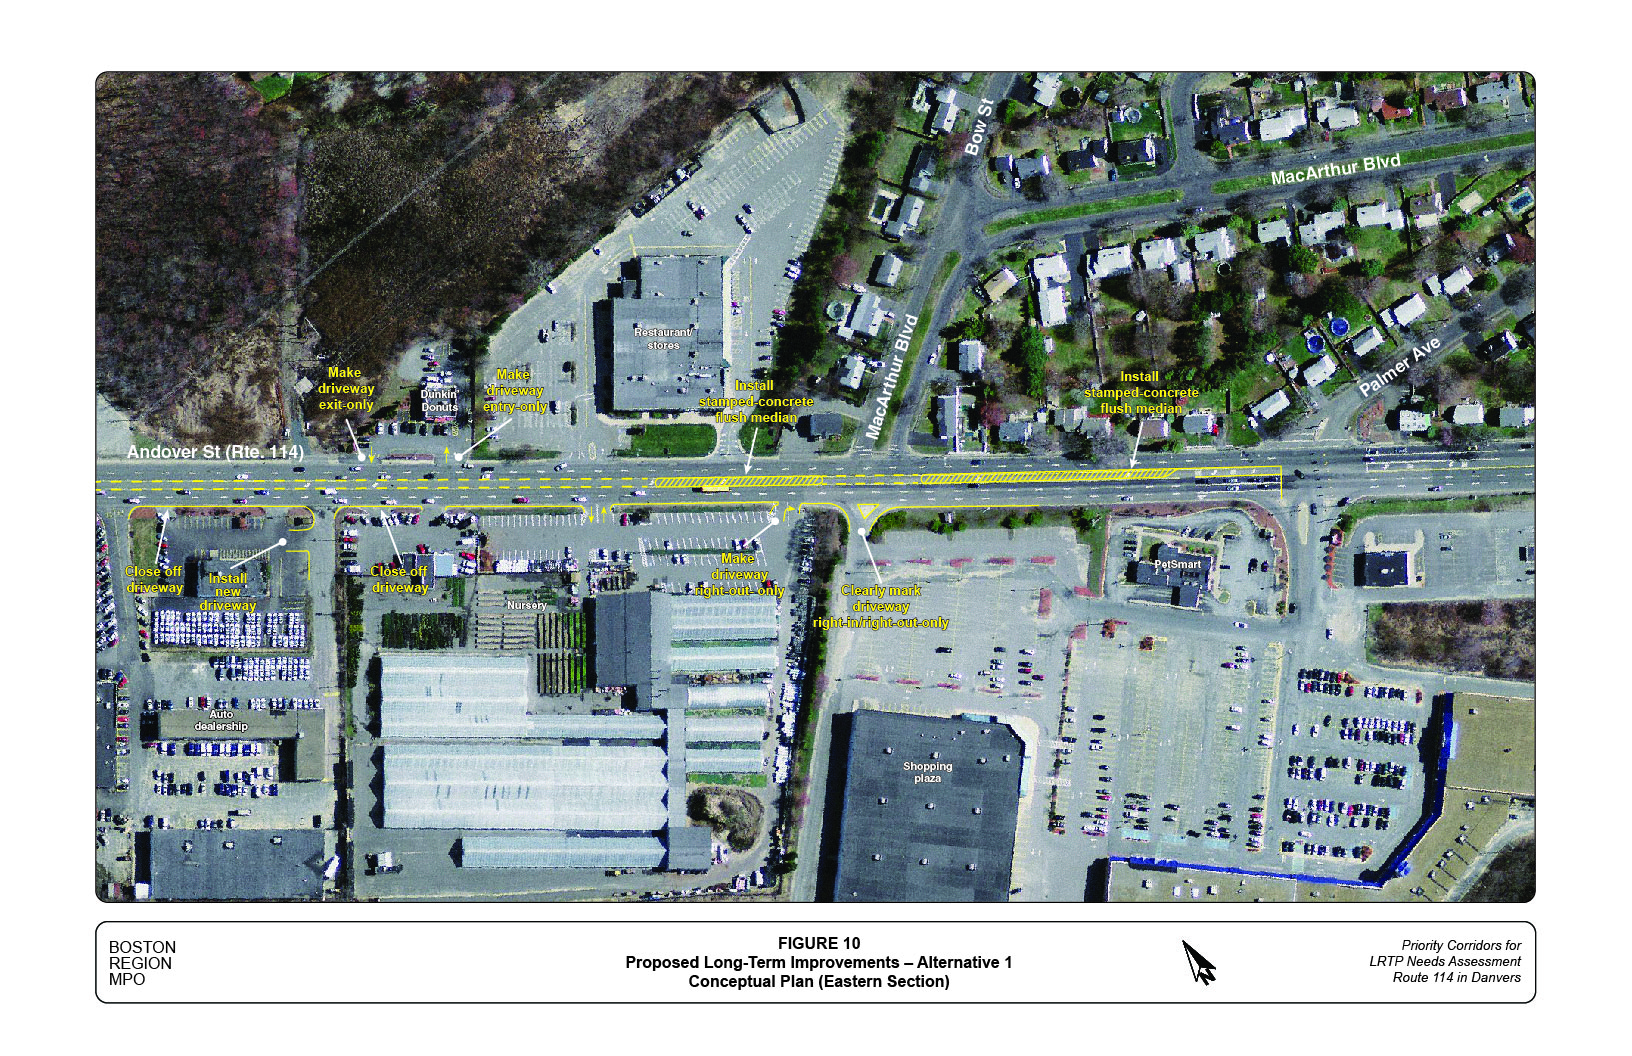
Figure 11
Proposed Long-Term Improvements - Alternative 1 Street Cross-Section Conceptual Diagrams
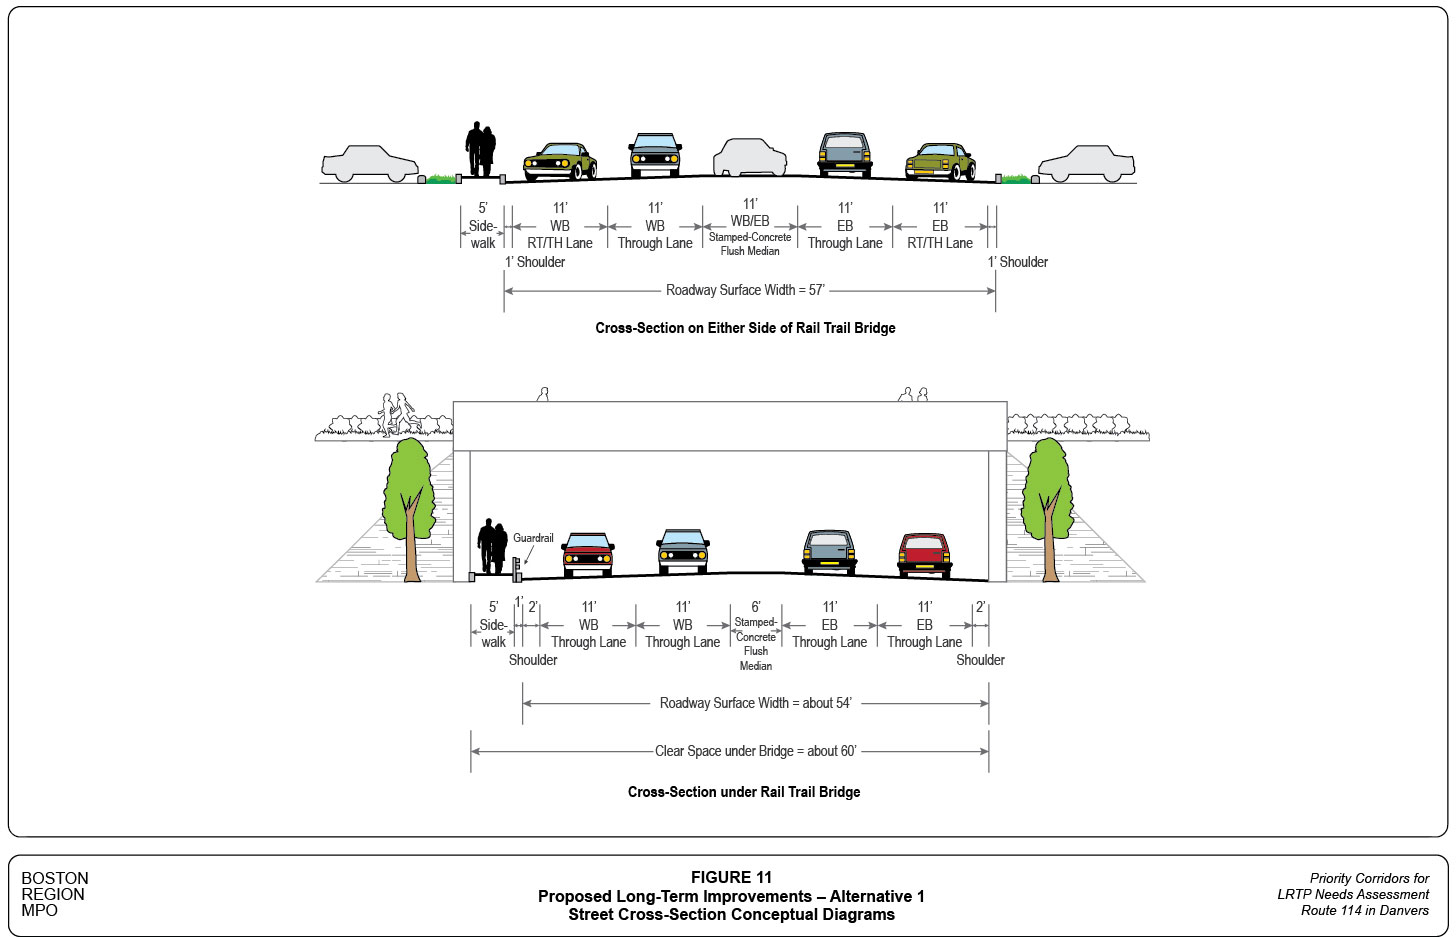
Figure 12
Proposed Long-Term Improvements - Alternative 2 Conceptual Plan (Western Section)
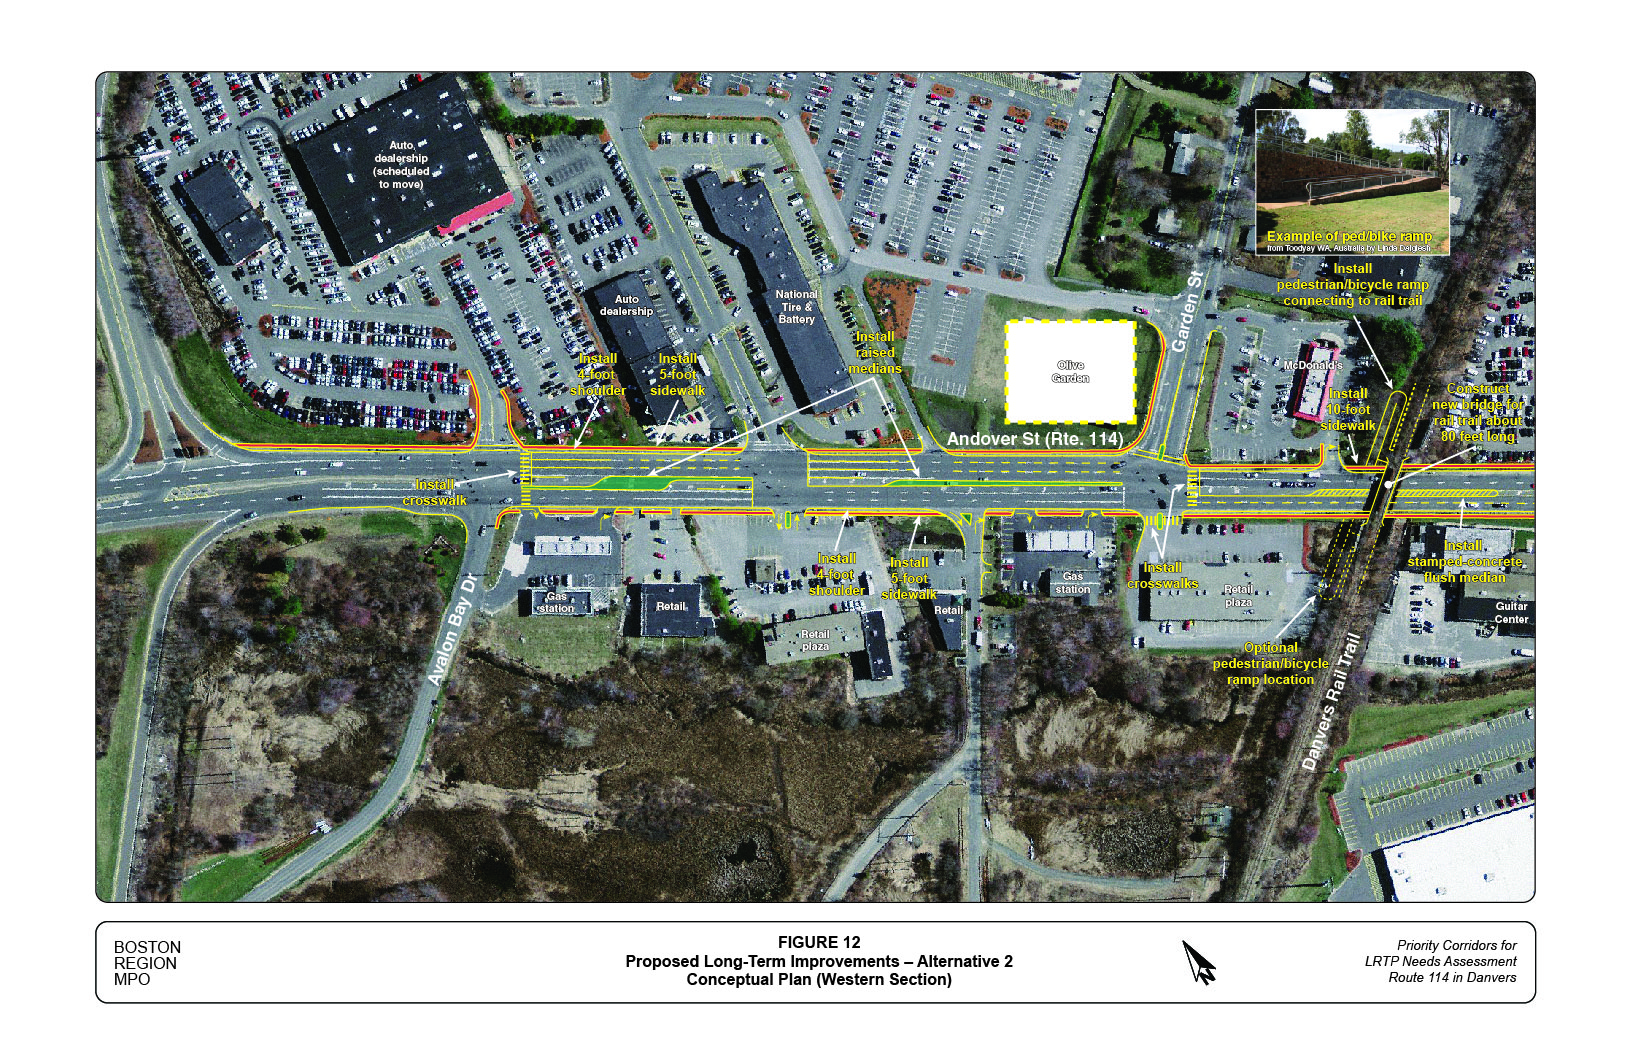
Figure 13
Proposed Long-Term Improvements - Alternative 2 Conceptual Plan (Middle Section)
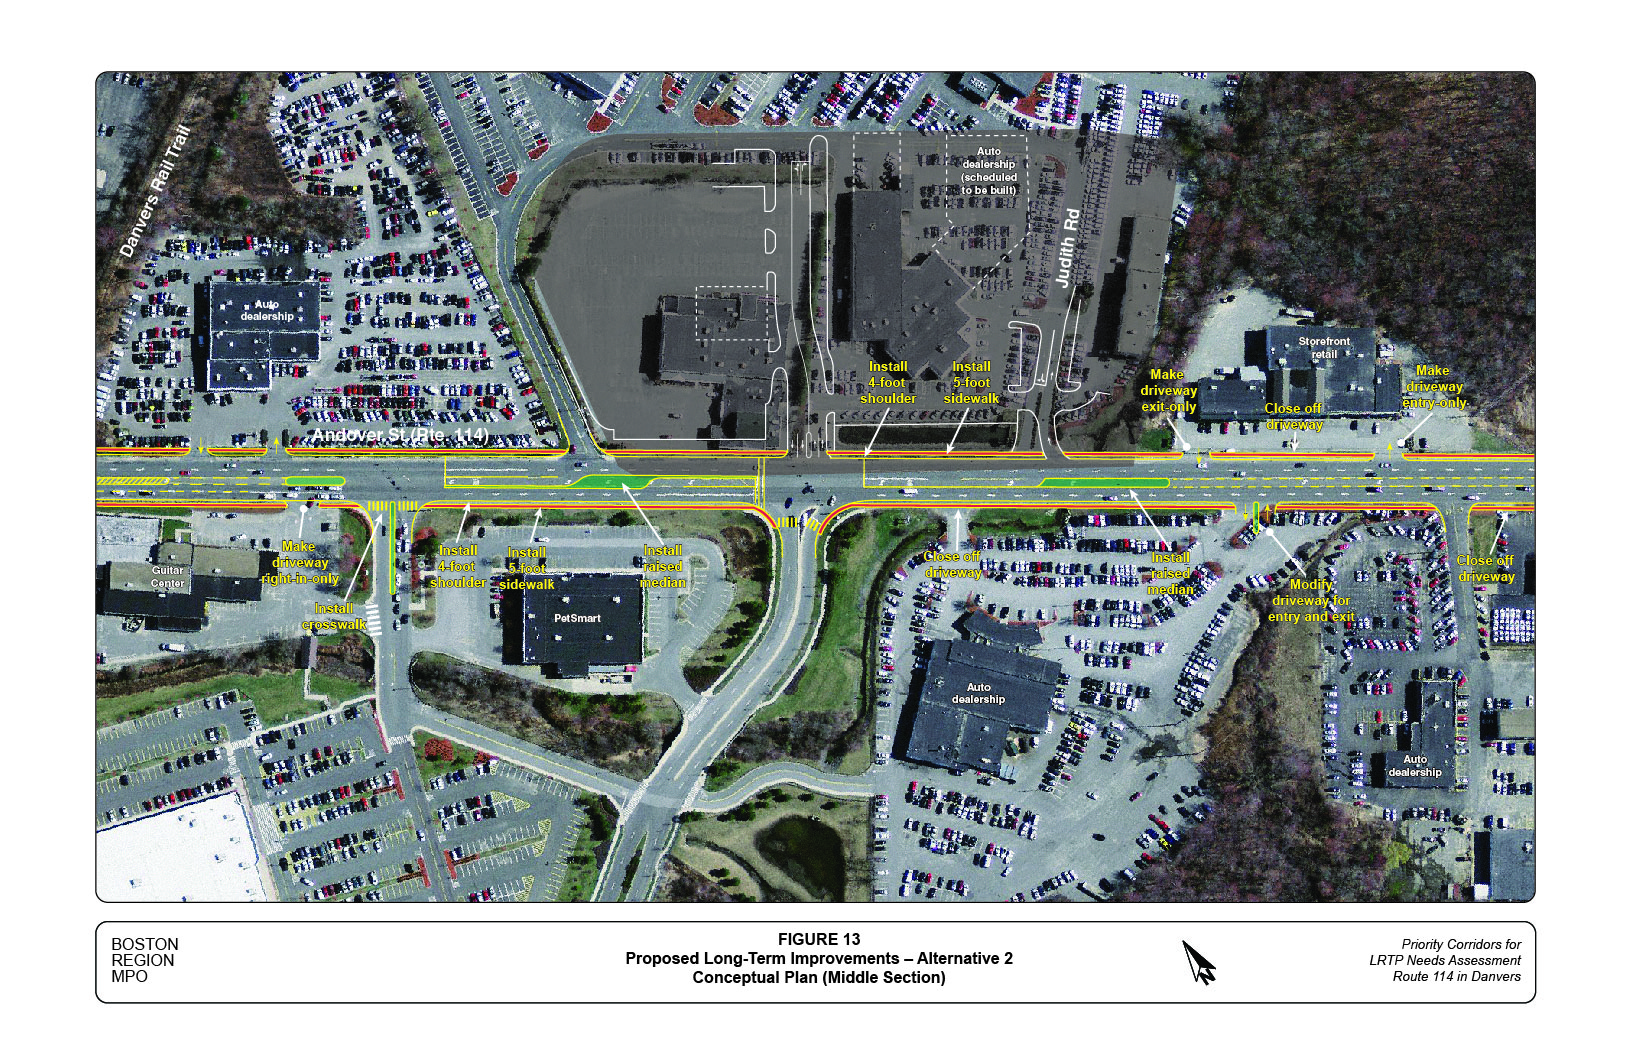
Figure 14
Proposed Long-Term Improvements - Alternative 2 Conceptual Plan (Eastern Section)
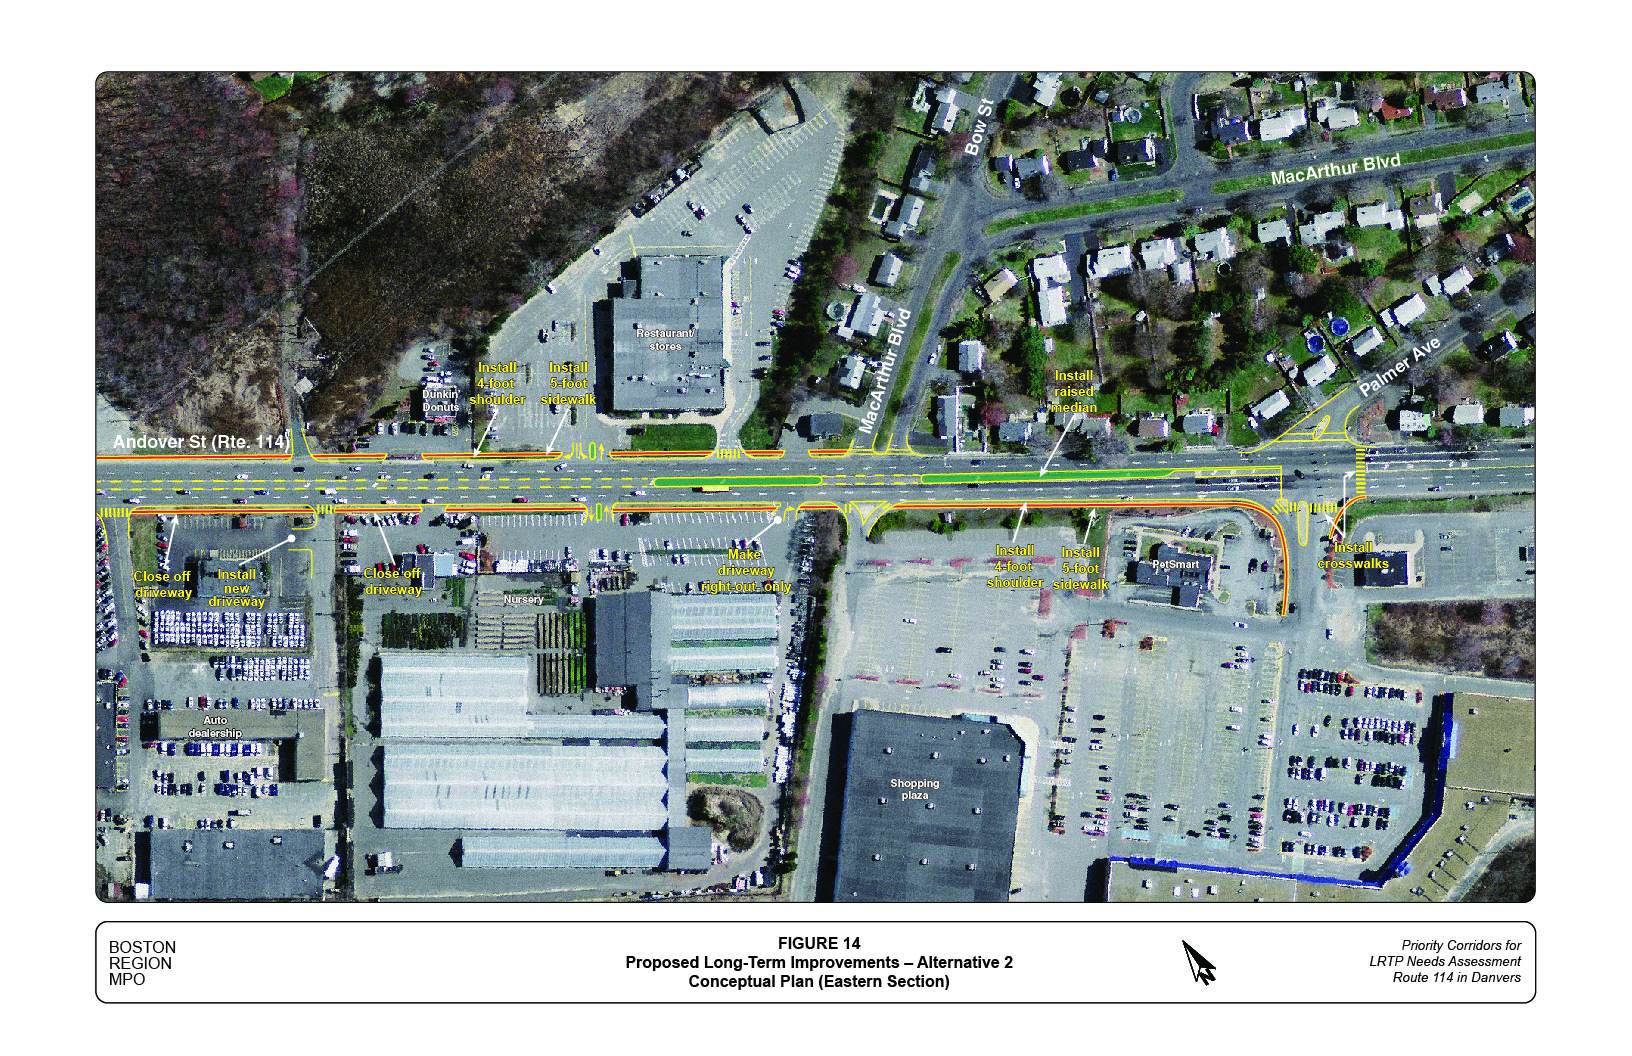
Figure 15
Proposed Long-Term Improvements - Alternative 2 Street Cross-Section Conceptual Diagrams