Memorandum
Date March 21, 2013
TO Boston Region Metropolitan Planning Organization
FROM Karl H. Quackenbush
CTPS Executive Director
RE Work Program for: Household Survey–Based Travel Profiles and Trends
Review and approval
That the Boston Region Metropolitan Planning Organization vote to approve the work program for Household Survey–Based Travel Profiles and Trends in the form of the draft dated March 21, 2013.
Technical Support/Operations Analysis Projects
11146
Boston Region Metropolitan Planning Organization
Principal: Efi Pagitsas
Manager: William S. Kuttner
MPO 3C Planning Contract #75086
MPO §5303 Contract #75364
This is MPO work and will be carried out in conformance with the priorities established by the MPO.
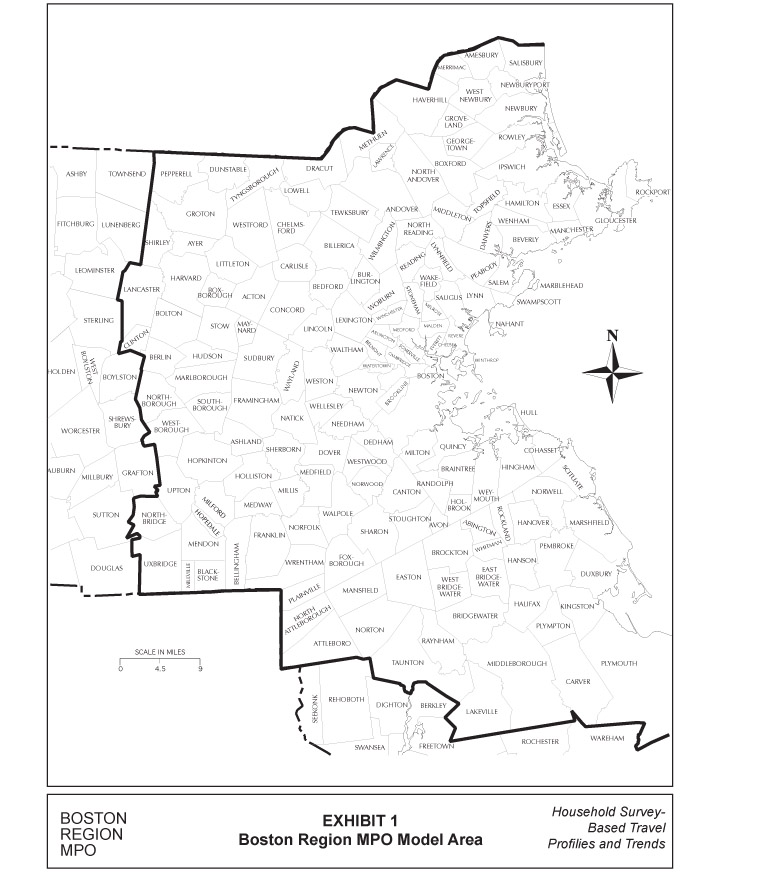
Over a sixteen-month period during 2010-2011, the Massachusetts Household Travel Survey obtained travel information from 15,017 Massachusetts households, of which 10,399 were located in the 164-municipality Boston Region MPO model area, shown in the accompanying graphic. Every household member prepared a diary for a specified day and reported all trips, modes of travel, and prices paid, and the type of activity at each visited location from the beginning of the day to the end. In addition, a wealth of sociodemographic information was obtained from each participating household. The survey is currently undergoing quality control and is being formatted for use in travel model development. Expansion factors are being estimated based upon the American Community Survey (ACS), an annual survey program of the United States Census Bureau.
A similar survey was undertaken during April and May of 1991, which obtained a smaller sample of 3,743 households, all located in the model area. The 1991 survey responses were expanded using the so-called “long form” household data sample that was used by the U.S. Census through 2000. The expanded 1991 survey was used to develop the original equations used in the regional travel demand model and also served as a data resource for subsequent topical studies.
The principal objectives of this study are:
In Task 1, data from the 2010-2011 Massachusetts Household Travel Survey will be analyzed to create a 2011 demographic and transportation profile. Frequency, purpose, and distance of trips will be identified and disaggregated by subregion and socioeconomic factors to the extent possible given the sample sizes. Information from the 2010 U.S. census and recent ACS surveys may also be used in developing the regional profile. Since the 2010-2011 survey was a statewide survey, commuting patterns between central and southeastern Massachusetts and the Boston Region MPO model area will also be summarized.

Tables, charts, and maps depicting 2011 profile.
In Task 2, staff will quantify transportation trends and related demographic trends that that can be developed from the 1991 and 2010-2011 household travel surveys. Much of the travel information and some of the socioeconomic data obtained in the two household travel surveys are directly comparable. Trends in the frequency, purpose, and distance of trips will be identified, and they will be disaggregated by subregion and socioeconomic factors to the extent possible given the sample sizes. Relevant information from the 1990 and 2010 censuses and recent ACS surveys may be utilized in this analysis.
Tables, charts, and maps of identified 20-year trends.
In Task 3, staff will prepare a final report that presents key findings of Tasks 1 and 2. Planning and policy implications suggested by the profile and trends will be identified and discussed in the report.
Final report
It is estimated that this project will be completed nine months after work commences. The proposed schedule, by task, is shown in Exhibit 1.
The total cost of this project is estimated to be $66,681. This includes the cost of 21.9 person-weeks of staff time and overhead at the rate of 96.58 percent. A detailed breakdown of estimated costs is presented in Exhibit 2.
KQ/WSK/wsk
Task |
Month | ||||||||
|---|---|---|---|---|---|---|---|---|---|
| 1 | 2 | 3 | 4 | 5 | 6 | 7 | 8 | 9 | |
|
1.
Develop Regional 2011 Demographic and Transportation Profile |
From month 3 to 10.
| ||||||||
|
2.
Quantify 20-Year Transportation Trends |
From month 1 to 5.
| ||||||||
|
3.
Prepare Final Report |
From month 5 to 10.
Deliverable 1, Final Report delivered by Month 10
| ||||||||
Task |
Person-Weeks | Direct Salary |
Overhead (96.58%) |
Total Cost |
||||
|---|---|---|---|---|---|---|---|---|
| M-1 | P-5 | P-4 | P-2 | Total | ||||
|
1.
Develop Regional 2011 Demographic and Transportation Profile |
0.8 | 4.4 | 1.4 | 0.5 | 7.1 | $10,941 | $10,567 | $21,509 |
|
2.
Quantify 20-Year Transportation Trends |
0.8 | 4.1 | 1.3 | 0.5 | 6.7 | $10,312 | $9,959 | $20,271 |
|
3.
Prepare Final Report |
1.2 | 5.1 | 1.3 | 0.5 | 8.1 | $12,667 | $12,234 | $24,901 |
|
Total |
2.8 | 13.6 | 4.0 | 1.5 | 21.9 | $33,921 | $32,761 | $66,681 |