Technical Memorandum
DATE: December 18, 2014
TO: Boston Region Metropolitan Planning Organization
FROM: Anne McGahan, MPO Staff
RE: Long-Range Transportation Plan Needs Assessment Priorities
The Needs Assessment chapter of the Long-Range Transportation Plan (LRTP), which reports the prioritized needs for the region, is not yet available for publishing. However, this memorandum outlines the conclusions of that assessment. The prioritized needs are an important factor in establishing the scenarios that will be presented in the next phase of LRTP development.
A critical early step in developing the LRTPis to gather, organize, and analyze available sources of data about the transportation system. This allows the MPO to understand the many needs that exist for all transportation modes. The Needs Assessment is being developed with the Boston Region MPO’s draft vision, goals, and objectives for the region’s transportation future in mind. It will guide the MPO’s decision making about how to address the region’s needs through the LRTP; guide future decision making about which projects to fund in the Transportation Improvement Program (TIP); and which studies to conduct through the Unified Planning Work Program (UPWP).
Information about the region’s transportation needs has been organized by using the theme of the LRTP’s goals, which are used to evaluate projects included in the LRTP’s Universe of Projects List during the next phase of LRTP development—the scenario planning process. The LRTP’s goals are as follows:
Chapter 4 of the Needs Assessment will contain information about the region’s specific needs. When complete, this chapter will include the following information:
The following sections provide background information for each goal and a list of prioritized needs pertaining to that goal. Also included are the potential MPO programs that would help to address the goal.
Safety continues to be a top priority at the federal, state, and regional level. At the federal level, Moving Ahead for Progress in the 21st Century’s (MAP-21) established a goal to achieve significant reduction in traffic fatalities and serious injuries on all public roads. At the state level, goals in the Massachusetts Strategic Highway Safety Plan (SHSP) include:
The MPO shares federal and state goals of reducing crash severity for all users of the transportation system. At the regional level, the MPO’s safety goal states, “transportation by all modes will be safe.” The MPO will support this goal by committing to take steps to reduce the number and severity of crashes, and serious injuries and fatalities caused by transportation modes. The MPO is making this commitment via two planning mechanisms currently in development: 1) the LRTP objectives, and 2) performance-measurement program.
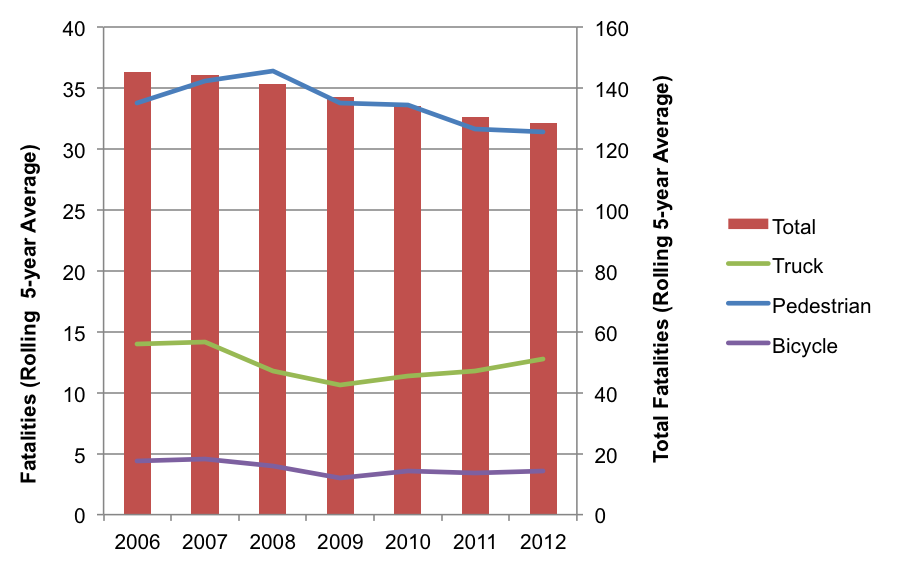
Overall, safety is improving in the region. Between 2006 and 2012, traffic fatalities (based on a rolling five-year average) decreased from 145 fatalities in 2006 to 129 in 2012. Figure 1 shows the change in traffic fatalities by mode during this time period and indicates that the 11 percent decline in fatalities included fewer automobile, truck, pedestrian, and bicycle fatalities. Similarly, total traffic crashes and injuries declined by 21 percent and 27 percent, respectively between 2006 and 2012.
FIGURE 1
Traffic Fatalities in the Boston Region MPO by Mode, 2006–2012
Source: Massachusetts Department of Transportation, National Highway Traffic Safety Administration Fatality Reporting System, and the Massachusetts Department of Transportation Crash Data System.
Despite these overall gains, crashes and injuries for pedestrians and bicyclists rose during this same period, as shown in Figure 2. Between 2006 and 2012, roughly two-thirds of pedestrian and bicycle crashes resulted in an injury. For pedestrians, the number of crashes increased by 18 percent and injuries grew by 31 percent. For bicycles, the number of crashes increased by 36 percent and injuries jumped by 46 percent.
FIGURE 2
Traffic Injuries in the Boston Region MPO by Mode, 2006–2012
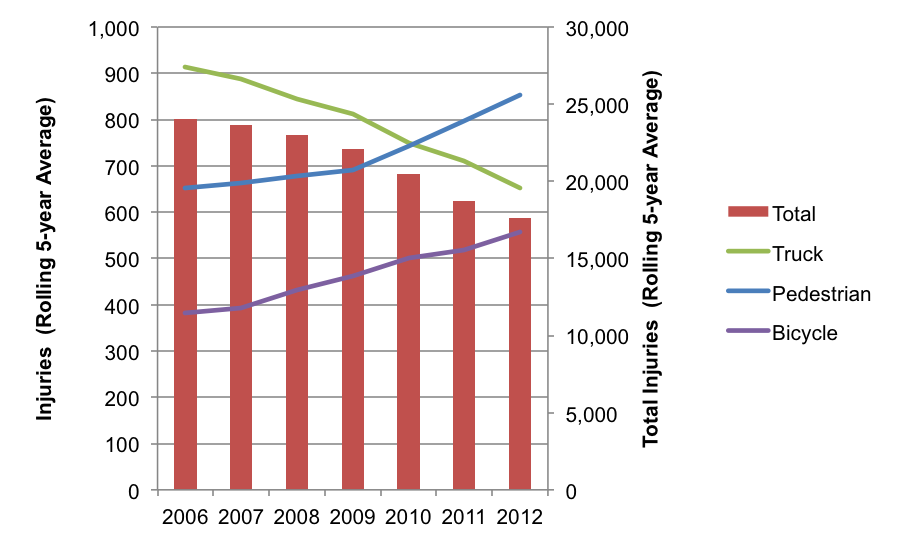
Source: Massachusetts Department of Transportation, National Highway Traffic Safety Administration Fatality Reporting System, and the Massachusetts Department of Transportation Crash Data System.
The most dangerous locations on the region’s roadway network are identified by using geographic information system (GIS) mapping to locate specific crash sites and the Equivalent Property Damage Only (EPDO) index to determine the severity of those crashes. The EPDO is a weighted index that assigns a value to each crash based on whether the accident resulted in a fatality, injuries, or property damage. A crash involving a fatality receives the most points (10), followed by a crash involving injuries (5), then a crash involving only property damage (1).
Crash data, which is compiled by the MassDOT Registry of Motor Vehicles, is analyzed for a three-year period to identify locations where multiple crashes have occurred. The combined EPDOs of the crashes in these so called “crash clusters” measure the severity of the safety problem at a particular intersection, highway interchange, or roadway segment.
Table 1 presents a list of the top-25 highway crash locations in the Boston region, based on EPDO from 2009 to 2011; and includes accompanying crash data from MassDOT’s Registry of Motor Vehicles.
TABLE 1
Top-25 Highway Crash Locations in the Boston Region MPO
| Municipalities |
EPDO |
Top 200 |
HSIP Crash Cluster |
Truck Crash Cluster |
Pedestrian Crash Cluster |
Bicycle Crash Cluster |
|
|---|---|---|---|---|---|---|---|
Interstate 93 at Columbia Rd |
Boston |
464 |
X |
X |
X |
X |
|
Middlesex Turnpike at Interstate 95 |
Burlington |
388 |
X |
X |
|||
Route 3 at Route 18 (Main Street) |
Weymouth |
339 |
X |
X |
|||
Interstate 93 (Near Ramps for Furnace Brook Parkway) |
Quincy |
330 |
X |
X |
|||
East St Rotary at Rte 1 and Rte 128 |
Westwood |
328 |
X |
X |
|||
Interstate 95 at Interstate 93 |
Reading |
326 |
X |
X |
X |
||
I-93 at Granite Ave (Exit 11) |
Milton |
325 |
X |
X |
|||
Interstate 95 at Route 2 |
Lexington |
324 |
X |
X |
|||
Route 9 at Interstate 95 |
Wellesley |
320 |
X |
X |
|||
I-93 at North Washington St |
Boston |
319 |
X |
X |
|||
I-93 at Rte 138 (Washington St) |
Canton |
316 |
X |
X |
|||
I-93 at Route 3A (Gallivan Blvd/Neponset Ave) |
Boston |
271 |
X |
X |
|||
Interstate 95 at Rte 4 (Bedford St) |
Lexington |
270 |
X |
X |
|||
Route 18 (Main Street) at West St |
Weymouth |
247 |
X |
X |
X |
||
Interstate 93 at Rte 37 (Granite St) |
Braintree |
245 |
X |
X |
X |
||
Route 139 (Lindelof Ave) at Rte 24 |
Stoughton |
240 |
X |
||||
Interstate 93 at Leverett Connector |
Boston |
236 |
X |
||||
Interstate 93 at Route 28 |
Medford |
233 |
X |
X |
X |
||
Rte 128 at Route 114 (Andover St) |
Peabody |
219 |
X |
X |
|||
I-93 at Rte 28 and Mystic Ave |
Somerville |
214 |
X |
X |
X |
||
Storrow Dr at David G. Mugar Way |
Boston |
212 |
X |
||||
Rte 28 (Randolph Ave) at Chickatawbut Rd |
Milton |
203 |
X |
X |
|||
Route 2 – Crosby’s Corner |
Concord/Lincoln |
200 |
X |
X |
|||
Route 1 at Route 129 |
Lynnfield |
194 |
X |
X |
|||
Route 1 at Route 129 (Walnut St) |
Saugus |
193 |
X |
EPDO = Equivalent Property Damage Only. HSIP = Highway Safety Improvement Program.
Source: MassDOT Registry of Motor Vehicles.
According to the MassachusettsSHSP, more than one in five fatalities in the state occurs at an intersection. Consistent with the SHSP, intersection safety remains an area of emphasis for the Boston Region MPO. Seventy-nine of the Top-200 Crash Locations are located in the Boston Region MPO. Corridors with multiple Top-200 Crash Locations include Route 9 in Natick and Framingham, Route 18 in Weymouth, Route 107 in Lynn, Route 16 in Newton and Wellesley, Route 126 in Bellingham, and Route 16 in Milford.
Pedestrians are one of the state’s nine strategic areas and an ongoing focus of the Boston Region MPO. As vulnerable users of the transportation system, pedestrians are more susceptible to risk than other roadway users. In the Boston region, pedestrians account for a growing share of crashes and a disproportionate share of injuries.
The MassDOT Crash Clusters map identifies the top pedestrian crash locations throughout the state. Highway Safety Improvement Program (HSIP) Pedestrian Clusters are locations with the highest crash severity for pedestrian-involved crashes based on EPDO. In the Boston region, there are many clusters in urban areas, including the downtown sections of Boston, Chelsea, Framingham, Lynn, Malden, Natick, Peabody, Salem, Waltham, and Wellesley; as well as along Massachusetts Avenue in Cambridge, Hancock Street in Quincy, and in Newton Centre, Watertown Square, and Davis Square in Somerville.
There are also locations across the region where conditions remain unsafe for pedestrians, but which are not at the HSIP Pedestrian Cluster level. For less urban areas, sidewalk coverage is less extensive and often inconsistent. These inadequate facilities are an ongoing issue for suburban communities with a desire for more transit options. In addition, the need for adequate sidewalks should increase along with the region’s growing elderly population.
Bicyclists are one of the state’s four most proactive areas, and a growing priority of the Boston Region MPO. Similar to pedestrians, bicyclists also are vulnerable users of the transportation system and account for a growing share of crashes and a disproportionate share of injuries in the region.
The state also compiles high crash locations for bicycles. HSIP Bicycle Clusters are locations with the highest crash severity for bicycle-involved crashes based on EPDO. In the Boston region, there are multiple HSIP Bicycle Clusters in urban areas, ranging from the downtown sections of Beverly, Chelsea, Framingham, Lexington, Lynn, Natick, Salem, to Commonwealth Avenue in Boston, Harvard Street in Brookline, Massachusetts Avenue in Arlington and Cambridge, Main Street in Waltham, and Beacon Street and Somerville Avenue in Somerville.
During the past decade, the state has made substantial progress in expanding the bicycle network in order to increase bicycle usage and safety. Yet a majority of the region still lacks adequate bicycle infrastructure. The limits of the network also limit the likelihood of bicycling as a transportation option. Similar to other modes of travel, bicyclists require safe conditions, and an infrastructure to help create those desired conditions.
Truck-involved crashes also are one of the state’s four proactive emphasis areas. As among the larger and heavier vehicles used in the transportation system, trucks account for a greater proportion of crash severity than other modes. Between 2006 and 2012, trucks made up approximately five percent of crashes, yet accounted for nine percent of fatalities.
MPO staff compiled high crash locations throughout the region based on truck-related EPDO. In the Boston region, the majority of high crash locations for trucks are located at older interchanges with obsolete designs. These interchanges connect express highways to express highways and express highways to arterials. Express highway to express highway interchanges with high truck crash severity includes I-95 interchanges at I-93 in Woburn, I-90 in Weston, and I-93 in Canton. Express highway to arterial interchanges with high truck crash severity includes I-95 interchanges at Route 1 in Dedham, Middlesex Turnpike in Burlington, and Route 138 in Canton.
Table 2 cites locations in the Boston Region MPO that have multiple safety needs, as described above.
TABLE 2
Locations with Multiple Safety Needs
| Municipalities |
T0p 200 |
HSIP Crash Cluster |
Truck Crash Cluster |
Pedestrian Crash Cluster |
Bicycle Crash Cluster |
|
|---|---|---|---|---|---|---|
Downtown Framingham |
Framingham |
X |
X |
X |
X |
X |
Rte 20 (Main Street) and Moody St |
Waltham |
X |
X |
X |
X |
X |
Watertown Square |
Watertown |
X |
X |
X |
X |
X |
Washington Street |
Salem |
X |
X |
X |
X |
X |
Everett Avenue |
Chelsea |
X |
X |
X |
X |
X |
Essex Street |
Lynn |
X |
X |
|
X |
X |
Route 107 (Western Avenue) |
Lynn |
X |
X |
X |
X |
|
Massachusetts Avenue |
Arlington |
X |
X |
X |
X |
|
Route 16 (Alewife Brook Parkway) |
Arlington, Somerville, Cambridge |
X |
X |
X |
|
X |
Broadway |
Chelsea |
|
X |
X |
X |
X |
Newtonville |
Newton |
|
X |
X |
X |
X |
Route 16 (East Main Street) |
Milford |
X |
X |
X |
|
|
I-495 at Route 126 (Hartford Ave) |
Bellingham |
X |
X |
X |
|
|
Downtown Quincy |
Quincy |
X |
X |
|
X |
|
I-95 at Route 16 (Washington St) |
Newton |
X |
X |
X |
|
|
Route 16 (Revere Beach Parkway) |
Revere, Everett, Medford |
X |
X |
X |
|
|
I-495 at Route 1A (South Street) |
Wrentham |
X |
X |
X |
|
|
Route 20 (East Main Street) |
Marlborough |
X |
X |
X |
|
|
Route 9 |
Framingham, Natick |
X |
X |
X |
|
|
Downtown Natick |
Natick |
|
X |
|
X |
X |
Downtown Lynn |
Lynn |
|
X |
|
X |
X |
Route 1A |
Lynn |
|
X |
X |
X |
|
Rte 28 (McGrath Hwy) at Washington St |
Somerville |
|
X |
|
X |
X |
Newton Center |
Newton |
|
X |
|
X |
X |
Cambridge Street |
Cambridge |
|
X |
|
X |
X |
Route 16 (Mystic Valley Parkway) |
Medford |
|
X |
X |
X |
|
HSIP = Highway Safety Improvement Program.
Source: MassDOT Registry of Motor Vehicles.
System preservation is a priority for the MPO because the transportation infrastructure in the region is aging. The demands placed on highway and transit facilities have been taxing to the point that routine maintenance is insufficient to keep up with the need. As a result, there is a significant backlog of maintenance and state-of-good repair work to be done on the highway and transit system, including bridges, roadway pavement, transit rolling stock, and traffic and transit control equipment. Under these circumstances, system preservation and efficiency have become more important. Maintenance must receive attention, but because of the region’s financial constraints, the MPO will set priorities, considering the most crucial maintenance needs and the most effective ways to deploy funding.
In addition, the MPO agrees that if climate trends continue as projected, the conditions in the Boston region likely would include a rise in sea level coupled with storm-induced flooding, and warmer temperatures that would affect the region’s infrastructure, economy, human health, and natural resources. The MPO seeks to improve resiliency of infrastructure that could be affected by climate change through its evaluation criteria. The MPO rates projects on how well the proposed project design improves the infrastructure’s ability to respond to extreme conditions and addresses those impacts. This information helps guide decision making in the LRTP and TIP. The MPO also recognizes the need to keep major routes well maintained in order to respond to emergencies and evaluates projects on how well they improve emergency response or improve an evacuation route, diversion route, or an alternate diversion route.
The MPO, through its studies and freight-planning work also acknowledges that movement of freight is critical to the region’s economy. The majority of freight is moved by truck in this region. Major highway freight routes must be maintained to allow for the efficient movement of goods. The MPO also places special emphasis on protecting all freight network elements, including port facilities that are vulnerable to climate-change impacts.
MassDOT and the MBTA prioritize resources for bridge preservation, as well as repair and replacement, and fund this work through the Statewide Bridge Program and MBTA bridge initiatives. Five percent of the bridges in the Boston Region MPO are structurally deficient while statewide, nine percent are structurally deficient. This indicates that MassDOT’s program is addressing the bridge maintenance needs in the Boston Region MPO area at a higher rate than the rest of the state.
The Boston Region MPO currently does not maintain an independent pavement management tool, but relies on MassDOT’s pavement management program. It has been the policy of the MPO not to fund resurfacing-only projects in the TIP. However, the MPO does make funding decisions for roadway reconstruction projects that include resurfacing, usually deep reconstruction, in addition to other design elements.
An analysis of the pavement on MassDOT-maintained roadways in the Boston Region MPO area indicates that approximately 70 percent are in good condition, 25 percent in fair condition, and 5 percent in poor condition—which meets MassDOT’s performance measure of at least 65 percent of the pavement in good condition. However, when this information is broken down further, looking at the pavement in poor condition by roadway type—interstate, arterial, and access-controlled arterials—MassDOT-maintained arterial roadways make up 62 percent of the monitored roadways, but 90 percent of the roadways that are in poor condition (see Figure 3).
FIGURE 3
Pavement Condition by Roadway Classification
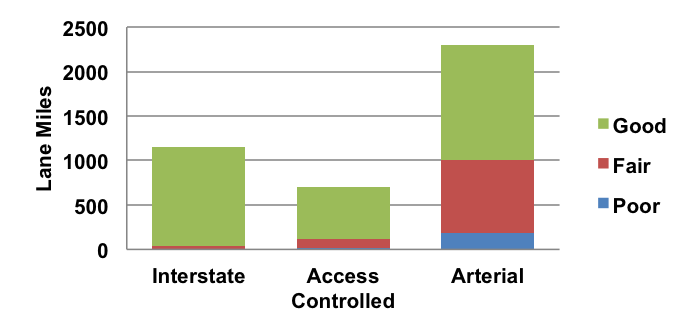
Source: Massachusetts Department of Transportation Pavement Management Program.
Pavement data indicate that the majority of these arterial roadways are located in urban centers. The Pavement Condition map, in the LRTP Needs Assessment Application, shows larger expanses of arterial roadways with poor pavement condition in the Boston, Cambridge, Chelsea, Everett, Lynn, Malden, Medford, Newton, Revere, and Somerville urban centers. The MPO can address improved pavement condition in these areas through Complete Streets or bottleneck improvement projects if they are submitted for funding consideration.
Pavement data indicate that the majority of these arterial roadways are located in urban centers. The Pavement Condition map, in the LRTP Needs Assessment Application, shows larger expanses of arterial roadways with poor pavement condition in the Boston, Cambridge, Chelsea, Everett, Lynn, Malden, Medford, Newton, Revere, and Somerville urban centers. The MPO can address improved pavement condition in these areas through Complete Streets or bottleneck improvement projects if they are submitted for funding consideration.
The MBTA has dedicated 100% of its federal formula funding, programmed through the LRTP and TIP, to maintenance and state-of-good repair projects. The MPO has not provided any of its target funding (those funds programmed at the MPO’s discretion) to the MBTA for maintenance needs in the past; however, it could in the future. This LRTP considers all transportation needs in the region, so the LRTP Needs Assessment identifies examples of transit needs in this category, including:
In addition to these needs, the MBTA will provide the MPO with a list of unfunded state-of-good-repair transit projects once the MBTA’s Capital Investment Program document is released for public review. These unfunded needs can be considered for funding in an LRTP program.
Given the shared use of the roadway system by freight and passenger vehicles, addressing the needs of the freight transportation system also will include broader automobile and bus transit mobility and safety needs. Freight priorities are stated with reference to specific freight concerns:
The MPO should continue to evaluate proposed projects to determine if they are located in areas prone to flooding, at risk of seawater inundation from hurricane storm surges, or, in the long term, sea-level rise because of climate change. The design of transportation projects in these hazard zones should address flood protection measures, such as enhanced drainage systems, or adaptations for sea-level rise, giving special attention to major infrastructure projects including tunnels and major freight routes and facilities.
Through its capacity management and mobility goal and objectives, the MPO seeks to maximize the region’s existing transportation system so that both people and goods can move reliably and connect to key destinations. The Boston region is mature, which creates challenges to making major infrastructure changes to its transportation system. The Boston region also contains high population density and concentration of key destinations and is home to extensive and well-used roadway and public transit networks. These networks provide a solid foundation that—through targeted improvements to bottlenecks and utilizing management and operations strategies—can accommodate the ways the region is expected to change and grow.
The MPO’s capacity management and mobility goal and objectives also seek to expand travelers’ travel options to reach principal destinations. One approach to increasing mobility is to reduce single-occupancy vehicle travel, which may be achieved by encouraging multi-modal transportation options, including public transportation and bicycle and pedestrian transportation, in addition to automobile travel. The MPO’s goals and objectives respond to federal, state, and regional activities to increase transit, bicycle, and pedestrian travel, such as MassDOT’s GreenDOT initiative, the MassDOT Mode Shift Goal, the Healthy Transportation Compact, and MetroFuture’s transportation goals, objectives, and strategies. They also respond to increasing demand for transit, bicycle, and pedestrian connections by communities throughout the region.
The MPO monitors the mobility of its roadways as part of its Congestion Management Process (CMP), which also includes activities to monitor high-occupancy vehicle (HOV) lanes, public transportation, and park-and-ride lot usage. It is essential to keep all transportation facilities functioning at their optimum levels because how these facilities perform affect roadway and transit congestion. Improving congestion will ease the economic loss caused by travel delay, help increase mobility, and decrease vehicle emissions.
In order to determine how well the region’s roadways are performing, the MPO applies performance measures that gauge the duration, extent, intensity, and reliability of congestion. MPO staff analyzed congestion in the region using the CMP Express Highway and Arterial Performance Dashboards, which applied the following measures:
Tables 3 and 4 show the performance measure values of the duration, intensity, and reliability of congestion for the region’s expressways and arterials. Figures 4 and 5 show the performance values of the extent of congestion for the region’s expressway and arterials.
TABLE 3
Regional Performance for Expressways
Performance Measure |
Value |
|---|---|
AM Average Speed |
57.81 mph |
AM Speed Index |
0.99 |
AM Travel Time Index |
1.12 |
PM Average Speed |
58.53 mph |
PM Speed Index |
1.01 |
PM Travel Time Index |
1.11 |
Free Flow Speed |
65.28 mph |
Average Congested Time per AM Peak Period Hour |
6.82 Minutes |
Average Congested Time per PM Peak Period Hour |
5.92 Minutes |
Source: Boston Region MPO Congestion Management Process.
TABLE 4
Regional Performance for Arterials
Performance Measure |
Value |
|---|---|
AM Average Speed |
31.57 mph |
AM Speed Index |
0.86 |
AM Travel Time Index |
1.09 |
PM Average Speed |
31.92 mph |
PM Speed Index |
0.87 |
PM Travel Time Index |
1.07 |
Free Flow Speed |
34.27 mph |
Average Congested Time per AM Peak-Period Hour |
2.95 Minutes |
Average Congested Time per PM Peak-Period Hour |
2.34 Minutes |
Source: Boston Region MPO Congestion Management Process.
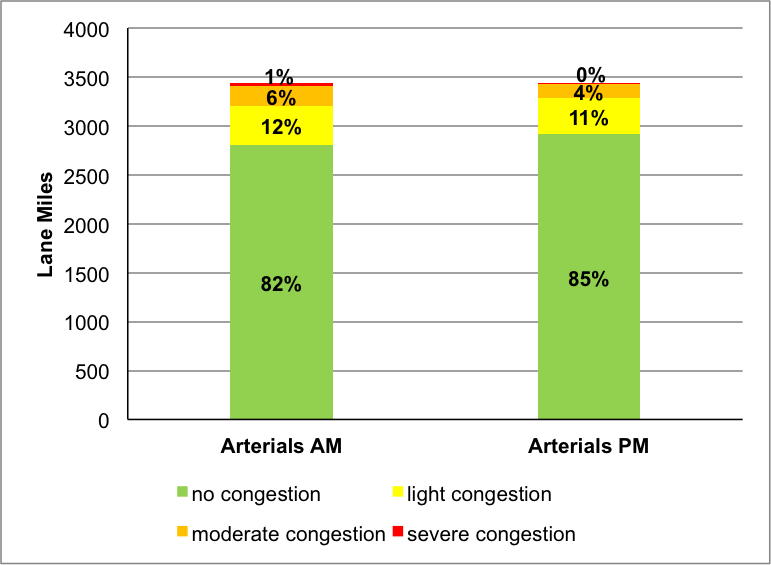
Lane miles of congestion, as measured by travel time index, measure the extent of congestion on the roadway network. This was analyzed for the entire CMP expressway network. Overall, 30 percent of all expressway lane miles in the AM peak period and 32 percent of all expressway lane miles in PM peak period experience congestion to some degree. Lane miles of congestion for the arterials are significantly less, at 18 percent for the AM peak period and 15 percent for the PM peak period.
FIGURE 4
Lane Miles of Congestion: CMP Monitored Expressways
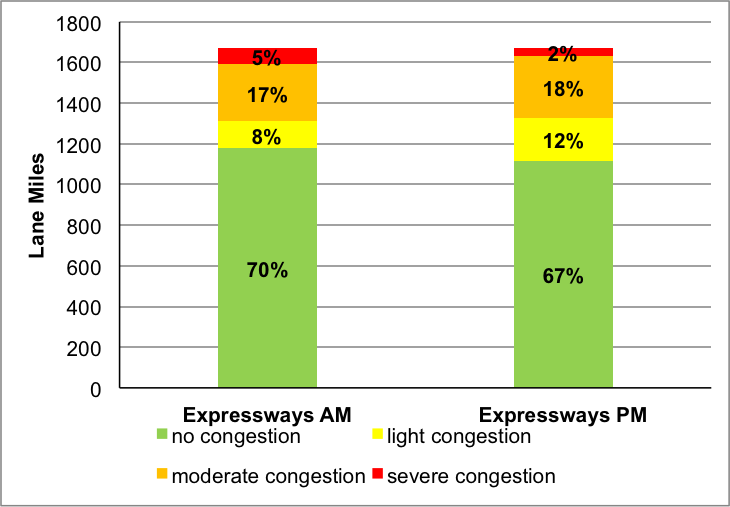
Source: Boston Region MPO Congestion Management Process.
FIGURE 5
Lane Miles of Congestion: CMP Monitored Arterials
Source: Boston Region MPO Congestion Management Process.
Based on this data, the MPO has identified several general trends for the region’s expressways and arterials:
- There are a higher percentage of congested lane miles in the PM peak period; however, a higher percentage of lane miles are severely congested in the AM peak period.
- The intensity of congestion on the regions expressways is more severe in the AM peak period.
- The travel time index is higher for expressways than arterials for both peak periods.
- The average speed indexes for the entire region for both the AM and PM peak periods are lower on arterial roadways than on expressways.
- Congested time is less widespread and less severe on arterials than on expressways.
- The duration, extent, intensity, and reliability of congestion is higher in the AM peak period than in the PM peak period for both expressways and arterials.
- There is a lower percentage of severely congested lane miles on arterials than on expressways, indicating that congestion is less widespread on arterials.
- Applying the performance measures to a regional context generates less extreme congestion values than if these were applied on a roadway segment basis. This is because congestion for both expressways and arterials is concentrated in specific areas. Most roadways in the region experience no peak period congestion at all, and non-congested segments may skew the regional results.
Freight Policy Context
The MPO also must address the transportation system’s ability to move freight efficiently, as this contributes significantly to the region’s economic vitality. The freight transportation system consists of a very large number of enterprises operating many distinct types of equipment over both publicly and privately owned or managed transportation networks. Key components of this system include the public roadway network, the rail system (both the publicly and privately owned sections), and navigable waterways. A number of specialized terminals (both publicly and privately owned) connect and allow freight to transfer between these different systems.
The roadway network is the most important component of the freight transportation system in the Boston Region MPO area. Trucks are the dominant mode for freight movement in this area; and virtually all freight that moves by rail or water requires transshipment to or from trucks in order to serve regional freight customers.
Trucks share the regional roadway network with light vehicles, both commercial and private. Measuring, managing, and reducing delay in the region’s road network is an important defined responsibility of the MPO and is the ongoing work of the MPO’s Congestion Management Process. Freight movements are expected to increase gradually into the foreseeable future in conjunction with population and economic growth. Strategies to affect mode shift in the MPO region are not applicable to freight, since no practical alternatives to trucks exist for final distribution of consumer goods to retail locations, as well as for most industrial logistic needs.
Railroads have been successful in increasing intermodal shipments using high-capacity double-stacked rail services to modern terminals, such as the one in Worcester. These expanded rail services slow the growth of trucks on the national interstate system, but add increasing numbers of trucks to roadways within the MPO. The impacts of larger vessels using an expanded Conley Terminal are similar.
Given the shared use of the road network, it is important that policies and investments that control or reduce congestion improve parts of the network heavily used by trucks. Fortunately, there is a strong correlation between parts of the road network experiencing severe congestion and parts heavily used by trucks.
Transit Policy Context
The MPO region is served by variety of transit services:
- The Massachusetts Bay Transportation Authority (MBTA) - Provides rapid transit, bus and trackless trolley, commuter rail, commuter boat, and paratransit service to a network of 175 municipalities
- The Cape Ann Transportation Authority (CATA) - Provides fixed-route and Dial-a-Ride transit service to the city of Gloucester and the towns of Essex, Rockport, and Ipswich
- The MetroWest Regional Transit Authority (MWRTA) - Provides fixed-route bus service in and between the municipalities of Ashland, Dover, Framingham, Holliston, Hopkinton, Hudson, Marlborough, Natick, Sherborn, Southborough, Sudbury, Wayland, Wellesley, and Weston (also operates paratransit service in Framingham and Natick)
- Several Regional Transit Authorities (RTAs) - Provide service in areas that overlap with communities in the MPO region
- Massachusetts Port Authority (Massport) - Transit services that provide connections to Logan Airport
- Transportation Management Associations (TMAs) - Serve member companies, developments, or institutions, and in some cases, the general public
- Privately Operated Intercity Bus and Ferry Services
- Councils on Aging (COA) - Social-service organizations, private non-profit organizations, and volunteer driver programs; collectively serve a range of clients, including older adults, persons with disabilities, veterans, and others
- MassRIDES - A MassDOT service that provides free statewide travel-options assistance to employers and other travelers. MassRIDES supports an active employer-based partnership program; statewide ride matching; vanpool formation and support program; extensive coordination with 16 regional transit authorities; a statewide, toll-free bilingual customer-service telephone line; and the Massachusetts Safe Routes to School program. Also promotes carpooling and vanpooling through a statewide ride-matching database of more than 15,400 commuters who register for MassRIDES programs and services.
To date, most of the Boston Region MPO’s target funding for capital projects has gone to support the roadway network, bicycle, and pedestrian facilities; with the region’s RTAs, the MassDOT Rail and Transit Division, and others supporting investment in the transit system. The MPO has made some investments in the transit system in recent years through its Suburban Mobility Program, which evolved into the Clean Air and Mobility Program, These programs have allocated Congestion Mitigation Air Quality (CMAQ) funding for starting up new, locally developed and supported transit services that improve air quality and reduce congestion. The MPO also supports the distribution of federal transit grant funds by the Rail and Transit Division.
Like the region’s roadway system, the region’s transit services and networks face reliability and capacity-management concerns. Buses, trackless trolleys, and shuttles operating on roadways are affected by traffic congestion. The size of vehicle fleets, the capacity of individual vehicles, and the condition of vehicles and infrastructure all have an impact on the number of passengers that can be moved and the ability of services to adhere to schedules.
The region’s transit services also should provide connectivity to housing, employment, and other key destinations, as well as to other passenger transportation modes. Table 5 describes the portion of the MPO’s population and employment in 2012 that fell within one-quarter mile of an MBTA, CATA, or MWRTA bus stop or an MBTA rapid transit or commuter rail station, as well as the amount projected to fall within the walkshed in 2040. Modest population gains are expected within this existing walkshed over the next 25 years.
Table 5
Population and Employment within One-quarter Mile of an MBTA, CATA or MWRTA Bus Stop, Rapid Transit Station, or Commuter Rail Station, by MAPC Community Type (2010 and 2040)
MPO Region Population
(2010)MPO Region Employment(2010)
MPO Region Population (2040)
MPO Region Employment
(2040)
Within MBTA, CATA, MWRTA Walkshed
1,756,000
1,292,600
2,115,200
1,418,900
MPO Total
3,162,300
2,028,500
3,732,900
2,209,400
Percent
55.5%
63.7%
56.7%
64.2%
Note: Population and employment results rounded to the nearest hundred.
Source: Central Transportation Planning Staff.
Table 6 describes the portion of the MPO’s 2040 population by area type that is projected to fall within the MBTA, CATA, or MWRTA fixed-route station walkshed; and Table 7 describes the portion of the MPO’s employment by area type that is projected to fall within the walkshed in 2040.
Table 6
Population within One-Quarter Mile of Transit (MBTA, CATA or MWRTA Bus Stop, Rapid Transit Station, or Commuter Rail Station), by MAPC Community Type (2040)
Inner Core CommunitiesRegional Urban Centers
Maturing Suburbs
Developing SuburbsTotal MPO Region
Within Transit Walkshed
1,454,800
392,200
242,000
26,200
2,115,200
MPO Total
1,688,700
651,100
1,029,900
363,300
3,732,900
Percent
86.1%
60.2%
23.5%
7.2%
56.7%
Note: Population and employment results rounded to the nearest hundred.
Source: Central Transportation Planning Staff.
Table 7
Employment within One-Quarter Miles of Transit (MBTA, CATA or MWRTA Bus Stop, Rapid Transit Station, or Commuter Rail Station), by MAPC Community Type (2040)
Inner Core Communities
Regional Urban Centers
Maturing Suburbs
Developing Suburbs
Total MPO RegionWithin Transit Walkshed
1,017,600
210,400
178,500
12,400
1,418,900
MPO Total
1,151,900
340,200
556,200
161,100
2,209,400
Percent
88.3%
61.8%
32.1%
7.7%
64.2%
Note: Population and employment results rounded to the nearest hundred.
Source: Central Transportation Planning Staff.
Tables 6 and 7 show that in 2040 relatively low portions of population and employment in maturing and developing suburbs are projected to fall within the MBTA, CATA, and MWRTA fixed-route walkshed. This suggests that transit services may need to be expanded or diversified in order to increase transit use within these parts of the MPO region.
As part of providing connections to key destinations, transit services and stations should support “last-mile” connections by linking to bicycle and pedestrian routes and shuttle or other services; parking for vehicles and bicycles also should be made available, where appropriate. Transit services should account for the travel needs associated with non-work trips, as well as reverse commutes and other types of trip-making activity. Finally, these services and facilities should account for the needs of a diverse population of riders, which include young people, older adults, and persons with disabilities.
Bicycle and Pedestrian Policy Context
The MPO agrees that bicycle and pedestrian facilities provide opportunities for healthy, environmentally sustainable travel. Federal, state, regional and local initiatives supporting Complete Streets underscore interest in integrating and enhancing the role of these modes in the transportation system. For example, MassDOT issued its Complete Streets design standards and related Healthy Transportation Policy Directive to ensure that MassDOT projects are designed and implemented so that all customers have access to safe and comfortable walking, bicycling, and transit options.
MassDOT also supports the Bay State Greenway (BSG), a seven-corridor network of bicycle routes that comprise both on- and off-road bicycle facilities throughout the state intended to support long-distance bicycle transportation. Approximately 200 miles of this 750-plus mile on- and off-road network have been constructed. MassDOT has identified the “BSG Priority 100,” one-hundred miles of high-priority shared-use path projects within the network.
On-road bike routes, separated paths, sidewalks, and other supporting infrastructure are a key component of the last-mile connections described. When these facilities are integrated into well-connected networks, they support trips both within and between the region’s communities. When they are connected to key destinations, they can support a diversity of trip types, and effective connections between facilities can support longer trips.
Today, approximately three percent of the region’s non-limited-access roadways provide bicycle accommodations—a more-than 50 percent increase since the previous Boston Region MPO LRTP. Tables 8 and 9 below show the portion of the MPO’s population and employment that fell within one-half mile of a bike facility in 2010.
Table 8
MPO-Region Population within One-half Mile of a Bike Facility (2010)
MPO Population
Inner Core Communities
Regional Urban Centers
Maturing Suburbs
Developing Suburbs
Total MPO Region
Within One-Half Mile of Bike Facility
1,120,900
105,100
189,500
22,700
1,438,100
Total
1,391,300
545,300
900,500
325,100
3,162,300
Percent
80.6%
19.3%
21.0%
7.0%
45.5%
Note: Population and employment results rounded to the nearest hundred. Interstates and access controlled roads excluded from analysis.
Source: Central Transportation Planning Staff.
Table 9
MPO-Region Employment within One-half Mile of a Bike Facility (2010)
MPO Employment
Inner Core Communities
Regional Urban Centers
Maturing Suburbs
Developing Suburbs
Total MPO Region
Within One-Half Mile of Bike Facility
843,300
51,200
129,800
10,800
1,035,100
MPO Total
1,048,600
313,600
514,600
151,700
2,028,500
Percent
80.4%
16.3%
25.2%
7.1%
51.0%
Note: Population and employment results rounded to the nearest hundred. Interstates and access controlled roads excluded from analysis.
Source: Central Transportation Planning Staff.
As the tables above show, the proportion of MPO employment that fell within one-half mile of a bicycle facility in 2010 was larger than the portion of MPO population that was within one-half mile of a bicycle facility. As of 2010, approximately 80 percent of population and employment in Inner Core Communities was located within one-half mile of a bicycle facility. In comparison, much lower shares of population and employment are within one-half mile of bicycle facilities in communities characterized as regional urban centers, maturing suburbs, and developing suburbs.
The MPO has analyzed patterns of regional bicycling activity using data from the 2011 Massachusetts Travel Survey. Table 10 shows the miles traveled per 1,000 residents for communities in the Boston Region, by Metropolitan Area Planning Council (MAPC) community type.
Table 10
Miles by Bicycle per 1,000 Residents for Communities in the Boston MPO Region, by MAPC Community Type (2011)
Total Distance
Between Home and Work
Other Travel
Inner Core Communities
184
100
84
Maturing Suburbs
57
19
38
Regional Centers
21
6
15
Developing Suburbs
32
7
25
Source: Massachusetts Travel Survey, 2011.
Bicycling, including for trips to work is highest in Boston’s inner core communities, followed by its maturing suburbs. These bicycling activity levels are correlated with the portions of population and employment within one-half mile of a bicycling facility in each of the MAPC community types, as shown in tables 5 and 6 above. The MPO’s capacity management and mobility objectives include an objective to increase the percentage of population and places of employment with access to bicycle facilities. The greatest potential for these increases exists in the maturing suburbs, regional urban centers, and developing suburbs in the Boston region, and by increasing bicycle network connectivity to key destinations in these areas, there may be growth in bicycling activity.
4.2 Regional Needs
Roadway Reliability Needs
MPO activities and investments to increase reliability on the roadway network benefit both freight and non-freight road users. The MPO has identified a priority set of congested locations on the region’s expressways and arterials using four measures: speed index, travel time index, volume-to-capacity ratio, and crash history. Each corridor was given a weighted score depending on the number of performance measures that indicated congestion. Below is a list of arterial corridors along with their corresponding LRTP needs assessment corridor.
Expressway Corridors
- I-93 between I-95 in Woburn and the Leverett Connector
- I-93 between the Braintree Split and the Massachusetts Ave. Interchange
- US 1 between Route 60 in Revere and Route 99 in Saugus
- Route 128 at Lowell Street, Exit 26, in Peabody
- I-90 between Interchanges 16 and 17 in Newton
- I-95 between I-93 in Woburn and US 1 in Lynnfield
Arterial Corridors
- Rte. 1 Westwood to Sharon – Southwest
- Rte. 138 (Canton) – Southwest
- Rte. 1A from Salem to Revere – Northeast
- Rte. 107 Western Ave. at Route 129 Washington St. (Lynn) – Northeast
- Rte. 114 (Peabody, Salem) – Northeast
- Rte. 1A (Revere) – Northeast/Central
- Rte. 2 Bypass Rd./Cambridge Turnpike-Piper Road/Taylor Rd. (Concord, Acton) – Northwest
- Rte. 60 from Rte. 2 to Rte. 2A and Medford St. (Arlington) – Northwest
- Rte. 62 Main Street in Concord between Elm St. and Rte. 2 – Northwest
- Rtes. 62, 225 and 4 corridor (Bedford, Lexington) – Northwest
- Rte. 16 Fresh Pond Parkway and Alewife Brook Parkway – Northwest/Central
- Memorial Drive (Cambridge) – Northwest/Central
- Rte. 3A Marshfield to Quincy – Southeast
- Rte. 18 (Weymouth) – Southeast
- Rte. 28 Milton to Randolph – Southeast
- Rte. 138 (Milton) – Southeast
- Rte. 9 Southborough to Newton – West
- Rte. 16 Holliston to Newton – West
- Rte. 20 (Weston) – West
- Rte. 30 between I-90 and Rte. 9 (Framingham) – West
- Rte. 135 Wellesley to Natick – West
- Rte. 16 Mystic Valley Parkway and Revere Beach Parkway – North/Central
- Rte. 99 Broadway (Everett) – North/Central
- Rte. 129 Wilmington to Reading – North
As discussed above, work on these priority expressways and arterials should consider the transportation needs of passengers and freight, as well as ways to accommodate transit, bicycling and walking.
Transit Reliability Needs
The MBTA Scorecard reports on various performance measures for the bus system as a whole, for individual rapid transit lines, for the commuter rail system as a whole, and for individual commuter rail lines. An analysis of monthly scorecards for 2013 reveals that:
- Overall, bus vehicle availability, scheduled bus trips operated, and mean miles between failures for bus fleet goals were met or exceeded. However, according to the 2012 Service Policy Standards (revisited every two years), only 7.6% of all bus routes passed the service-adherence standard.
- The Orange Line did not meet the 95 percent on-time performance goal during any month of the year.
- The commuter rail system overall did not meet the on-time performance goal of 95%.
- On individual lines, only the Fairmount, Greenbush, Middleborough/Lakeville, and Kingston/Plymouth Lines had on-time performance rates greater than 95 percent goal.
- The commuter rail system did not meet the locomotive mean miles between failures goal.
Transit Capacity Needs
As mentioned above, the majority of transit capacity and expansion needs are funded by federal agencies, MassDOT, the region’s RTAs, and other entities. A number of major infrastructure constraints on the MBTA system limit capacity and hinder the agency’s ability to expand the system in the future. Most of these constraints are mentioned in Paths to A Sustainable Region, the previous LRTP, which include, but are not limited to, the following:
- Additional tracks are needed at South Station to accommodate any growth in service on south-side commuter rail lines. MassDOT currently has plans to expand Boston’s South Station terminal capacity, and related layover capacity, to meet current and future high-speed, intercity, and commuter rail service needs. MassDOT has received $32.5 million from the Federal Railroad Administration for expansion planning and environmental review of South Station.
- The capacity of the Haverhill, Fitchburg, Franklin, Stoughton, Needham, and Old Colony Lines is constrained by sections of single track.
- The Green Line’s central subway tunnel currently is operating at capacity.
- The Orange Line currently is overcrowded during peak hours between Downtown Crossing and North Station.
- Systemwide, 20 percent of park-and-ride lots associated with transit stations (MBTA and public or private lots that provide transit parking) are utilized at 85 percent of their capacity, or greater. Of these facilities, 62 percent are commuter rail, 31 percent are rapid transit, and seven percent serve both rapid transit and commuter rail.
A recent analysis of the MBTA’s current Program for Mass Transportation (PMT) identified several locations and facilities with transit needs. These include, but are not limited to the following:
- Analysis indicates that numerous communities around the region will experience high growth in intercity trips by 2030. These include:
- Peabody, Beverly, Salem
- Acton, Concord, and Westford
- Framingham, Marlborough, and Natick (communities served by the MWRTA)
- Needham and Wellesley (The MWRTA provides some service to Wellesley)
- Stoughton, Canton, Norwood, Walpole
- Lynn
- A great number of MBTA bus routes need additional service or larger, articulated vehicles, either to overcome periods of crowding or on a regular basis.
- There are opportunities to establish additional crosstown routes to provide quicker and more direct connections for crosstown travel. Relatedly, there are strong activity centers in adjacent radial corridors that are not currently connected by transit.
- Malden and Weymouth are expected to experience high growth in intra-city trips; however, current transit mode shares are extremely low.
- Everett, which is densely populated, lacks a direct public transit connection to downtown Boston.
In addition, the MBTA will provide the MPO with a list of capacity and mobility improvement projects once the MBTA’s Capital Investment Program document is released for public review.
MPO staff has also identified several transit capacity and service needs through public outreach:
- There is an interest in exploring improvements to bus transit, such as bus prioritization, and dedicated lanes.
- Suburban transit service should be expanded in suburban areas throughout the region.
Transit Connectivity Needs
Transit connectivity includes connections to other modes at stations or stops, as well as broader connectivity to employment, housing, and other key destinations. Multi-modal connections at stations and stops take into account parking availability and bicycle and pedestrian links. MPO staff analyzed patterns of parking utilization on the MBTA system to determine which park-and-ride lots and bicycle facilities were congested. Any parking lot or bicycle facility that is more than 85 percent utilized is considered congested; these facilities are listed below:
Park and Ride Lots at More than 85-Percent Utilization
- Swampscott – Newburyport/Rockport Line
- Beverly Depot – Newburyport/Rockport Line
- Manchester – Newburyport/Rockport Line
- North Wilmington – Haverhill Line
- Wilmington – Lowell Line
- Wedgemere – Lowell Line
- West Medford – Lowell Line
- South Acton – Fitchburg Line
- Kendal Green – Fitchburg Line
- Waltham – Fitchburg Line
- West Natick – Worcester Line
- Wellesley Square – Worcester Line
- Wellesley Hills – Worcester Line
- Needham Junction – Needham Line
- Franklin – Franklin Line
- Plimptonville – Franklin Line
- Endicott – Franklin Line
- Providence – Providence Line
- South Attleboro – Providence Line
- Mansfield – Providence Line
- Maverick – Blue Line
- Oak Grove – Orange Line
- Forest Hills – Orange Line
- Savin Hill – Red Line
- Milton – Red Line
- Wollaston – Red Line
- Braintree – Red Line
- Lechmere – Green Line
- Waban – Green Line
- Eliot – Green Line
- Chestnut Hill – Green Line
Bicycle Parking at MBTA Stations at More than 85-Percent Utilization
- West Concord – Fitchburg CR Line
- Natick – Worcester CR Line
- Providence – Providence CR Line
- Whitman – Old Colony CR Line
- Alewife – Red Line
- Kendall/MIT – Red Line
- Downtown Crossing – Red Line
- North Quincy – Red Line
- Wollaston – Red Line
- Sullivan Square – Orange Line
- Chinatown – Orange Line
- BU Central – Red Line
- Hynes – Green Line
- Brookline Hills – Green Line
- Newton Centre – Green Line
- Chestnut Hill – Green Line
- Longwood Medical Center – Green Line
MPO staff has also identified needs related to bicycle and pedestrian connections at stations:
- Bicycle station access, such as at the recently opened Assembly Orange Line station, should be implemented wherever possible throughout the rapid transit system.
- Bicycle access to other north-side Orange Line stations, the Blue Line, and southern parts of the Red Line is inadequate.
- Most commuter rail stations outside the Inner Core communities have been designed to facilitate access by auto. Pedestrian and bicycle access to these stations should be improved wherever feasible.
- Pedestrian station access has been improved as part of the Blue Line stations’ reconstruction.
- Additional opportunities exist to improve pedestrian access to rapid transit, especially to the north-side Orange Line stations, and southern parts of the Red Line.
MPO staff has identified several transit connectivity needs—both to transit facilities and destinations throughout the region—through reviews of the Program for Mass Transportation, and other public outreach and analysis:
- At Alewife Station, traffic congestion reduces reliability of bus routes and increases running times.
- There are opportunities to establish additional crosstown routes to provide quicker and more direct connections for crosstown travel. Relatedly, there are strong activity centers in adjacent radial corridors that are not currently connected by transit.
- Many communities are interested in improved links to existing transit service. These include park-and-rides, transit station parking, shuttle services, and other facilities and services that support last-mile connections.
- There is interest in improving connections between the region’s RTAs.
Bicycle and Pedestrian Network Connectivity Needs
In 2014, MPO staff completed its Bicycle Network Evaluation, which assessed gaps in the MPO’s existing bicycle network according to how well connections in these areas would support bicycle connectivity and maximize safe access throughout the region. A steering committee of bicycle representatives from MassDOT and MAPC guided this project, and advocacy groups and bicycling stakeholders in the region provided input. Staff evaluated more than 230 gaps, of which they identified eleven top priorities.
- Waltham - Central Massachusetts Rail Trail
- Framingham/Ashland/Sherborn - Upper Charles Trail
- Framingham - Sudbury Aqueduct Trail
- Somerville - Community Path/Green Line Extension
- Boston - Dorchester Corridors
- Boston - Boston University Bridge to Emerald Necklace
- Boston - Charlesgate
- Arlington - Minuteman to Mystic Valley
- Cambridge - Central Square
- Chelsea - Commuter Rail to East Boston Greenway
- Salem - Canal Street Bikeway
Progress on these identified needs varies by gap. For example, some still need further planning and design, others have right-of-way or land-ownership challenges, yet others are proposed for funding. In addition, as part of the Bicycle Network Evaluation, MPO staff noted that there are areas within the region, such as the Three Rivers Interlocal Council and South Shore Coalition subregions, with so few bicycle facilities (on-road lanes, protected lanes, or off-road paths) that they did not meet the definitions for gaps in the study. Staff recommended that existing desire lines for facilities in these areas be considered in subsequent evaluations.
In addition to the priority connections identified through the Bicycle Network Evaluation, several BSG 100 priority corridor projects are within the MPO region:
- MassCentral corridor – Wayside Trail (includes Hudson, Sudbury, Waltham, Wayland, Weston)
- Merrimack-Charles River corridor – Bruce Freeman Rail Trail Extension (Acton, Carlisle, Concord)
- Merrimack Charles River corridor – Reformatory Branch Trail (includes Bedford)
- Merrimack Charles River corridor – Community Path Extension (includes Somerville)
- Boston Cape Cod corridor – Neponset River Greenway Phase 2 (includes Boston, Milton)
- North Shore corridor – Border to Boston (North and South) (includes Danvers, Topsfield, Wenham)
- North Shore corridor – Northern Strand Community Trail (includes Everett, Lynn, Malden, Revere, Saugus)
Progress has been made on a number of these projects; several have been proposed for TIP funding, and some are being advanced by other entities.
Through outreach and analysis, MPO staff has identified additional needs related to bicycle and pedestrian connectivity, and which address a combination of specific locations and broader themes:
- Bicycles approaching Boston via the northwest, west, and southwest corridors can use existing bicycle facilities, notably the Minuteman Bike Trail, the Charles River Basin paths, and the Southwest Corridor linear park. Comparable facilities do not exist for bicycles approaching from the northeast, north, or southeast.
- Communities are interested in improving bicycle connectivity throughout the region, including enhancements to the existing system and circumferential routes.
- Inadequate snow removal from sidewalks reduces mobility, especially for older people and those with mobility impairments.
- Only 52 percent of the region’s non-limited-access roadways have a sidewalk on at least one side of the street. Within the Inner Core communities, 87 percent of streets have a sidewalk; outside the Inner Core, this drops to 45 percent. Many communities are interested in increasing local walkability. The completion of local sidewalk systems, preferably on both sides of the street, should be a long-range goal.
4.3 Potential Programs to Address Capacity Management and Mobility Needs
- Intersection Improvement Program – Can reduce congestion, which would improve mobility and reduce emissions; can include Complete Streets elements that would improve mobility for bicyclists, and mobility and accessibility for pedestrians.
- Complete Streets Program – Can increase transportation options by adding new sidewalks and bicycle facilities.
- Bottleneck Program – Can reduce congestion and would improve mobility. The identified congested expressway and arterial locations should be prioritized.
- Interchange Modernization Program – Can reduce congestion and would improve mobility.
- Bicycle Network Program – Can increase transportation options, provide access to transit or other activity centers, and support last-mile connections.
- Pedestrian Connections Program – Can increase transportation options, provide access to transit or other activity centers, and support last-mile connections.
- Major Infrastructure – Project specific, but potentially could increase transportation options.
- Park-and-Ride and Bicycle Parking Programs – Can increase transit ridership by expanding automobile and bicycle parking at commuter rail and rapid transit stations.
- Clean Air and Mobility/Community Transportation Program – Can provide funding for starting up new, locally developed transit services and support last-mile connections; provide transit vehicles and coordination to serve environmental justice (EJ) populations in suburban areas.
5 Clean Air and Clean Communities
5.1 Background
The Boston Region MPO agrees that greenhouse gas emissions (GHGs) contribute to climate change. If climate trends continue as projected, the conditions in the Boston region will include a rise in sea level coupled with storm-induced flooding, and warmer temperatures that would impact the region’s infrastructure, economy, human health, and natural resources. Massachusetts is responding to this challenge by taking action to reduce the GHGs produced by the state, including those generated by the transportation sector. To that end, Massachusetts passed its Global Warming Solutions Act, which requires reductions of GHGs by 2020, and further reductions by 2050, relative to 1990 baseline conditions. Understanding that reducing the use of single-occupant vehicles also would scale back production of GHGs and other pollutants, Massachusetts has a goal of tripling the share of travel in Massachusetts by bicycling, using transit and walking by 2030.
In addition, the MPO analyzes and monitors the presence of other air quality pollutants—volatile organic compounds (VOC), nitrogen oxides (NOx), carbon monoxide (CO), and particulate matter (PM2.5 and PM10) from transportation in the region. The MPO region was classified as attainment for ozone (formed from VOC and NOx emissions) in 2012. The Boston Region MPO is in attainment with the PM standards, but remains in maintenance for CO.
Contributing to this improved air quality status is the MPO’s attention to accomplishing the State Implementation Plan Commitments from the Central Artery/Third Harbor Tunnel project, and other measures and projects funded in the LRTP and TIP to reduce congestion and improve transit and active modes of transportation. Although the MPO area is in attainment and maintenance for these specific air quality standards, its goal is to continue to reduce emissions of these pollutants.
In addition to air quality, the MPO considers other environmental impacts that stem from transportation projects, including areas of critical environmental concern, special flood hazard areas, wetlands, water supply, protected open space, endangered species, and brownfield and superfund sites. Impacts to these resources are factored into project evaluations through the MPO’s evaluation criteria.
5.2 Regional Needs
The MPO’s policy is to address climate change, reduce air pollution, and avoid harmful effects to the environment. The MPO should continue monitoring the estimated or projected levels of pollutants (VOC, NOx, CO, PM, and CO2). It should use this information to guide planning and programming in its LRTP, TIP, studies or individual projects outlined in the UPWP, and project work for various transportation agencies. In both the LRTP and TIP project-selection processes, the MPO reviews and rates projects on how well they meet criteria established to protect the environment.
Many of the objectives established under the goals of Capacity Management and Mobility will help the MPO to meet the Clean Air and Clean Communities goal in the future. It encourages programs that would help reduce vehicle-miles of travel (VMT), which in turn would help reduce emissions of VOC, NOx, CO, CO2, and PM.
Environmental impacts of projects will continue to be reviewed at the individual project level as they are submitted for funding consideration in the LRTP and TIP. A qualitative evaluation is done for projects in the conceptual design phase using the MPO’s All-Hazards Planning Application. A more detailed evaluation is possible for projects that are further along in design.
5.3 Potential Programs to Address Clean Air and Clean Community Needs
- Intersection Improvement Program – Can reduce emissions as a result of improved operations for all vehicles, and through mode shift; accompanied by improvements in transit reliability, and bicycle and pedestrian infrastructure
- Complete Streets – Bicycle and pedestrian infrastructure improvements can help to reduce VMT through improved operations and mode shift
- Bottleneck Program – Improved operations and traffic flow help to reduce emissions.
- Bicycle Program – Bicycle infrastructure improvements can help to reduce VMT through mode shift.
- Pedestrian Program – Pedestrian infrastructure improvements can help to reduce VMT through mode shift.
- Major Infrastructure – Would include projects to expand transit usage.
6 Transportation equity
6.1 Background
The MPO’s Transportation Equity goal is to provide comparable transportation access and service quality among communities regardless of income level or minority status. To accomplish this, the MPO will target investments to areas that benefit a high percentage of low-income and minority populations, minimize any burdens associated with MPO-funded projects in low-income and minority areas, and break down barriers to participation in MPO decision making.
6.2 Regional Needs
The MPO ascertains the transportation needs of people in environmental-justice areas in a number of ways. Staff posts a needs survey on the MPO’s website; the MPO conducts forums and meetings to solicit input; staff attend various meetings where needs and transportation gaps are discussed; and staff keep current on reports and studies that identify these needs. Identified needs generally fall into several categories, including:
- Transit service improvements
- Transit and roadway infrastructure improvements
- Improved intermodal connections
- Coordination of various services
The MPO addresses regional transportation equity needs through TIP evaluation criteria, where projects that address a transportation issue in an environmental-justice neighborhood can score points. MPO staff give positive ratings to projects that could benefit environmental-justice areas, and negative ratings to projects that might burden these areas. This scoring system gives projects that address transportation equity issues an advantage, as the MPO considers these ratings when deciding what projects should be funded in the LRTP or TIP.
6.3 Potential Programs to Address Transportation Equity Needs
- Intersection Improvement Program – Improved intersections can enhance transit services and can provide better and more bicycle and pedestrian connections, including those provided by a Complete Streets Program.
- Complete Streets – Can provide better transit access, improved pedestrian, bicycle infrastructure, and can help increase access to transit.
- Major Infrastructure – Transit: Can improve availability of transit options and accessibility to important destinations. Highway: Can improve mobility for transit vehicles in some instances, and automobile travel.
- Clean Air and Mobility/Community Transportation Program – Can provide funding for starting up new, locally developed transit services; includes transit vehicles and coordination of service to EJ populations in suburban areas.
7 Economic Vitality
7.1 Background
Land use decisions and many economic development decisions in Massachusetts are controlled directly by local municipalities through zoning—as guided by a significant body of laws and regulations enacted by the state legislature. At the regional level, MAPC is the regional planning agency that represents the 101 cities and towns in the metropolitan Boston area and the Boston Region MPO. The MPO relies on MAPC to develop the region’s population and employment projections for use in transportation planning. MAPC also coordinates and consults with the region’s municipalities regarding these projections, and reviews and evaluates land use and economic-development plans and their relationship to MPO planning.
MAPC created MetroFuture, a plan to make a “greater” Boston region—to better the lives of the people who live and work in metropolitan Boston, now and in the future. The MPO adopted this plan as its land use plan for the Boston Region MPO area. One of MetroFuture’s implementation strategies is to focus on economic growth, and coordinate transportation investments to guide economic growth in the region.
7.2 Regional Needs
MassDOT, the Massachusetts Executive Office of Housing and Economic Development (EOHED), and the Massachusetts Executive Office of Energy and Environmental Affairs (EOEEA) joined together to highlight their common strategy and commitment to the Commonwealth’s sustainable development and the “Planning Ahead for Growth” strategy. This strategy calls for identification of priority areas where growth and preservation should occur.
MAPC worked with EOHED and the EOEEA to develop a process to identify local, regional, and state-level priority development and preservation areas in municipalities within the MPO area. MAPC staff worked with municipalities and state partners to identify locations throughout the region that are principal supporters of additional housing, employment growth, creation and preservation of open space, and the infrastructure improvements required to support these outcomes for each location. This process identified locations that are best suited to support the type of continued economic vitality and future growth that the market demands, and which communities desire. Identifying these key growth and preservation locations also helps MAPC, the Boston Region MPO, and state agencies to understand both the infrastructure and technical assistance needs better, in order to help them prioritize the limited regional and state funding.
Priority plans were developed for the following areas:
- Metro North – Includes the municipalities of Chelsea, Everett, Malden, Medford, Melrose, Revere, and Somerville, Winthrop, and the neighborhoods of East Boston and Charlestown in the City of Boston.
- MetroWest – Includes the municipalities of Acton, Ashland, Bellingham, Berlin, Bolton, Boxborough, Framingham, Franklin, Holliston, Hopkinton, Hudson, Littleton, Marlborough, Maynard, Medway, Milford, Millis, Natick, Norfolk, Sherborn, Southborough, Stow, Sudbury, Wayland, and Wrentham.
- North Suburban Planning Council – Includes the municipalities of Burlington, North Reading, Reading, Stoneham, Wakefield, Wilmington, Winchester, and Woburn.
- North Shore Task Force – Includes the municipalities of Beverly, Danvers, Hamilton, Ipswich, Salem, and Wenham.
- South Coast Rail – Includes the municipalities of Canton, Mansfield, Sharon, and Stoughton.
Economic development effects will be considered at the individual project level as projects are submitted for funding in the LRTP and TIP. Projects will be evaluated based on their proximity to the priority development areas and how well the transportation project or program would address existing and proposed economic development needs in the area.
7.3 Potential Programs to Address Economic Vitality Needs
- Intersection Improvement Program – Can reduce congestion, which would improve mobility and access to centers of economic activity; and can include Complete Streets elements that will improve mobility for bicyclists and mobility and accessibility for pedestrians.
- Complete Streets Program – Can increase transportation options and access to places of employment by adding new sidewalks and bicycle facilities.
- Bottleneck Program – Can reduce congestion and improve mobility for all vehicles. The identified congested expressway and arterial locations should be prioritized.
- Interchange Modernization Program – Can reduce congestion, which will improve mobility, potentially for all modes.
- Major Infrastructure – Highway: Can increase mobility for all modes and address access to existing centers of economic activity and services. Transit: Can provide access to existing centers of economic activity and services.
ASM/ASM/asm
1 The MPO conducted a series of forums, subregional meetings, and an on-line survey to solicit input from the public about the region’s transportation needs; and gathered feedback through the website and email address, publicinformation@ctps.org.
2 The morning peak period is from 6:00 AM to 10:00 AM, and the evening peak period is from 3:00 PM to 7:00 PM.