Technical Memorandum
DATE: December 3, 2015
TO: Boston Region Metropolitan Planning Organization (MPO)
FROM: Seth Asante, MPO Staff
RE: Low-Cost Improvements to Express-Highway Bottleneck Locations
This memorandum summarizes the results of the analyses and improvement alternatives resulting from the Low-Cost Improvements to Express-Highway Bottleneck Locations study. The opening sections provide background information and describe the purpose of the study. The selection of study locations and an assessment of the safety and operational problems, as well as a discussion of the potential improvement strategies, follow the background sections. The memorandum’s final section presents study recommendations. Also included are technical appendices, which cite the study methods and how the data were applied, including detailed reports about the freeway merge and diverge analyses. If implemented, the report’s recommendations would result in improved freeway facilities; they would increase traffic safety, make traffic operations more efficient, and reduce congestion at the bottlenecks.
According to the Federal Highway Administration (FHWA), “Much of recurring congestion is due to physical bottlenecks—potentially correctible points on the highway system where traffic flow is restricted. While many of the nation’s bottlenecks can only be addressed through costly major construction projects, there is a significant opportunity for the application of operational and low-cost infrastructure solutions to bring about relief at these chokepoints.”1 In general, recurring bottlenecks, the subject of this study, are influenced by the design or operation present at the point where the bottleneck begins (e.g., merges, diverges, lane drops, traffic weaving, and abrupt changes in highway alignment).
Previously, Boston Region Metropolitan Planning Organization (MPO) staff analyzed several express-highway bottleneck locations in two consecutive studies, Low-Cost Improvements to Bottlenecks Phase I and Phase II, which were very well received by the Massachusetts Department of Transportation (MassDOT) and the FHWA.2,3 Some of the recommendations from those studies already have been executed, and the FHWA has interviewed MPO staff about the successful implementation. The MPO has been conducting these studies to identify low-cost methods to reduce congestion, increase safety, and improve traffic operations in the Boston Region.
The purpose of this study is twofold:
The selection of study locations was a two-stage process that included the inventorying and screening of candidate locations.4 MPO staff developed an initial list of candidate locations in the MPO region based on the following parameters:
The inventory process yielded five bottleneck locations for screening:
MPO staff used the following three criteria to screen the bottleneck locations.
After consulting with MassDOT Highway Division staff, MPO staff selected Locations 1 and 2 for study. The study locations were also presented to the Boston Region MPO for discussions and approval. Through the selection process, MPO staff determined that these two locations likely could be corrected with low-cost mitigation strategies, whereas the other bottleneck locations likely could not be corrected in a low-cost manner. Appendix A contains comments about the study from the MassDOT Highway Division and a memorandum to the MPO that describes the selection process in detail.
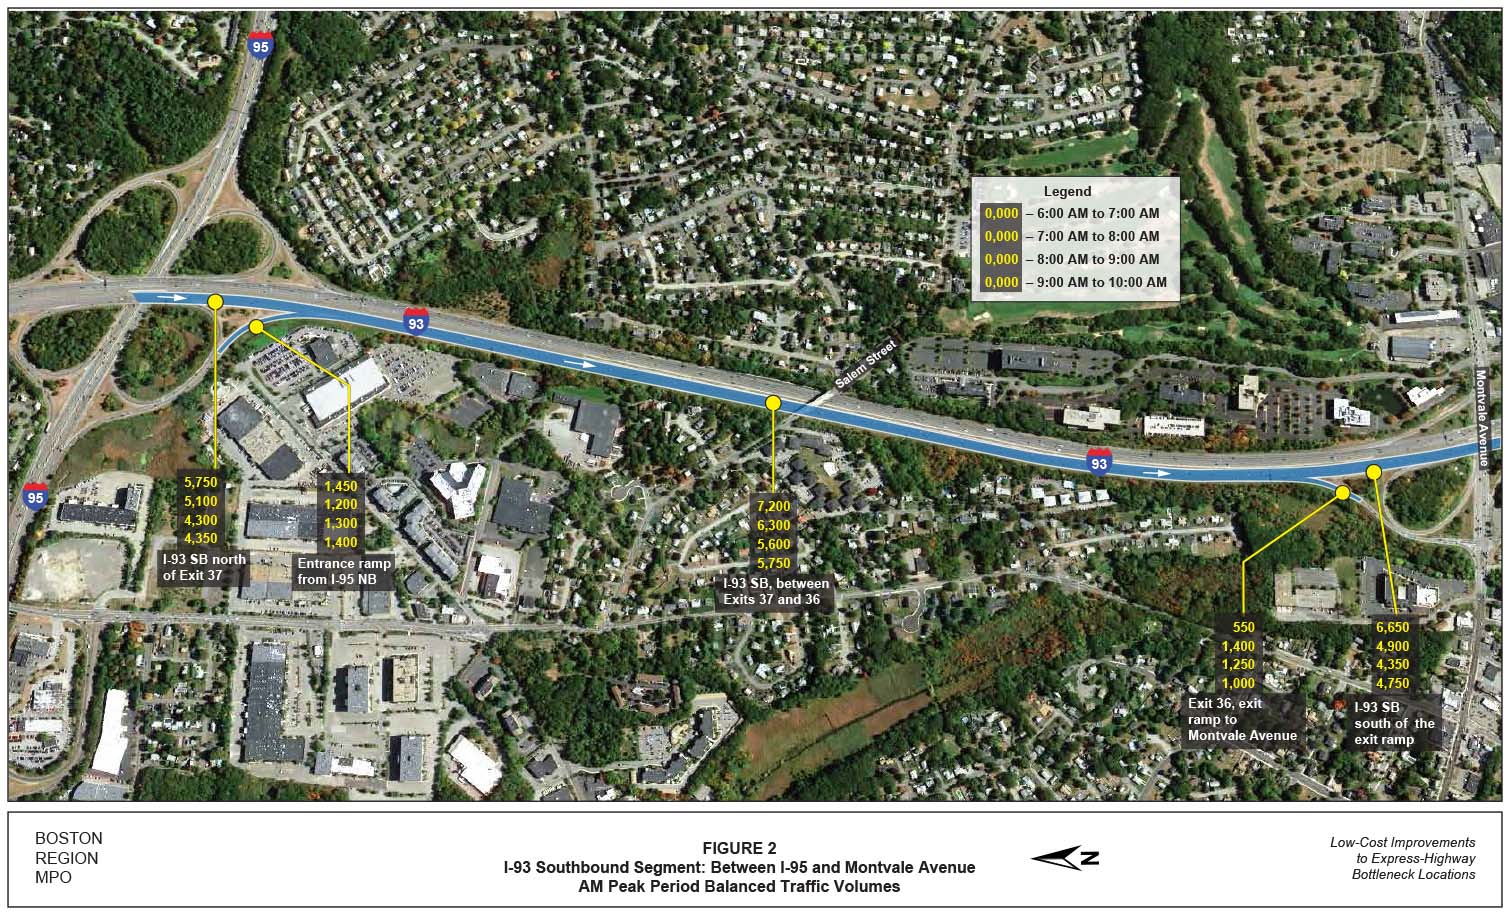
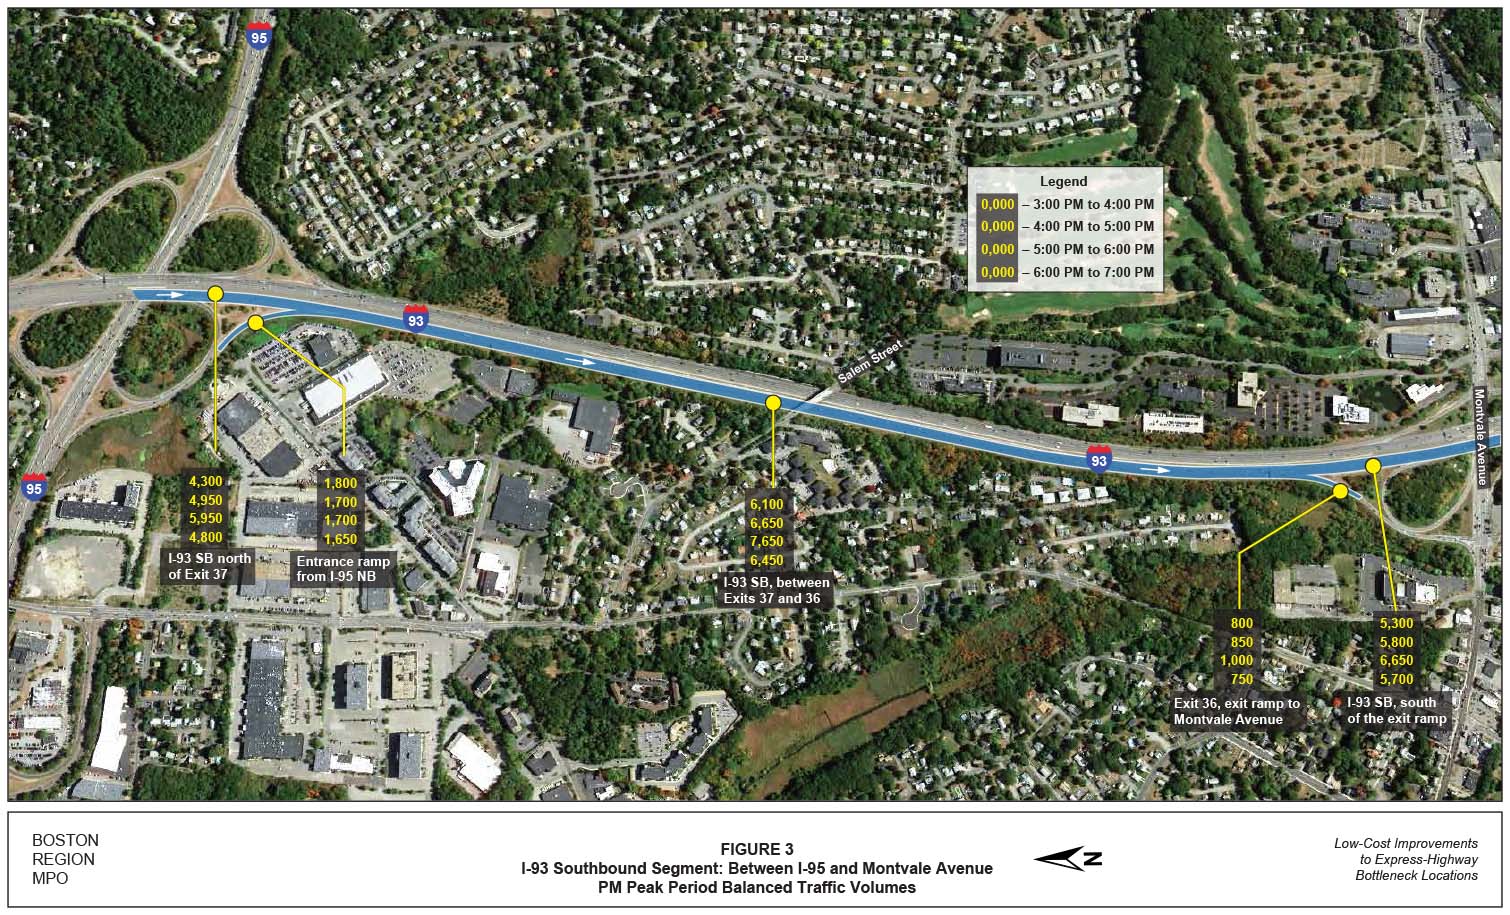
This section of highway is frequently congested because of merging and diverging activities, and also because of inadequate length of the deceleration lane to Montvale Avenue. During peak periods, I-93 southbound carries as many as 7,700 vehicles per hour, the on-ramp from I-95 northbound carries as many as 1,800 vehicles per hour, and as many as 1,400 vehicles per hour exit to Montvale Avenue at Exit 36. The merging and diverging activities of these vehicles slow down I-93 southbound mainline traffic upstream of the Montvale Avenue interchange and cause many crashes near the diverge to Montvale Avenue. Section 6 of this memorandum contains a detailed description of the bottleneck, including the problems, causes, impacts, improvement alternatives, and recommendations.
This bottleneck is located on I-95 southbound at the point where traffic from I-90 and Route 30 merges onto I-95. During peak periods, between 2,300 and 2,900 vehicles per hour exit I-95 southbound to I-90 and Route 30. Farther downstream, between 2,000 and 2,400 vehicles per hour enter I-95 southbound from the same roads. However, the four I-95 southbound lanes in that section are not allocated efficiently to serve demand. As a result, during peak periods, a long traffic queue forms on the I-90 connector ramp heading southbound on I-95. Section 7 of this memorandum contains a detailed description of the bottleneck, including the problems, causes, impacts, improvement alternatives, and recommendations.
MPO staff did not select Locations 3, 4, and 5 for study. The reasons are described below.
This section of highway is frequently congested because of a lane drop and intensive merging and diverging activities, especially during the AM peak period. During that period, the on-ramp carries between 1,300 and 1,700 vehicles per hour in an auxiliary lane; the off-ramp to Leverett Circle, Exit 26, carries between 1,200 and 1,600 vehicles per hour.5 The merging and diverging activities of these vehicles slow down mainline traffic and seriously affect traffic on the upstream section of I-93. The distance between the two ramps is about 2,000 feet long. The reasons for not selecting this location for study include:
This rotary, the intersection of Concord Turnpike (Route 2), Commonwealth Avenue, Barretts Mill Road, and Great Road (Route 119), is frequently congested because of high traffic volume and inadequate capacity during peak periods. The rotary is a challenge to navigate during these periods, and drivers often use local streets to avoid congestion. The MassDOT Highway Division is planning to replace the rotary with an overpass for safer and more efficient operation, and to minimize environmental impacts. The Highway Division also is exploring opportunities to improve neighborhood connections, incorporate the Bruce Freeman Rail Trail and wildlife corridors, improve water and air quality, and enhance the area’s design aesthetics to the extent possible. Although this site is a major bottleneck, staff did not select this location for study because
This section of highway frequently is congested because of a lane drop and intensive merging and diverging activities, especially during the PM peak period, which slows down mainline traffic. During peak hours, the Exit 37 off-ramps carry as many as 3,200 vehicles per hour, and the Exit 37 on-ramps carry as many as 2,300 vehicles per hour.8 Adding an auxiliary lane northbound on I-95 would provide more room for the merging and diverging activities and reduce disturbance to mainline traffic. Staff did not select this location for study because an auxiliary lane would need to be extended for a long distance (about three or four interchanges downstream) to reduce congestion and the queue, which could be expensive. In addition, the I-93 and I-95 Interchange project in Reading, Stoneham, and Woburn would address this bottleneck; currently this project is on hold.
The MassDOT Highway Division’s Traffic Data Collection Program conducted automatic traffic recorder (ATR) counts for the ramps and freeways at the locations selected for study. The ATR counts are continuous traffic counts for at least 48 hours that are used to determine the average weekday daily traffic of a highway. For Location 1, MPO staff used ATR counts from the MassDOT Highway Division’s traffic count database that were conducted in April 2014 and January 2015. For Location 2, MPO staff used actual ATR counts that were conducted in April 2015 for the four I-95 southbound ramps. The ATR count data are included in Appendix B.
MPO staff used crash data from January 2010 through December 2012 from the MassDOT’s Registry of Motor Vehicles database to evaluate safety for motorists. Crash data are included in Appendix C.
MPO staff used speed data from spring 2012 and fall 2012 from the MPO’s CMP. The CMP maintains average speed data on express-highway systems in the MPO region with use of the INRIX historical traffic speed data archive of real-time traffic.
The Highway Capacity Manual (HCM) methodology demonstrates driving conditions on freeways in terms of level-of-service (LOS) ratings from A through F.9 The LOS criteria characterize freeway performance measures in terms of density (passenger cars per mile per lane, [pc/mi/ln]). Table 1 shows the LOS criteria for basic freeway and ramp merge/diverge and weaving segments. LOS A represents the best operating conditions (unrestricted operations), while LOS F represents the worst operating conditions (queuing on the freeway and/or ramp). LOS A through LOS D represent acceptable operating conditions. LOS E represents operating conditions at capacity. LOS F represents failing conditions (demand exceeds capacity).
TABLE 1
Level of Service Criteria for Basic Freeway, Ramp Merge/Diverge, and Weaving Segments
-- |
Basic Freeway Segment |
Ramp Merge/Diverge and Weaving Segments |
Level of Service |
Density (in passenger cars per mile per lane [pc/mi/ln]) |
Density (in passenger cars per mile per lane [pc/mi/ln]) |
A |
≤ 11 |
≤ 10 |
B |
> 11-18 |
> 10-20 |
C |
> 18-26 |
> 20-28 |
D |
> 26-35 |
> 28-35 |
E |
> 35-45 |
> 35 |
F |
> 45, Demand exceeds capacity |
Demand exceeds capacity |
Source: Highway Capacity Manual 2010.
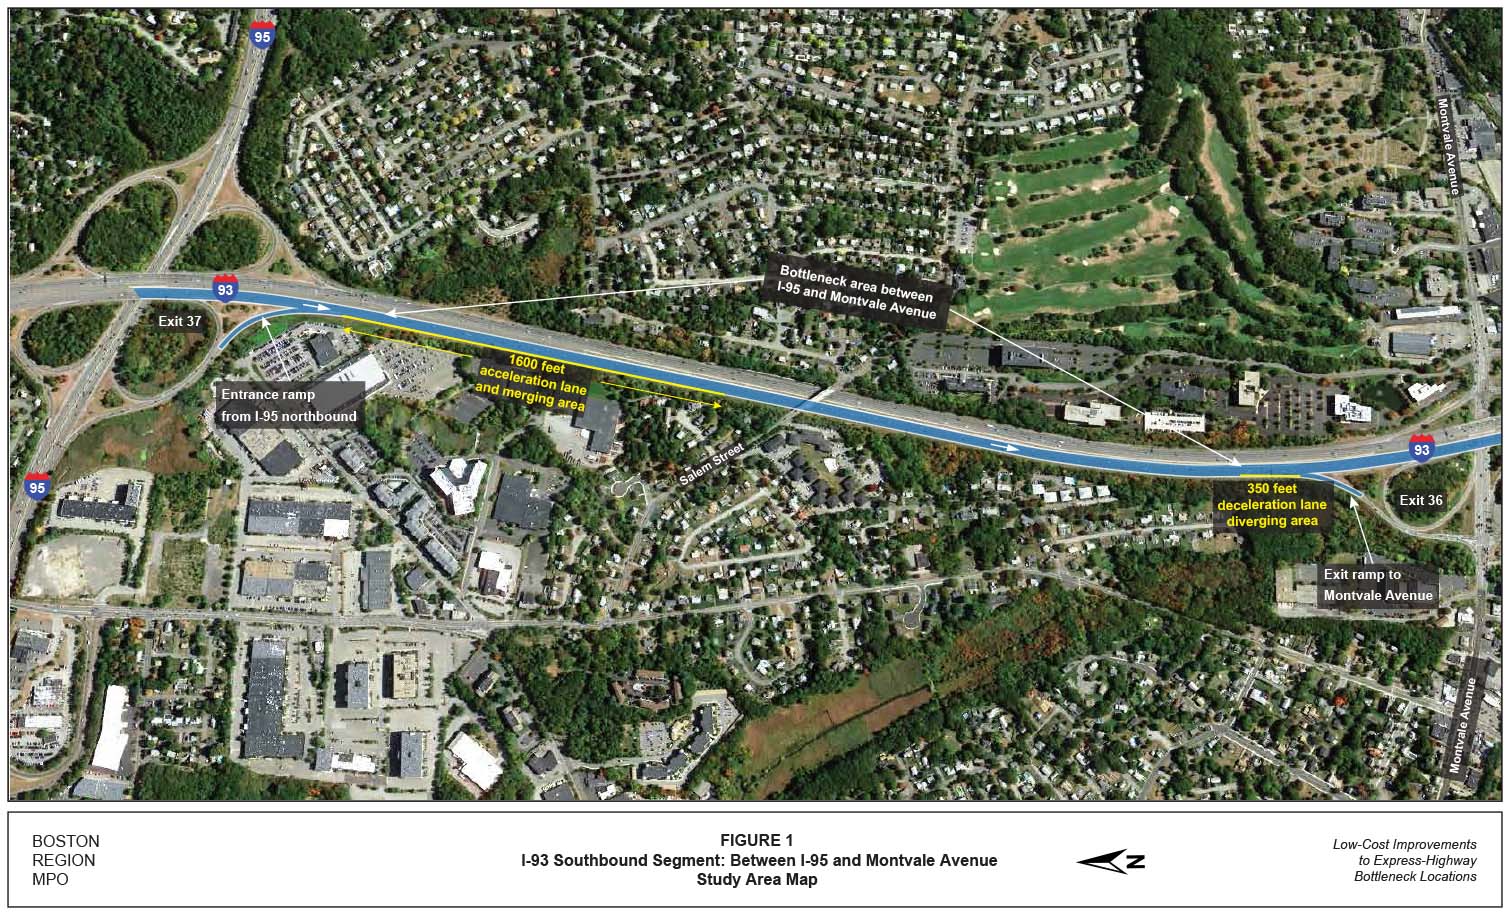
This bottleneck is located on the I-93 southbound barrel between I-95 and Montvale Avenue. The MassDOT Highway Division’s District 4 has jurisdiction of this roadway. Figure 1 shows the location of the bottleneck and the ramp configuration near it (all figures are included at the end of the memorandum). This section, approximately 1.2 miles long, experiences intense interruption of traffic flow because of the merging and diverging maneuvers of high-volume traffic entering and exiting the freeway.
The basic freeway section of I-93 southbound has four 12-foot travel lanes, a 12-to-13-foot right shoulder, and an 11-to-12-foot left shoulder. This section carries up to 7,700 vehicles per hour. The posted speed limit is 65 mph on the I-93 southbound mainline. Freeway exit signs are posted at one-mile and half-mile intervals to guide drivers to Montvale Avenue. Rumble strips have been installed on both sides of the southbound barrel to alert drivers and prevent run-off collisions.
An entrance ramp is a one-way roadway that allows traffic to enter a freeway from other crossing highways. Sufficient acceleration distance is needed to allow a vehicle to enter the freeway mainline safely and comfortably; drivers on the entrance ramp need to be able to see a sufficient distance upstream from the entrance to locate the gaps in the traffic stream within which to merge. The entrance ramp from I-95 northbound to I-93 southbound is a one-lane, one-way roadway. It carries as many as 1,800 vehicles per hour during peak hours. The length of the acceleration lane for traffic entering the section from I-95 northbound is approximately 1,600 feet long, and the posted speed limit on the entrance ramp is 30 mph. Based on highway design and entrance ramp curve design speeds, the length of the acceleration lane meets MassDOT’s standards. The MassDOT Highway Division’s current Project Development and Design Guide specifies a minimum acceleration lane of 1,230 feet for a freeway facility with a design speed of 70 miles per hour, an entrance ramp curve design speed of 35 mph, and a grade of two percent or less.
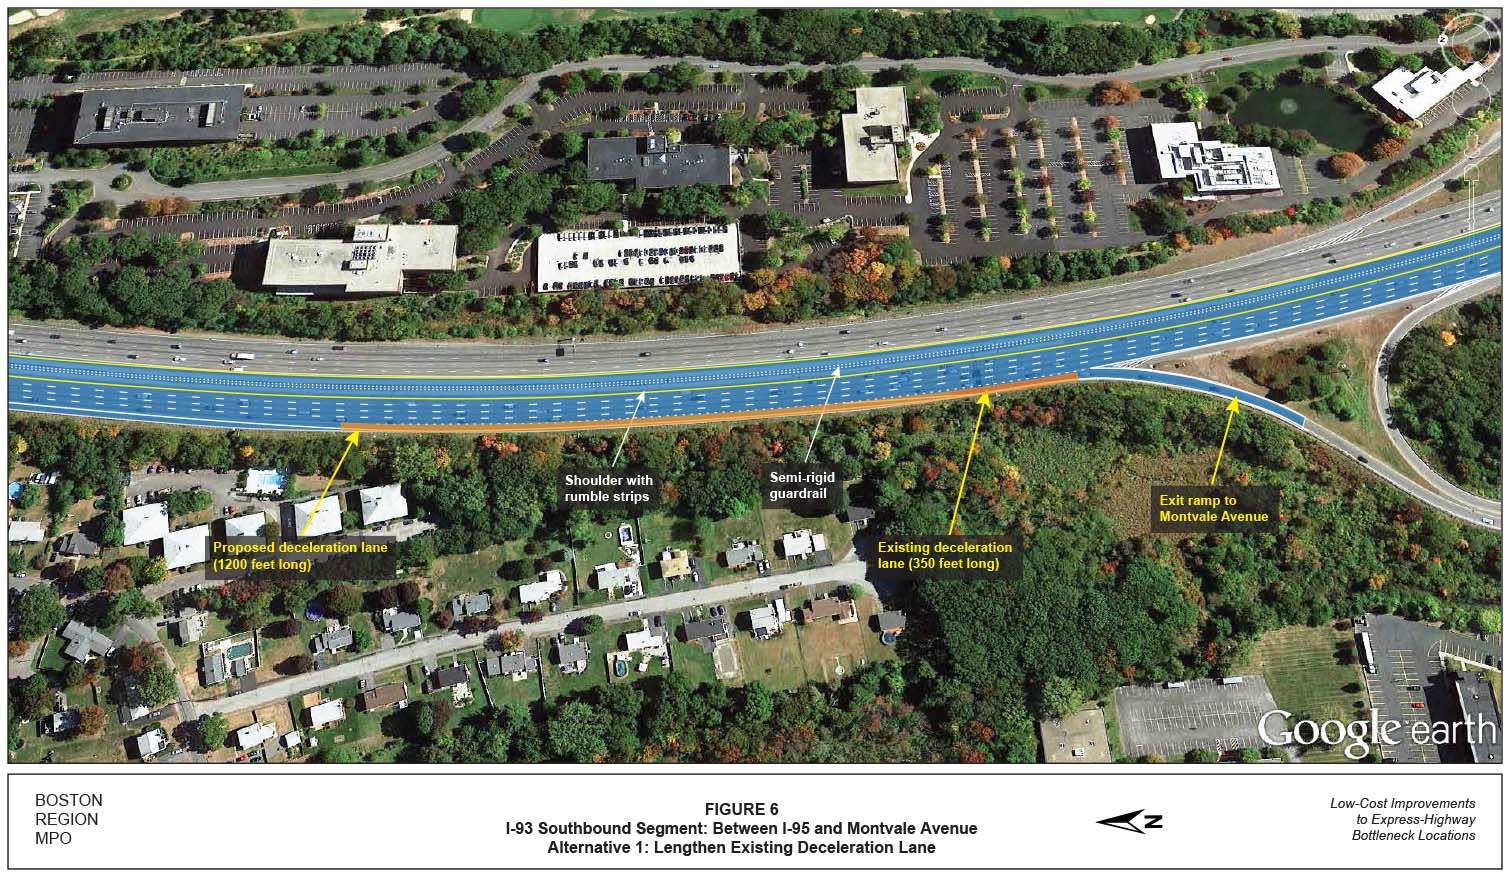
An exit ramp is a one-way roadway that allows traffic to exit from the freeway and provide access to other crossing highways. Sufficient deceleration distance is needed to allow a vehicle to leave the freeway mainline safely and comfortably. The exit ramp from I-93 southbound to Montvale Avenue is a one-way, one-lane roadway. It carries as many as 1,400 vehicles per hour during peak hours. The length of the deceleration lane for traffic exiting to Montvale Avenue is about 350 feet long, and the posted speed limit on the exit ramp is 30 mph. Based on highway design and exit ramp curve design speeds, the length of the deceleration lane does not meet MassDOT’s standards. The MassDOT Highway Division’s current Project Development and Design Guide specifies a minimum deceleration length of 490 feet for a freeway facility with a design speed of 70 miles per hour, an exit ramp curve design speed of 35 mph, and a grade of two percent or less.
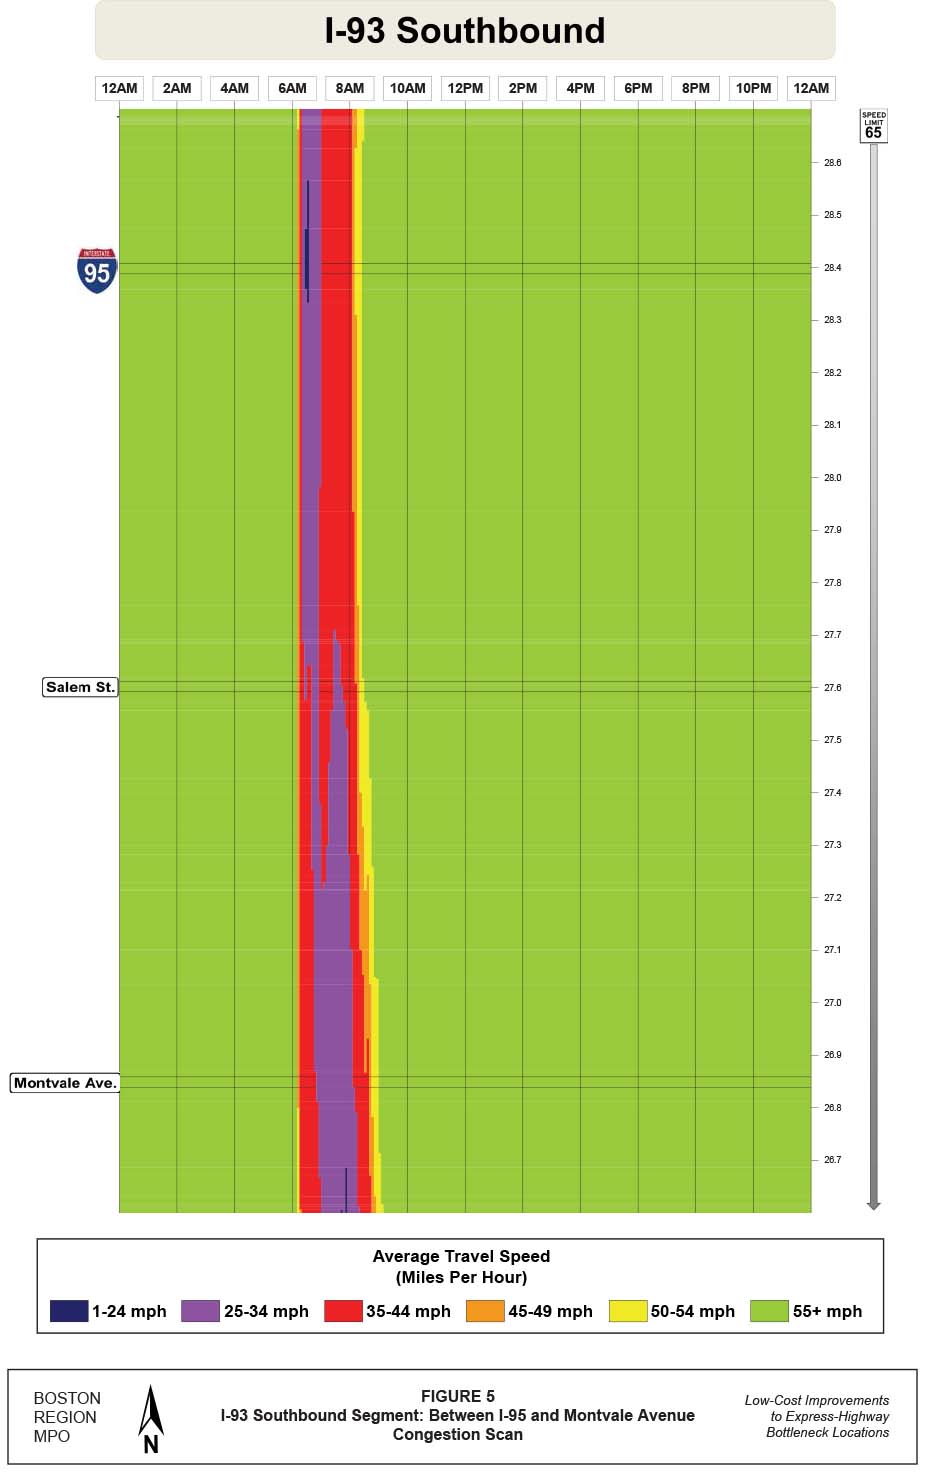
The existing bottleneck creates intense interruption of traffic flow during peak travel periods, felt by virtually all drivers in the section. It reduces travel speeds on the freeway mainline to 25 to 45 mph during the AM peak period (6:00 AM to 10:00 AM). In addition, the bottleneck causes many crashes in this area and results in poor operating LOS, especially at the diverge area connecting the exit ramp to Montvale Avenue.
There are two primary contributing factors to this bottleneck: high volume of traffic and a short deceleration lane.
Figures 2 and 3 show the traffic flows during the AM and PM peak periods. High-volume traffic from I-95 enters I-93 southbound at the upstream of the section, and high-volume traffic exits to Montvale Avenue at the downstream section during the AM peak period. The merging and diverging maneuvers of the entering and exiting vehicles interrupt traffic flow in this section, resulting in a traffic bottleneck.
A short deceleration lane for the high-volume traffic exiting I-93 southbound to Montvale Avenue forces drivers to diverge quickly and does not give them the ample distance needed to allow a vehicle to leave the freeway mainline safely and comfortably. The intense diverging maneuvers slow down traffic, causing recurring congestion upstream from the diverge location.
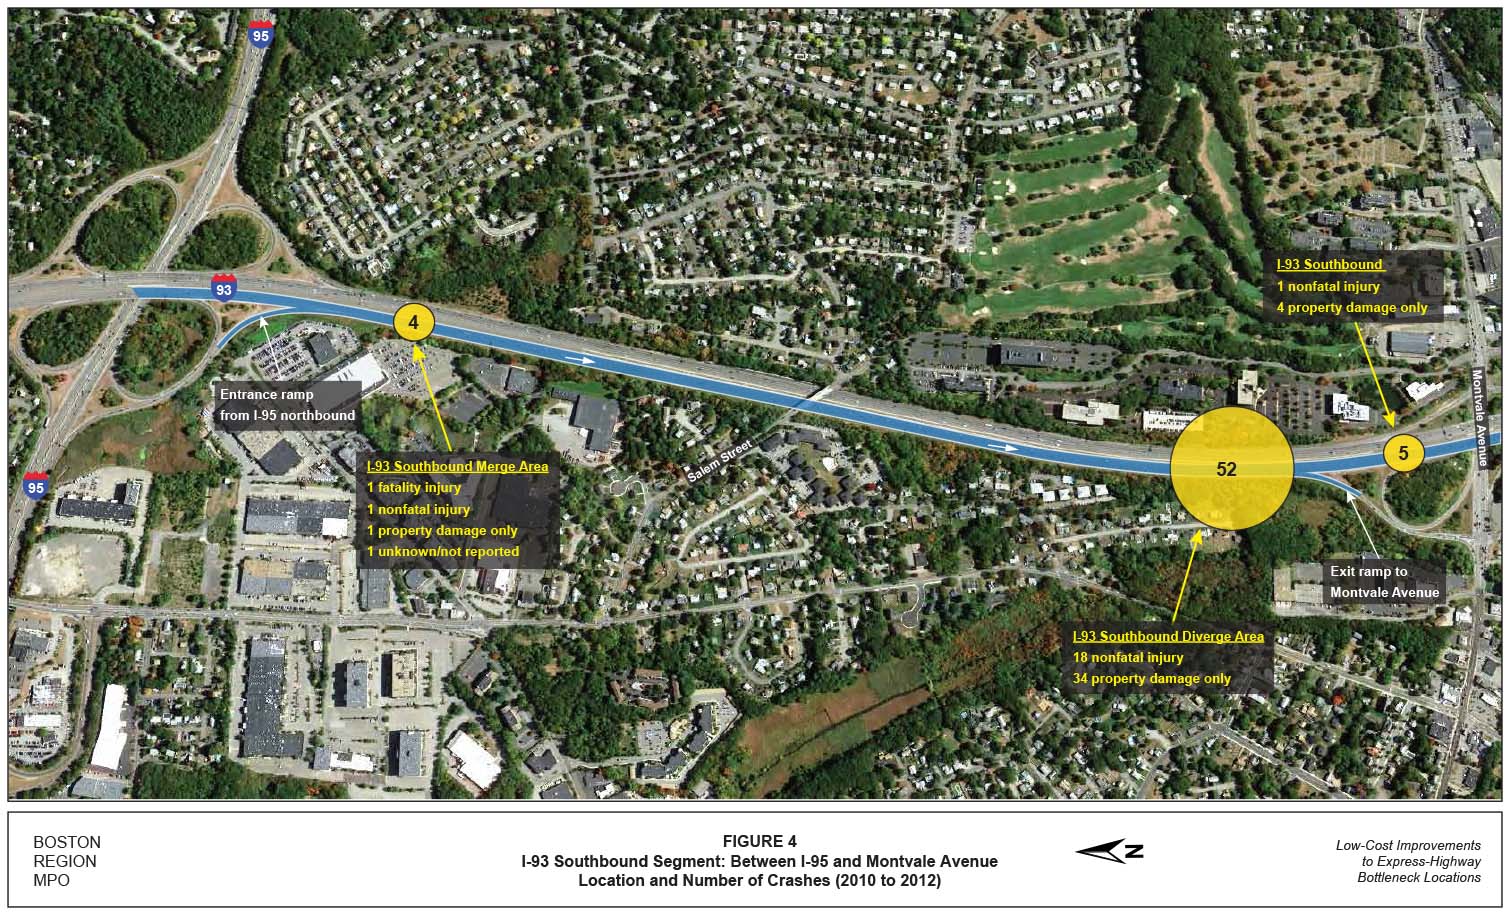
A summary of the crashes in this segment is presented in Table 2. There were 61 crashes in this area between 2010 and 2012 (Appendix C). Figure 4 shows the location and number of crashes. The majority (52 crashes) occurred in the vicinity of the short deceleration lane to Montvale Avenue.
TABLE 2
Crash Summary (2010-2012)
I-93 Southbound Segment between I-95 and Montvale Avenue
Crash Variable |
Number of Crashes |
Crash severity |
¾ |
Fatal injury |
1 |
Nonfatal injury |
20 |
Property damage only |
39 |
Not reported/unknown |
1 |
Manner of collision |
¾ |
Angle |
6 |
Rear-end |
37 |
Sideswipe, same direction |
9 |
Single vehicle crash |
9 |
Road surface conditions |
¾ |
Dry |
49 |
Wet |
8 |
Snow |
3 |
Other |
1 |
Ambient light conditions |
¾ |
Daylight |
29 |
Dark: lighted roadway |
28 |
Dark: nonlighted roadway |
2 |
Dawn |
1 |
Dusk |
1 |
Weather conditions |
¾ |
Clear |
35 |
Cloudy |
6 |
Rain |
5 |
Snow |
3 |
Not reported or unknown |
12 |
Travel period |
¾ |
Peak |
33 |
Off-peak |
28 |
Total crashes |
61 |
Three-year average (rounded) |
20 |
Segment crash rate |
0.57 |
MassDOT Highway Division average crash rate for urban interstate roadways |
0.54 |
The AM peak period is 6:00 AM to 10:00 AM, and the PM peak period is 3:00 PM to 7:00 PM.
Source: Central Transportation Planning Staff.
The segment crash rate of 0.57 crashes per million vehicle-miles traveled (MVMT) was greater than the MassDOT Highway Division average crash rate for urban interstate highways in Massachusetts, which is 0.54 MVMT. Below is a summary of the crashes in this segment.
Figure 5 is a congestion scan that shows the average travel speeds on I-93 southbound at the bottleneck location between I-95 and Montvale Avenue. The bottleneck reduces travel speed to 25 to 45 mph. Many motorists on I-93 southbound move out of the rightmost lane to avoid the high volume of merging and diverging traffic entering and exiting the freeway at this location.
MPO staff conducted traffic operations analyses consistent with HCM methodologies. Using the data collected, MPO staff built traffic analysis networks for the AM and PM peak hours with the 2010 Highway Capacity Software (HCS) to assess the capacity and quality of traffic flow at the bottleneck area (included in Appendix D).10 Table 3 presents the results of the LOS analyses for the existing conditions. The analyses indicate that the merge area upstream of the section operates well at LOS D during the AM and PM peak hours; however, the Exit 36 diverge area downstream of the section near Montvale Avenue operates at LOS E during the AM and PM peak hours (highlighted in yellow color in Table 3).
TABLE 3
Freeway Segment Analysis: Existing Conditions
I-93 Southbound Segment between I-95 and Montvale Avenue
Freeway Component |
AM Density (pc/mi/ln) |
AM Speed (mph) |
AM LOS* |
PM Density (pc/mi/ln) |
PM Speed (mph) |
PM LOS* |
2015 Existing Conditions |
¾ |
¾ |
¾ |
¾ |
¾ |
¾ |
Merge area: ramp from I-95 northbound |
27.3 |
54.3 |
C |
30.0 |
51.9 |
D |
Basic freeway segment: between the ramps |
32.7 |
60.4 |
D |
36.0 |
58.2 |
E |
Diverge area: Exit 36, Montvale Avenue |
36.2 |
50.4 |
E |
40.4 |
51.2 |
E |
*LOS A through LOS D represent acceptable operating conditions; LOS E represents operating conditions at capacity; and LOS F represents failing conditions (demand exceeds capacity).
mph = miles per hour. pc/mi/ln = passenger cars per mile per lane
Source: Central Transportation Planning Staff.
MPO staff developed two improvement alternatives to address the bottleneck:
The alternatives were analyzed using projected year 2025 traffic volumes. MPO staff estimated a five percent total background growth from 2015 to 2025.
The existing deceleration lane is short; it does not meet MassDOT’s standards and contributes to poor traffic operations and a high number of crashes. MPO staff recommends lengthening the deceleration lane at Exit 36.
Figure 6 shows the improvements recommended in Alternative 1.
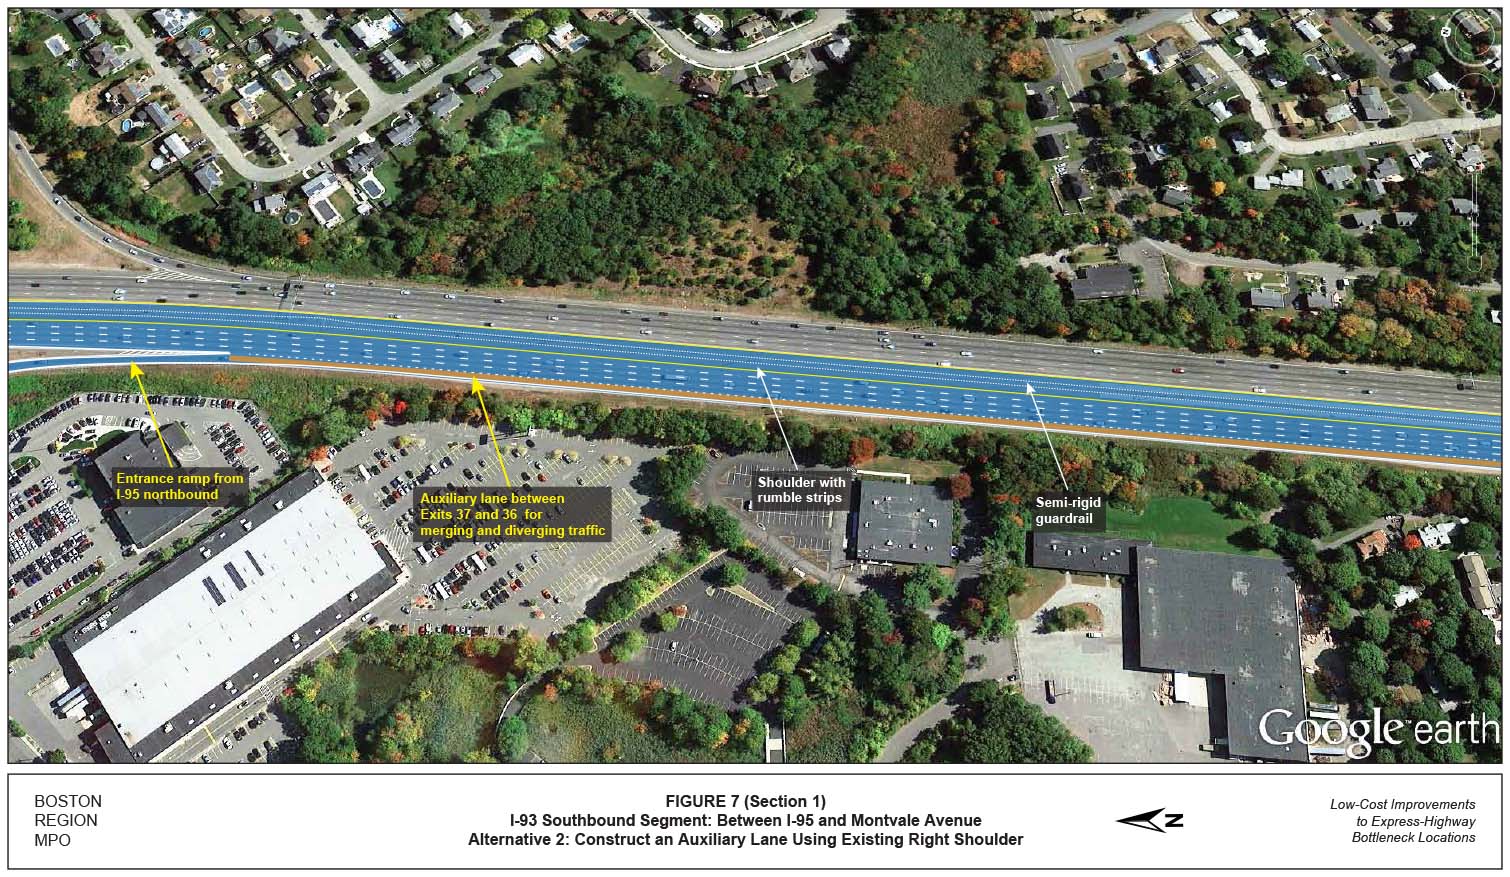
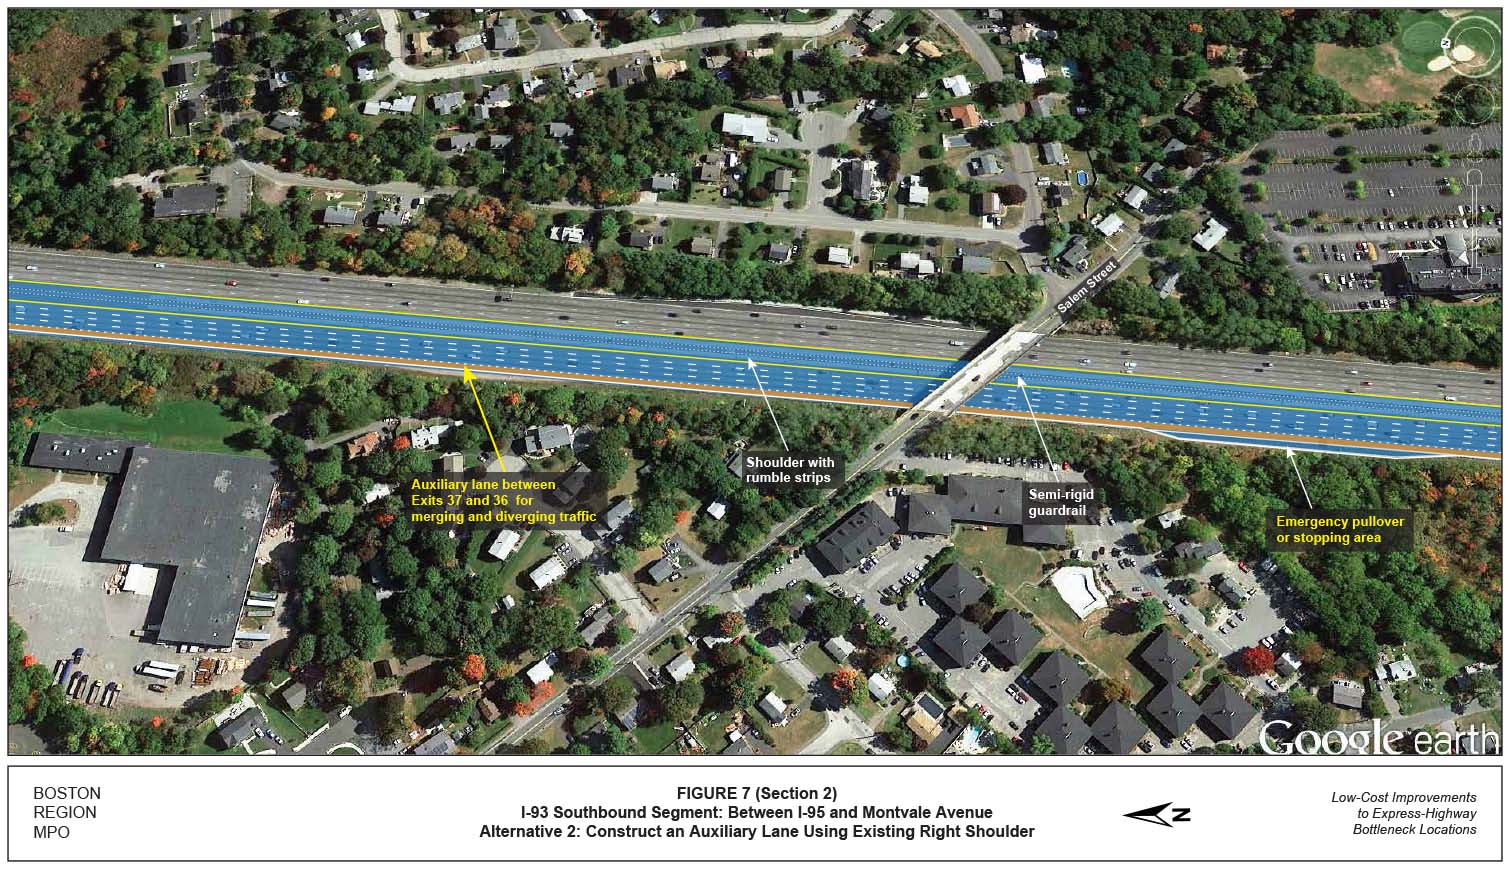
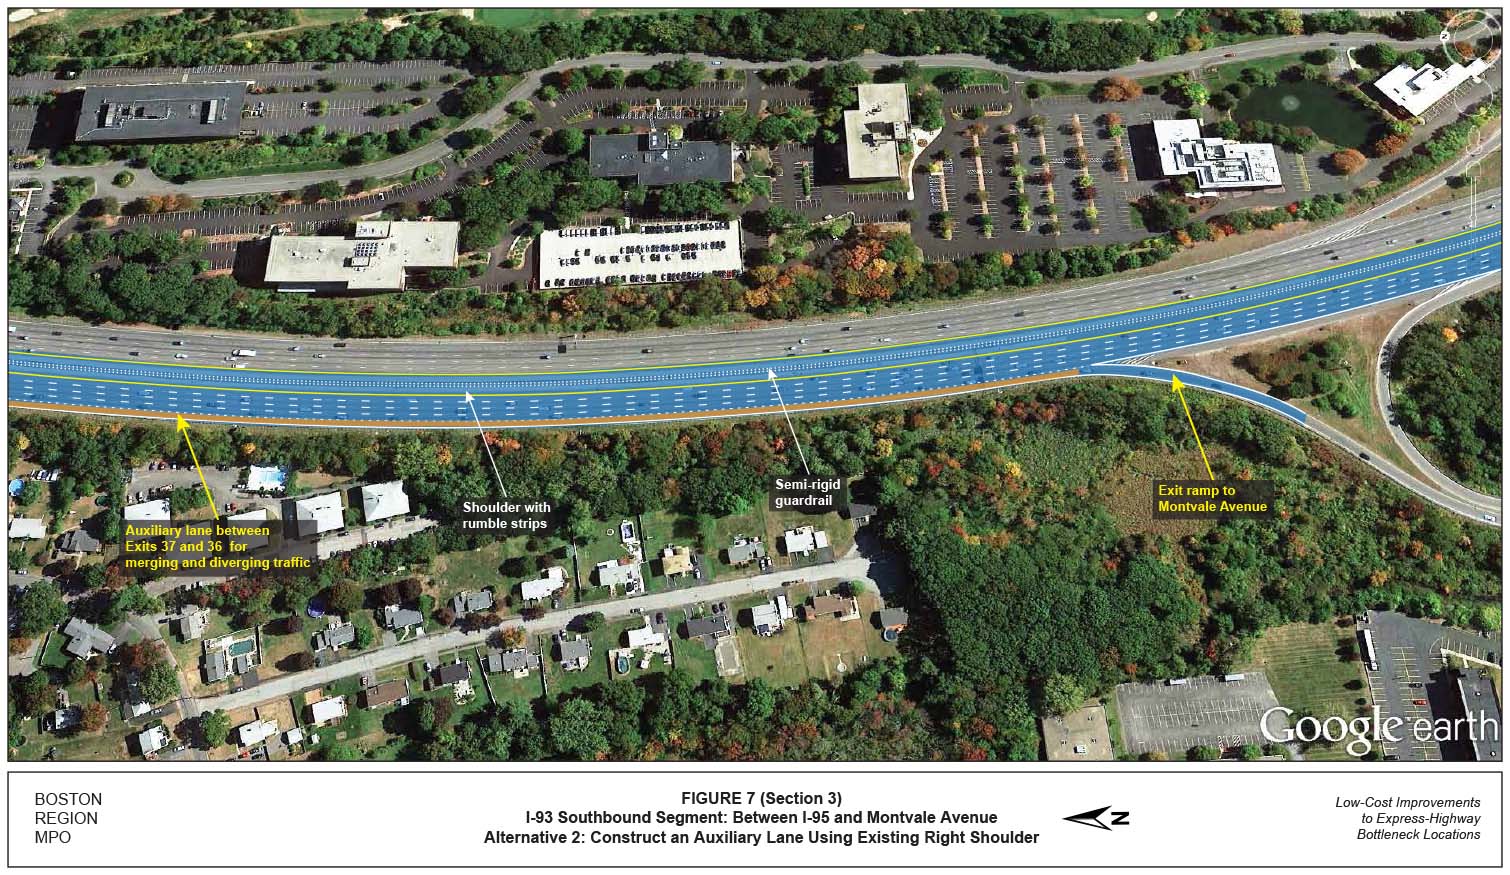
An auxiliary laneis defined as the portion of the roadway adjoining the traveled freeway for speed change, merging, diverging, weaving, and other purposes supplementary to through-traffic movement. Alternative 2 would transform the right shoulder from the entrance ramp to the exit ramp into an auxiliary lane for merging or diverging traffic maneuvers and would provide sufficient distance to accommodate speed changes and weaving maneuvers. The auxiliary lane would also upgrade the short deceleration lane to meet MassDOT’s standards.
Figure 7 (Sections 1, 2, and 3) shows the improvements recommended in Alternative 2.
Alternatives 1 and 2 were analyzed as freeway merge/diverge and basic freeway segments. Table 4 presents the results of the 2025 future LOS analyses for Alternatives 1 and 2. Alternative 1 results in LOS E at the mainline basic freeway segment (highlighted in yellow in Table 4). Analysis indicates that Alternative 2 would improve traffic operations at the bottleneck to LOS D or better during peak periods (compared to LOS E with no action). Alternative 2 is expected to increase AM peak period average travel speed to 50 to 55 mph (compared to 25 to 45 mph with no action) and reduce crashes by as much as 30 percent.11
Improvement Alternative 1 is estimated to cost between $200,000 and $250,000 to construct. Improvement Alternative 2 is estimated to cost between $500,000 and $750,000 to construct.
TABLE 4
Freeway Segment Analysis: Improvement Alternatives
I-93 Southbound Segment between I-95 and Montvale Avenue
Freeway Component |
AM Density (pc/mi/ln) |
AM Speed (mph) |
AM LOS* |
PM Density (pc/mi/ln) |
PM Speed (mph) |
PM LOS* |
Alternative 1: 2025 Future Conditions |
¾ |
¾ |
¾ |
¾ |
¾ |
¾ |
Merge area: ramp from I-95 northbound |
17.4 |
58.2 |
B |
30.8 |
51.0 |
D |
Basic freeway segment: between the ramps |
35.3 |
58.6 |
E |
39.5 |
55.8 |
E |
Diverge area: Exit 36 Montvale Avenue |
27.7 |
50.1 |
C |
31.0 |
51.2 |
D |
Alternative 2: 2025 Future Conditions |
¾ |
¾ |
¾ |
¾ |
¾ |
¾ |
Merge area: ramp from I-95 northbound |
17.4 |
58.2 |
B |
30.8 |
51.0 |
D |
Basic freeway segment: between the ramps |
24.9 |
64.4 |
C |
26.9 |
63.6 |
D |
Diverge area: Exit 36, Montvale Avenue |
27.7 |
50.1 |
C |
30.9 |
51.2 |
D |
*LOS A through LOS D represent acceptable operating conditions; LOS E represents operating conditions at capacity; and LOS F represents failing conditions (demand exceeds capacity).
mph = miles per hour. pc/mi/ln = passenger cars per mile per lane
Source: Central Transportation Planning Staff.
MPO staff recommends Alternative 2 because it improves operational efficiency and safety by removing entering and exiting traffic from the mainline travel lanes to the auxiliary lane. Alternative 1 forces traffic to merge onto the mainline as well as diverge from the mainline to exit the freeway, which interrupts traffic flow.
There is space within the existing right-of-way to construct Alternative 2. The right shoulder appears to have a consistent 12-to-13-foot space, which is wide enough to accommodate a full-travel lane (auxiliary lane). In addition, there is space to construct an emergency pullover/stopping area, which would not be expensive to build. Alternative 2 would mirror the recently constructed northbound auxiliary lane and emergency pullover area.
Alternative 2 would require a Design Exception Report (DER) for the less-than-minimal right shoulder (i.e., a 12-foot auxiliary lane and a 2-foot offset [no shoulder] to the guardrail). The DER could be easily produced by MassDOT Highway District 4, similar to the DER submitted and approved for the I-93 northbound auxiliary lane.
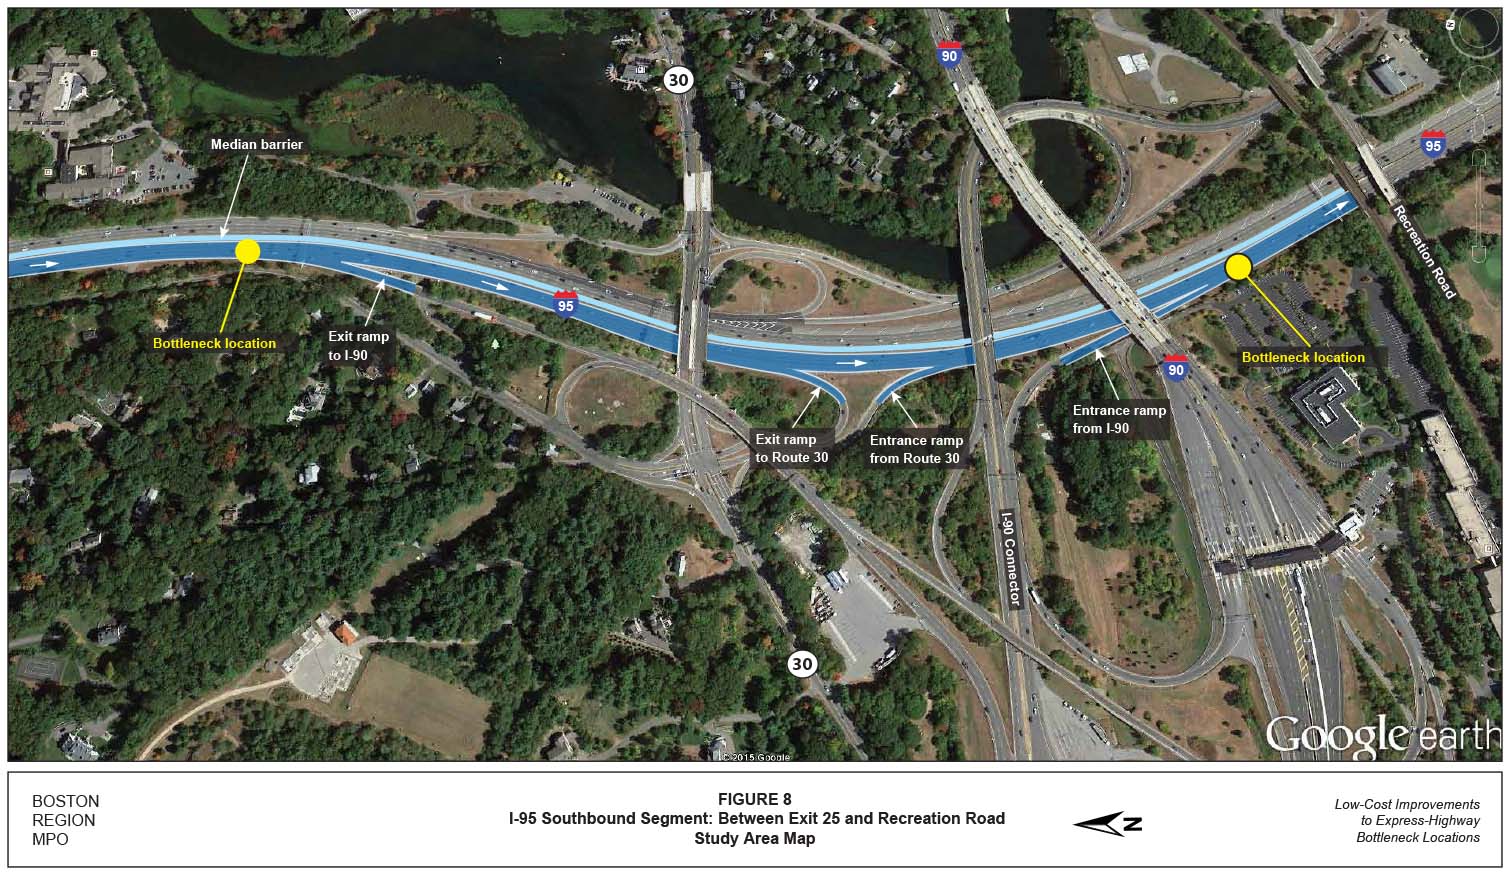
There are two bottleneck locations on the I-95 southbound barrel at the I-90 Interchange in Weston. The interchange and roadways are under the jurisdiction of MassDOT Highway Division’s District 6. Figure 8 shows the locations of the bottlenecks and the ramp configurations near them. The affected section, about one mile long, extends from Exit 25 (I-90) to the Recreation Road overpass.
The basic freeway section has four 12-foot travel lanes, a 2-to-3-foot right shoulder, and an 11-to-12-foot left shoulder. During peak hours, I-95 southbound carries as many as 7,500 vehicles per hour upstream of the section under study.12 The posted speed limit is 55 mph. Exit signs are posted at one-mile, one-half-mile, and one-quarter-mile intervals to guide motorists exiting the freeway to I-90 and Route 30. Rumble strips have been installed on both sides of the southbound barrel to alert drivers and prevent run-off collisions. In June 2015, MassDOT Highway District 6 implemented signs and pavement markings in the study area.
Although, the posted speed limit on I-95 southbound is 55 mph, the 85th-percentile speed on the freeway is usually around 70 mph. Based on the 85th-percentile speed, MPO staff used a design speed of 70 mph to evaluate the minimum length of the acceleration and deceleration lanes described below.
Exit ramps are one-way roadways that allow traffic to exit from the freeway and provide access to other crossing highways. Sufficient deceleration distance is needed to allow a vehicle to leave the freeway mainline safely and comfortably. At Exit 25, the exit ramp to I-90 is a one-way, one-lane roadway on the freeway that widens to two lanes on the connecting ramp roadway. It carries as many as 2,300 vehicles per hour during peak hours. The length of the deceleration lane is about 350 feet long. Based on the highway design and exit ramp curve design speeds, the length of the deceleration lane does not meet MassDOT’s standards. The posted speed limit on the exit ramp curve to I-90 is 25 mph.
At Exit 24, the exit ramp to Route 30 is a one-way, one-lane roadway that carries as many as 900 vehicles per hour during peak hours. The advisory speed limit on the exit ramp curve to Route 30 is 25 mph. The length of the deceleration lane for the traffic exiting to Route 30 is about 500 feet long. Based on the highway design and exit ramp curve design speeds, the length of the deceleration lane meets MassDOT’s standards. However, the sharp hairpin curve would require slower speeds and enhanced signs to warn and guide drivers through the curve. The MassDOT Highway Division’s current Project Development and Design Guide specifies a minimum deceleration length of 520 feet for a freeway facility with a design speed of 70 mph, an exit ramp curve design speed of 30 mph, and a grade of two percent or less.
Entrance ramps are one-way roadways that allow traffic to enter a freeway from other crossing highways. Sufficient acceleration distance is needed to allow a vehicle to enter the freeway mainline safely and comfortably; drivers on the entrance ramp need to be able to see a sufficient distance upstream from the entrance to locate the gaps in the traffic stream within which to merge. The entrance ramp from I-90 to I-95 southbound carries up to 2,000 vehicles per hour during peak periods that merge onto I-95 southbound at the bottleneck. The length of the existing acceleration lane on I-95 southbound for the traffic entering the freeway from I-90 is approximately 450 feet long. Based on the highway design and entrance ramp curve design speeds, the length of the acceleration lanes does not meet MassDOT’s standards.
The entrance ramp from Route 30 to I-95 southbound carries up to 600 vehicles per hour during peak periods. The length of the existing acceleration lane on I-95 southbound for the traffic entering the freeway from Route 30 is approximately 400 feet long. Based on the highway design and entrance ramp curve design speeds, the length of the acceleration lanes does not meet MassDOT’s standards.
Interstate 95, also called Route 128, was constructed in the 1950s to design standards of the time. It has been reconstructed along various portions over time to address some design deficiencies associated with updated standards. The MassDOT Highway Division’s current Project Development and Design Guide specifies a minimum acceleration length of 1,230 feet for a freeway facility with a design speed of 70 miles per hour, an entrance ramp curve design speed of 35 mph, and a grade of two percent or less. Because of space limitations (i.e., short spacing between the ramps, bridges, and overhead roadways and railroads), there is no room at the interchange to lengthen both acceleration lanes.
The existing bottlenecks, along with substandard acceleration and deceleration lanes, result in a long traffic queue on the I-90 connector during AM and PM peak periods when high volumes of traffic merge onto I-95 southbound. This queue affects I-90 traffic on the connector heading to I-95 northbound as well.
MPO staff identified four factors that contribute to form the bottlenecks:
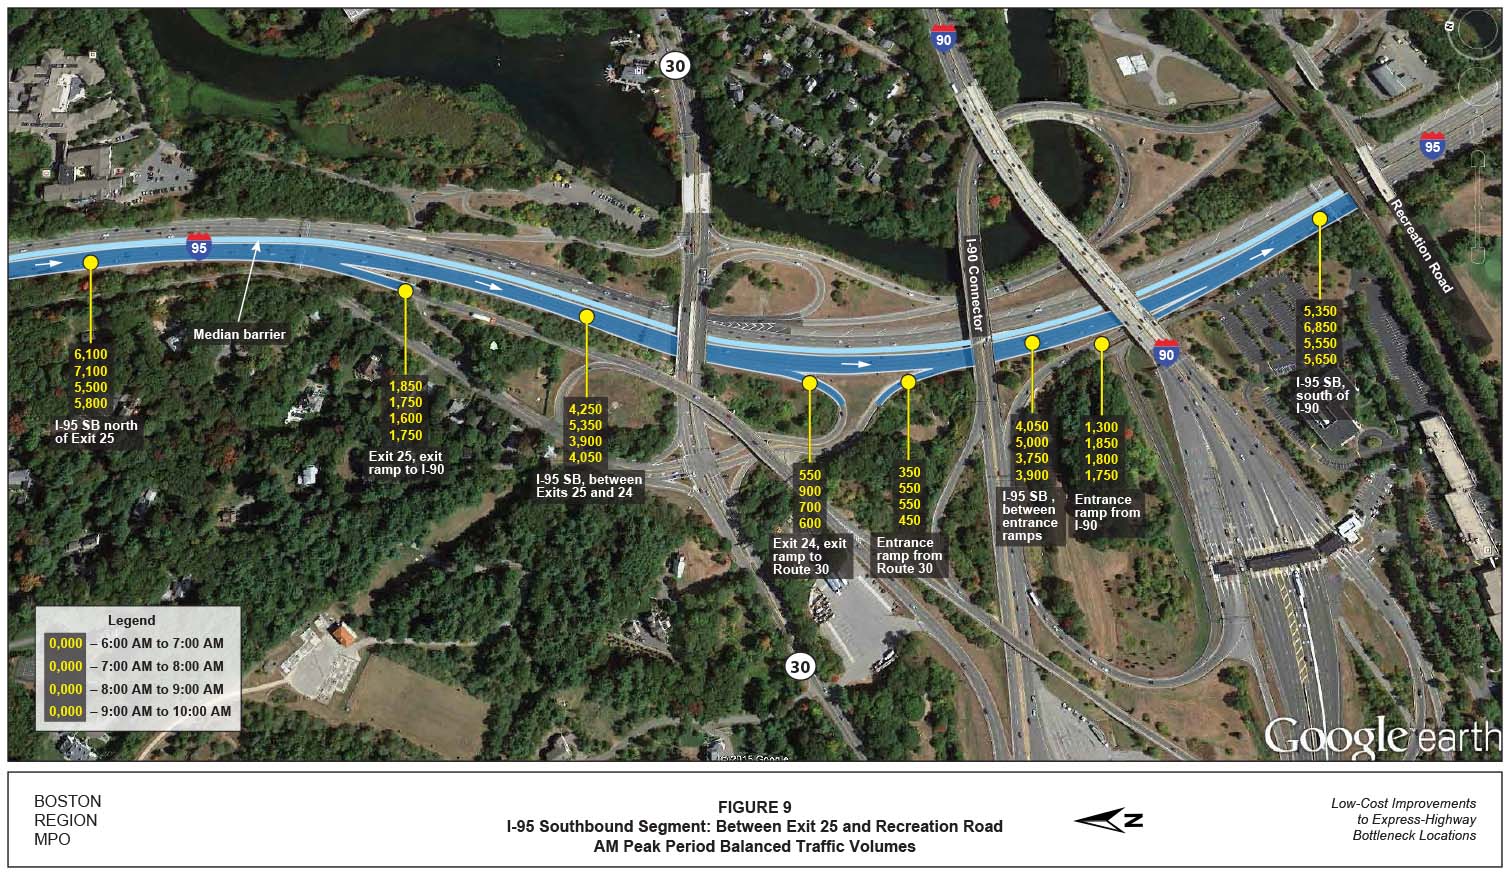
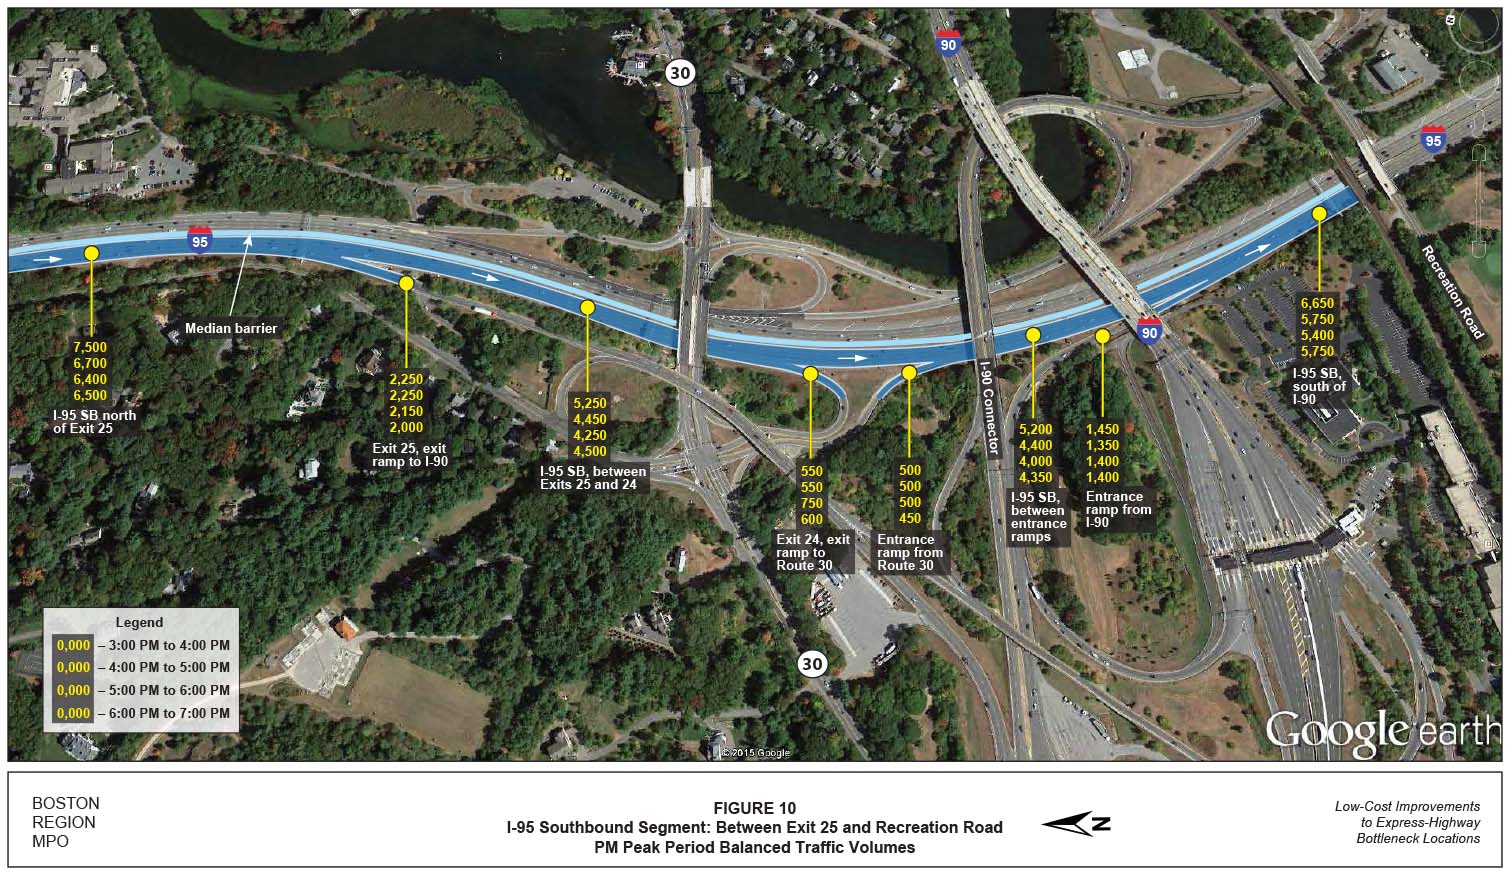
Figures 9 and 10 show the traffic flows during the AM and PM peak periods. As many as 2,000 vehicles per hour enter I-95 southbound from I-90 during the peak period. These entry volumes are quite high for a single-lane entrance ramp given the high volume of traffic on I-95 southbound with which it has to merge. The intense merging maneuvers interrupt traffic for all drivers and cause a bottleneck. Many motorists on I-95 southbound move out of the rightmost lane to avoid the merge with high-volume traffic entering the freeway.
The acceleration lane for the high-volume traffic merging onto I-95 southbound from I-90 is inadequate and does not meet MassDOT’s standards. It forces drivers to merge quickly, causing intense merging and queuing on the I-90 entrance ramp. Presently, there is no room to lengthen the acceleration lane because of the bridges downstream of the section. In addition, the problem of forced merging at this location is exacerbated by the close proximity of the Route 30 and I-90 entrance ramps.
The length of the deceleration lane at Exit 25 for the high-volume traffic exiting to I-90 is inadequate; it forces drivers to diverge quickly and does not give them ample distance needed to allow a vehicle to leave the freeway mainline safely and comfortably. The intense diverge and lane-change maneuvers cause traffic interruption and wide variability in traffic speeds, resulting in many crashes.
Travel lanes in the study area are not in balance with the volume of traffic entering and exiting this section. At Exit 25 and Exit 24, approximately 2,300 to 2,900 vehicles per hour exit the freeway to I-90 and Route 30. The exit traffic flow rate exceeds the capacity of a full travel lane. Downstream of Exit 24, up to 2,400 vehicles per hour enter the freeway from the same roads. Likewise, the entry traffic flow rate is equivalent to the capacity of the full travel lane. Therefore, maintaining four continuous lanes in the study area creates a lane imbalance, which also results in intense merging and bottlenecks at the diverge and merge points.
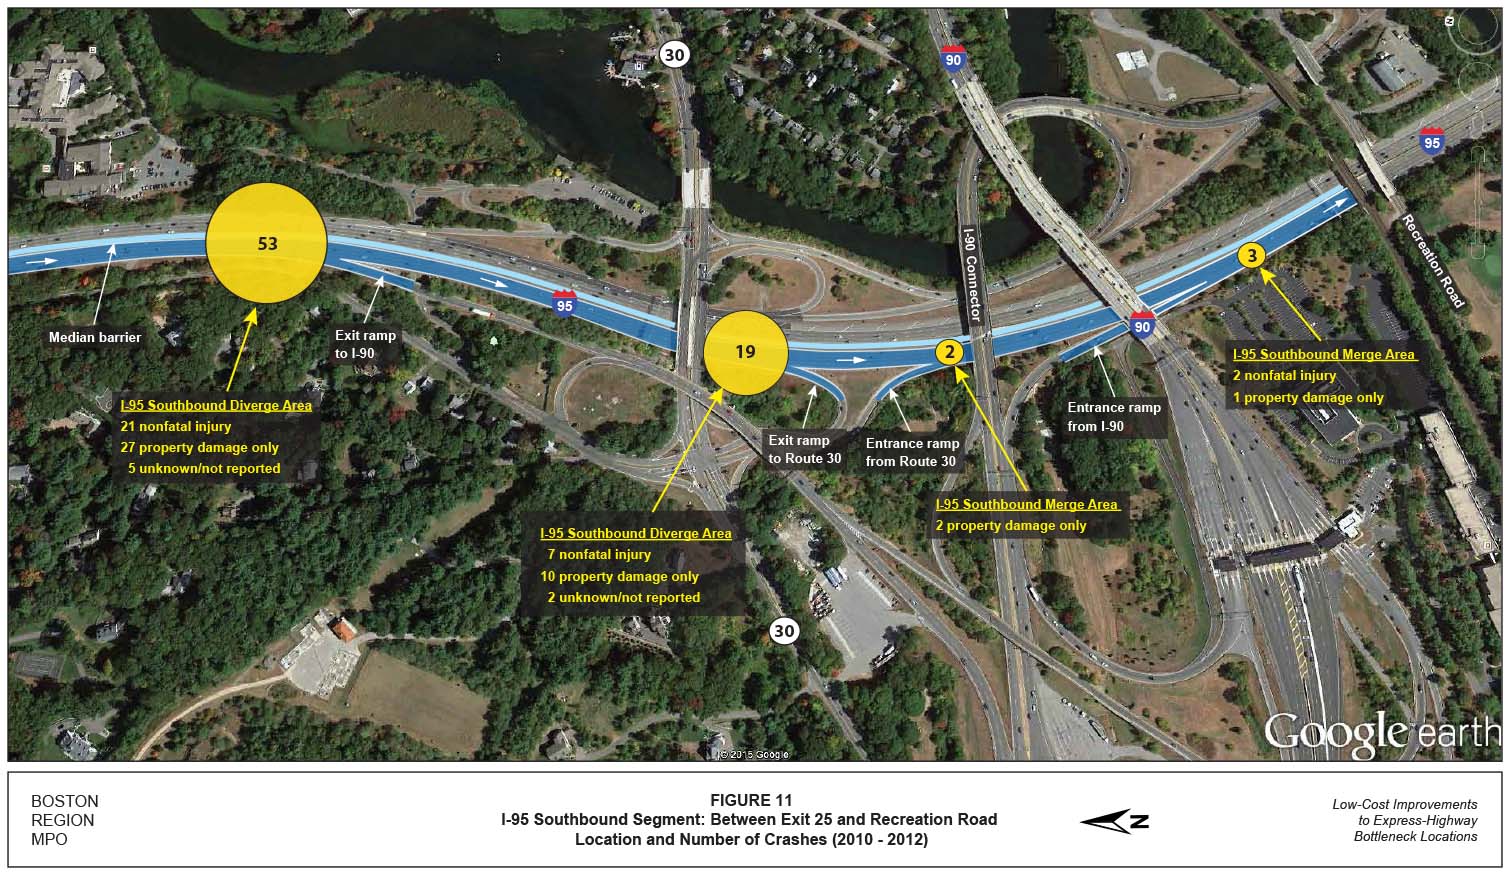
Figure 11 shows the location and number of crashes in the study area. A summary of the crashes is also presented in Table 5. There were 77 crashes in this section between 2010 and 2012 (Appendix C). The majority, 53 of the crashes, occurred in the vicinity of the diverge area at Exit 25. MPO staff believe that many of the rear-end and sideswipe crashes were caused by drivers slowing down to exit the freeway to I-90 or by drivers changing lanes. It appears that the short deceleration lane at this location may be contributing to poor traffic operations and the high number of crashes. There were only five recorded crashes near the bottleneck location where traffic from I-90 merges onto I-95 southbound.
The average crash rate of the freeway segment was 1.06 crashes per MVMT, which was significantly higher than the average of 0.54 crashes per MVMT for urban interstate highways in Massachusetts. Below is a summary of the crashes in this segment.
TABLE 5
Crash Summary (2010-2012)
I-95 Southbound Segment between Exit 25 and Recreation Road
Crash Variable |
Number of Crashes |
Crash severity |
¾ |
Fatal injury |
0 |
Nonfatal injury |
30 |
Property damage only |
40 |
Not reported/unknown |
7 |
Manner of collision |
¾ |
Angle |
4 |
Rear-end |
52 |
Sideswipe, same direction |
6 |
Single vehicle crash |
15 |
Road Surface conditions |
¾ |
Dry |
64 |
Wet |
11 |
Snow |
1 |
Other |
1 |
Ambient light conditions |
¾ |
Daylight |
54 |
Dark: lighted roadway |
5 |
Dark: nonlighted roadway |
10 |
Dawn |
2 |
Dusk |
6 |
Weather conditions |
¾ |
Clear |
50 |
Cloudy |
8 |
Rain |
8 |
Snow |
1 |
Fog/smog/smoke |
1 |
Not reported/unknown |
9 |
Travel period |
¾ |
Peak |
51 |
Off-peak |
26 |
Total crashes |
77 |
Three-year average (rounded) |
26 |
Segment crash rate |
1.06 |
MassDOT Highway Division average crash rate for urban interstate roadways |
0.54 |
* The AM peak period is 6:00 AM to 10:00 AM, and the PM peak period is 3:00 PM to 7:00 PM.
Source: Central Transportation Planning Staff.
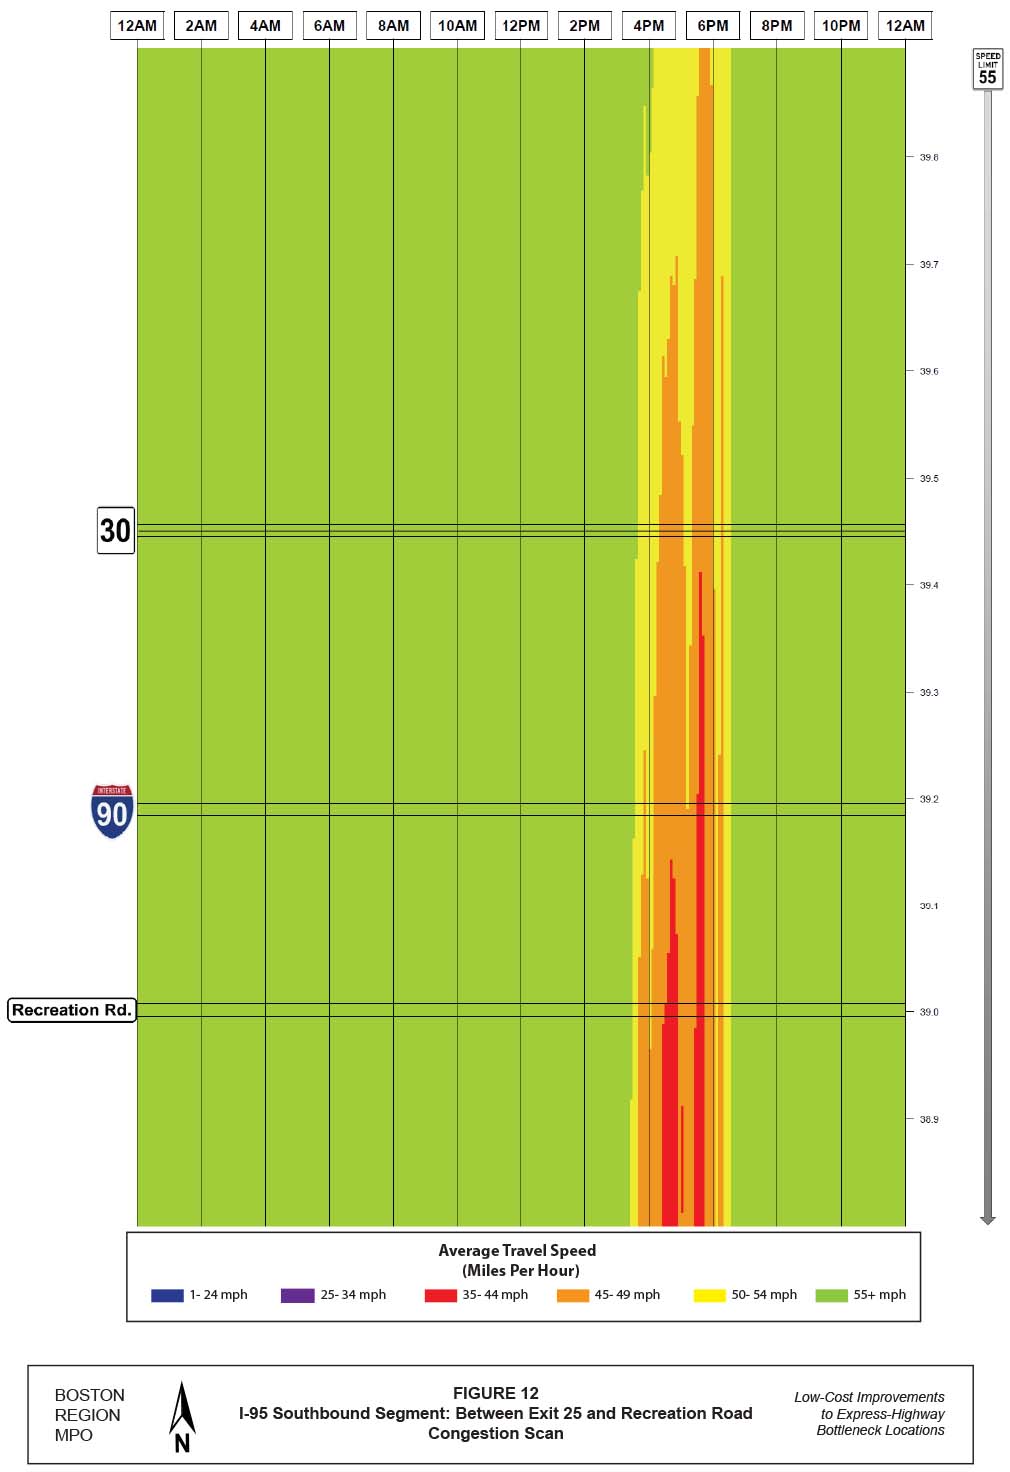
The bottleneck affects travel on I-95 southbound and on the entrance ramp from I-90. Figure 12 is a congestion scan that shows the average travel speeds on I-95 southbound in the study area. The bottleneck reduces travel speed to 35 to 45 mph. A traffic queue resulting from the bottleneck forms on the I-90 entrance ramp, which extends onto the I-90 connector as well as onto I-95 southbound.
Using the data collected, MPO staff analyzed the AM and PM peak hours with the 2010 HCS to assess the capacity and quality of traffic flow at the bottleneck area (included in Appendix D).13 Table 6 presents the results of the existing freeway merge/diverge analyses. Analyses indicate that traffic entering I-95 southbound from I-90 operates at LOS E during peak hours due to intense merging. The merging and diverging activities in the section interrupt and slow down traffic on the mainline and entrance ramps. In addition, analyses show that the traffic exiting from the freeway to I-90 upstream of the section operates well at LOS F during peak hours.
TABLE 6
Freeway Segment Analysis: Existing Conditions
I-95 Southbound Segment between Exit 25 and Recreation Road
Freeway Component |
AM Density (pc/mi/ln) |
AM Speed (mph) |
AM LOS* |
PM Density (pc/mi/ln) |
PM Speed (mph) |
PM LOS* |
2015 Existing Conditions |
¾ |
¾ |
¾ |
¾ |
¾ |
¾ |
Diverge segment: Exit 25, I-90 |
39.5 |
45.5 |
F |
43.7 |
45.0 |
F |
Diverge segment: Exit 24, Route 30 |
27.1 |
46.6 |
C |
24.5 |
47.0 |
C |
Merge segment: Entrance ramp from Route 30 |
12.6 |
50.9 |
B |
23.4 |
50.4 |
C |
Merge segment: Entrance ramp from I-90 |
37.1 |
46.5 |
E |
35.9 |
47.2 |
E |
*LOS A through LOS D represent acceptable operating conditions; LOS E represents operating conditions at capacity; and LOS F represents failing conditions (demand exceeds capacity).
mph = miles per hour. pc/mi/ln = passenger cars per mile per lane
Source: Central Transportation Planning Staff.
MPO staff developed the following improvements to increase safety and address the bottleneck:
The objectives of the improvement at this location are to reduce traffic interruption and increase safety at the Exit 25 diverge area. The conversion would extend the deceleration lane to meet MassDOT’s standards and provide drivers with ample distance to exit the freeway to I-90 safely and comfortably. In addition, it would improve traffic operation at the diverge area and reduce the high number of crashes at this location.
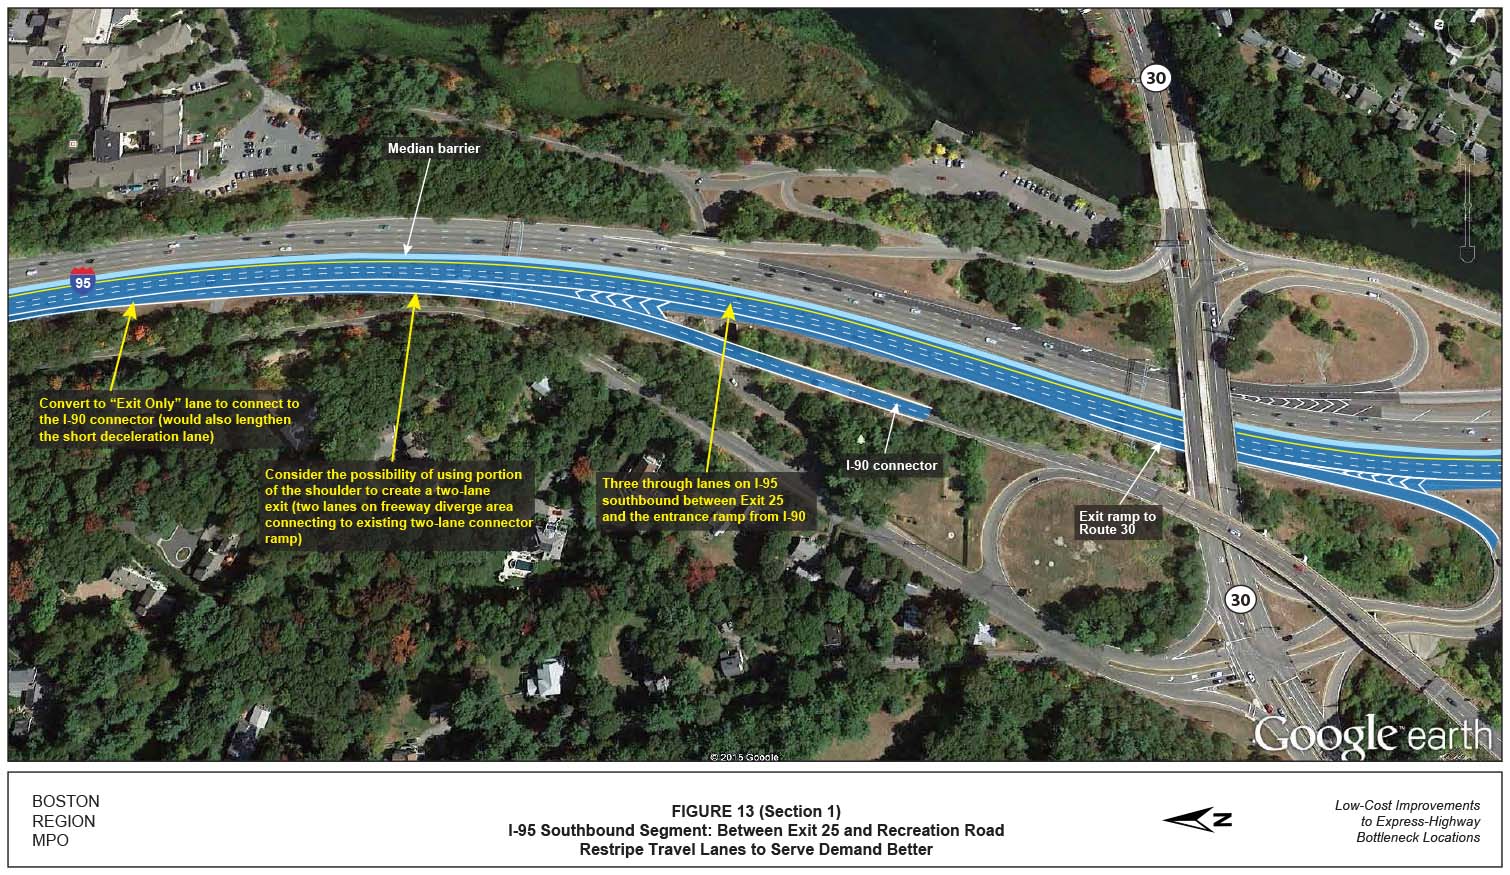
MPO staff suggests that the MassDOT Highway Division looks into the possibility of using a section of the right shoulder on I-95 southbound at Exit 25 to create a full two-lane exit-ramp (i.e., two lanes on the freeway diverge area to connect to the existing two-lane exit ramp connector as illustrated in Figure 13 [Section 1]). A full two-lane exit ramp would improve safety and operations significantly. This improvement would require relocation of signs or installation of new guide signs to direct drivers to I-90 and modifying of pavement markings to delineate the “Exit Only” lane from the mainline travel lanes.
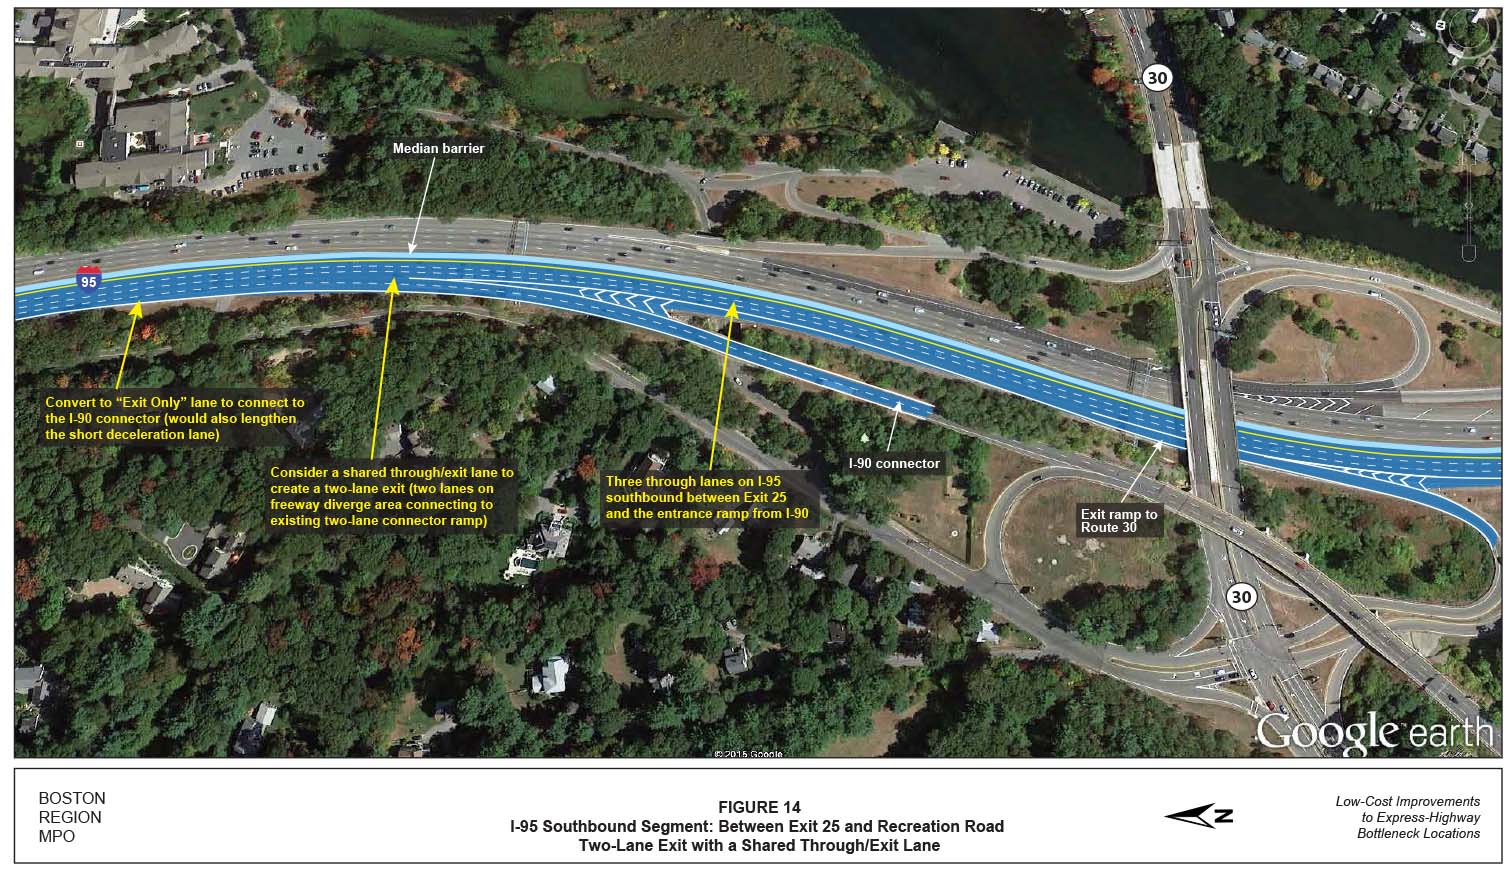
It is possible that a full two-lane exit is not feasible because of the following reasons:
An alternative to resolve these issues would be a shared through and exit lane in addition to the Exit Only lane as shown in Figure 14.
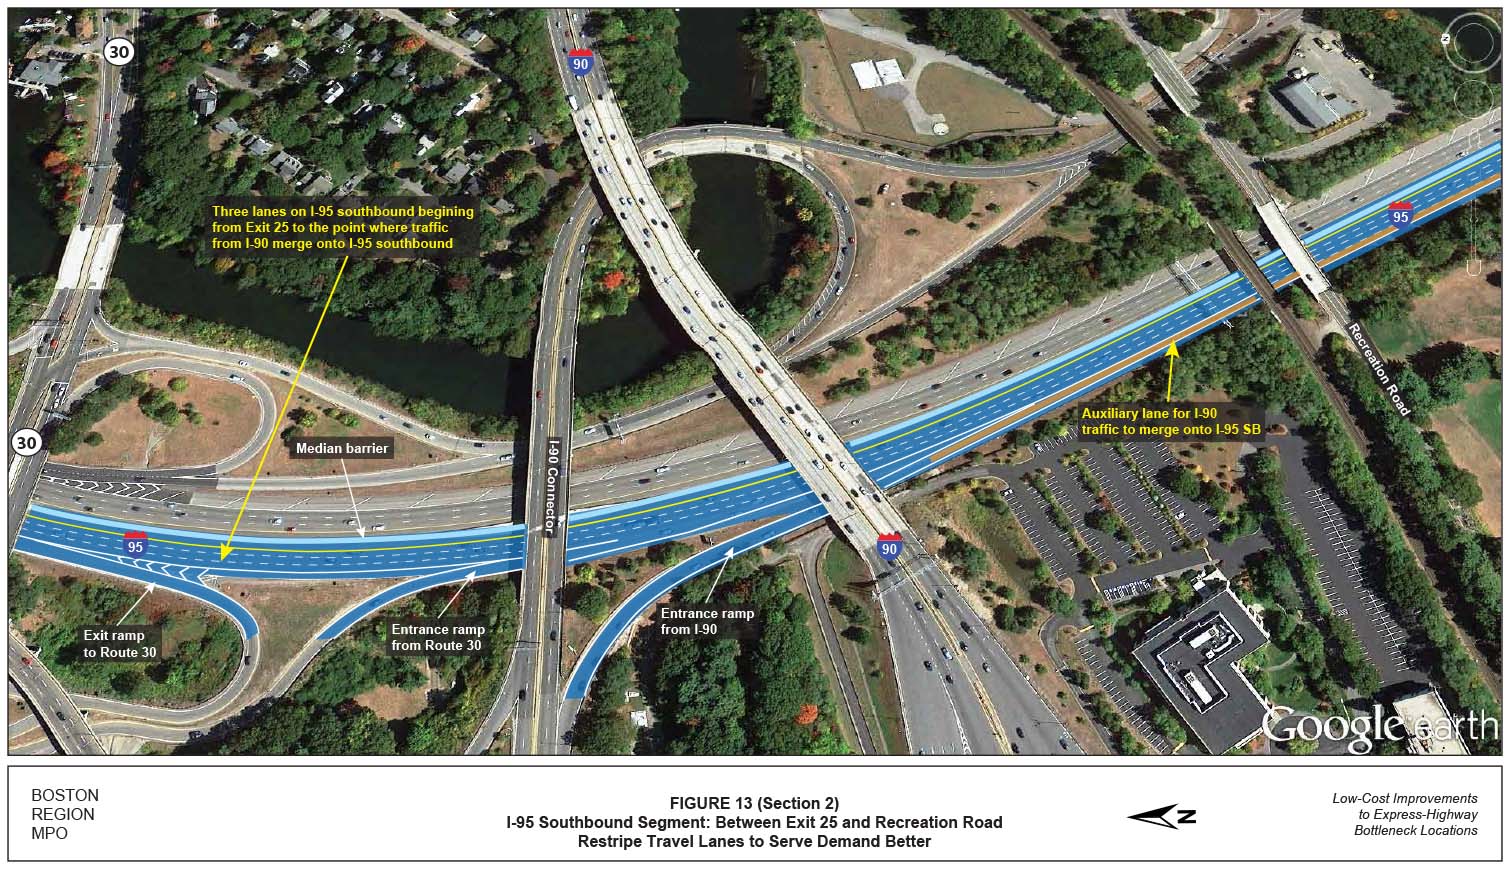
The objective of this improvement is to restripe the southbound lanes at the bottleneck locations to serve traffic demand better. Figure 13 (Sections 1 and 2) shows the recommended improvements. After Exit 25, I-95 southbound would have three travel lanes instead of the current four lanes. The high-volume traffic entering I-95 southbound from I-90 would pick up the extra lane to head southbound on I-95. The modifications would provide the I-90 traffic merging onto I-95 southbound with an auxiliary lane, which would also address the issue of the inadequate acceleration lane at the merge area. Because of the high volume of traffic that exits the freeway at Exits 25 and 24 to I-90 and Route 30, respectively, subtracting a lane would not affect travel on I-95 southbound.
In addition to the new auxiliary lane for traffic from I-90 to merge onto I-95 southbound, MPO staff also proposes the following improvements:
The improvements were analyzed as freeway merge/diverge and basic freeway segments. Ramp LOS analysis for 2025, presented in Table 7 indicates that the improvements would improve traffic operations at the bottleneck.
The improvements are estimated to cost approximately $50,000 to construct.
TABLE 7
Freeway Segment Analysis: Improvement Alternatives
I-95 Southbound Segment between Exit 25 and Recreation Road
Freeway Component |
AM Density (pc/mi/ln) |
AM Speed (mph) |
AM LOS* |
PM Density (pc/mi/ln) |
PM Speed (mph) |
PM LOS* |
2025 With Improvements: Two-Lane Exit and Restripe Lanes to Serve Traffic Demand Better |
¾ |
¾ |
¾ |
¾ |
¾ |
¾ |
Diverge segment: Exit 25, I-90 |
12.2 |
45.5 |
B |
15.5 |
45.7 |
B |
Diverge segment: Exit 24, Route 30 |
33.0 |
48.3 |
D |
32.1 |
47.0 |
D |
Merge segment: Entrance ramp from Route 30 |
30.6 |
49.2 |
D |
32.1 |
48.8 |
D |
Merge segment: Entrance ramp from I-90 |
35.9 |
54.4 |
E |
34.5 |
54.8 |
D |
*LOS A through LOS D represent acceptable operating conditions; LOS E represents operating conditions at capacity; and LOS F represents failing conditions (demand exceeds capacity).
mph = miles per hour. pc/mi/ln = passenger cars per mile per lane
Source: Central Transportation Planning Staff.
MPO staff recommend two improvements for the I-90 interchange: designating an “Exit Only” lane at Exit 25, and subtracting a lane between Exit 25 and the entrance ramp from I-90. The proposed improvements would require approval from FHWA. MassDOT Highway District 4 office could easily produce the necessary documentation, which would be similar to the documentation that was submitted and approved for the I-95 northbound subtract-a-lane project at the I‑90 interchange.
The I-95 southbound subtract-a-lane improvement project at the I-90 interchange is expected to benefit from the I-95 Add-a-Lane project, which would remove a downstream bottleneck (lane drop) on I-95 southbound just north of Route 9 in Wellesley. The I-95 Add-a-Lane project includes bridge and roadway reconstruction, namely the installation of an additional 12-foot travel lane and 10-foot shoulder in each direction; this project is scheduled to be completed in spring 2019. Therefore, executing or planning the above-described improvements, which would benefit from the I-95 Add-a-Lane project, is very important.
Currently, as a result of bridge maintenance work on I-95 southbound in the vicinity of the study area, the MassDOT Highway Division has implemented some form of these improvements as a traffic management plan for the work zone.
MPO staff, working in conjunction with the MassDOT Highway staff, identified, developed, and evaluated improvements for two bottleneck locations in the MPO region. The study provides the MassDOT Highway Division with an opportunity to begin identifying the needs at the two bottleneck locations and to start planning design and engineering efforts. If implemented, these low-cost, short-term improvements would increase traffic safety, make traffic operations more efficient, and reduce congestion at the bottlenecks. The study aligns with the MPO goals of reducing congestion and increasing safety on the region’s highway system.
The MassDOT Highway Division is responsible for implementing the improvements recommended for the two bottleneck locations. The next steps are for the MassDOT Highway Division to examine the design of the improvement alternatives and work with the FHWA to advance the projects. Transportation decision-making is complex and is influenced by factors such as financial limitations and agency programmatic commitments. Project development is the process that takes a transportation improvement plan from concept to construction. Appendix E includes an overview of the MassDOT Highway Division’s project development process.
SA/sa
1 Federal Highway Administration, Recurring Traffic Bottlenecks: A Primer: Focus on Low-Cost Operations Improvements, US Department of Transportation, Federal Highway Administration, June 2009, p. 1.
2 Seth Asante, MPO staff, memorandum to the Transportation Planning and Programming Committee of the Boston Region Metropolitan Planning Organization, “Low-Cost Improvements to Bottleneck Locations, Phase I,” June 2, 2011.
3 Chen-Yuan Wang, MPO staff, memorandum to the Transportation Planning and Programming Committee of the Boston Region Metropolitan Planning Organization, “Low-Cost Improvements to Bottleneck Locations, Phase II,” March 12, 2012.
4 Seth Asante, MPO staff, memorandum to the Boston Region Metropolitan Planning Organization, “Low-Cost Improvements to Express-Highway Bottleneck Locations: Selection of Study Locations,” April 2, 2015.
5 Express-Highway Traffic Volumes, I-93 Southbound 2010 Balanced Traffic Volumes, Estimated by the Central Transportation Planning Staff.
6 Chen-Yuan Wang, Route 2 Improvements from Route 111 in Acton to Baker Avenue in Concord: A Feasibility Study, report produced by the Central Transportation Planning Staff for the Massachusetts Department of Transportation, February 2003.
7 Route 2 Reconstruction at the Concord Rotary, Concord Board of Selectmen Presentation, November 24, 2008.
8 Express-Highway Traffic Volumes, I-95 Northbound 2007 Balanced Traffic Volumes, Estimated by the Central Transportation Planning Staff.
9 Highway Capacity Manual 2010, Transportation Research Board of the National Academies, Washington, DC, December 2010.
10 Highway Capacity Software 2010, Version 6.65, McTrans Center, PO Box 116585, Gainesville, Florida, October 2014.
11 Crash Modification Factors Clearinghouse, US Department of Transportation Federal Highway Administration.
12 AM peak period begins at 6:00 AM and ends at 10:00 AM; PM peak period begins at 3:00 PM and ends at 7:00 PM.
13 Highway Capacity Software 2010, Version 6.65, McTrans Center, PO Box 116585, Gainesville, Florida, October 2014.
14 Crash Modification Factors Clearinghouse, US Department of Transportation Federal Highway Administration.
Low-Cost Bottlenecks Appendices A-E.pdf

