Goal:
Transportation by all modes will be safe.
Objectives:
People who travel by car, truck, bus, rail, bicycle, or on foot in the Boston region seek to travel safely, but often these modes compete for space and priority on the roadways. While roadway crashes overall have declined over time, recent increases in bicycle and pedestrian crashes and in serious injuries to pedestrians attest to the challenge of ensuring safety for all modes. Changes to travel patterns, caused in part by increased use of transportation network company (TNC) services (e.g., Uber and Lyft) and deliveries from online retail businesses, add to the many factors that affect safety on the region’s transportation system. Meanwhile, advancements in connected and autonomous vehicle (CAV) technology have the potential to generate safety benefits, but this technology may also change travel patterns and influence traveler behavior in ways that introduce new concerns.
Safe travel on the region’s transportation system is a top priority at the federal, state, and regional level. The federal Moving Ahead for Progress in the 21st Century Act (MAP-21) established a goal to achieve significant reductions in traffic fatalities and serious injuries on all public roads, which is also included in the Fixing America’s Surface Transportation (FAST) Act. To support improvements in transportation safety, the US Department of Transportation has required states, transit providers, and metropolitan planning organizations (MPO) to implement a performance-based approach to making investments to improve safety, which includes setting performance targets and monitoring safety outcomes. Similarly, the Massachusetts’ Strategic Highway Safety Plan (SHSP) includes a long-term goal to “Move toward Zero Deaths” by eliminating fatalities and serious injuries on the Commonwealth’s roadways.
While the MPO shares the federal and state goals of reducing crash severity for all users of the transportation system, the MPO is also taking steps to reduce the number of crashes, serious injuries, and fatalities at the regional level.
Reducing the number of transportation-related crashes, safety incidents, injuries, and fatalities as well as related property damage, pain, and suffering, is the Boston Region MPO’s highest priority. This focus is in line with federal and the Commonwealth of Massachusetts goals and Vision Zero policies that are being implemented by municipalities in the region. Potential projects that improve transportation safety in the region will need to account for all modes and employ a variety of strategies. Effective solutions will also require collaboration between the MPO, the Massachusetts Department of Transportation (MassDOT), other Commonwealth executive agencies, the region’s transit providers, municipalities, and other stakeholders.
Over the last several decades, the MPO has built a practice of analyzing roadway crash trends and crash locations. The MPO helps address key safety issues by recommending roadway design solutions for specific locations; creating tools and guidance to help municipalities address local safety issues; and investing in capital projects through the Long-Range Transportation Plan (LRTP) and Transportation Improvement Program (TIP) to improve safety.
Going forward, the MPO must continue to enhance practices of analyzing data, collecting public feedback, and applying staff expertise to recommend safety solutions. The MPO must also continue to apply LRTP and TIP evaluation and development processes that help identify and support projects likely to have safety benefits. The MPO should also continue to monitor the potential impacts that CAV technology will have on roadway user behavior and safety.
There are also areas where the MPO can expand activities to address transportation safety. The MPO will need to consider transit safety issues, data requirements, and needs when coordinating with the region’s transit providers to set federally required transit safety performance targets. The MPO should analyze transit safety trends on an ongoing basis, consider the potential safety benefits of projects for the Massachusetts Bay Transportation Authority (MBTA), Cape Ann Transportation Authority (CATA), MetroWest Regional Transit Authority (MWRTA), and MassDOT that are programmed in the TIP, and explore opportunities to support transit agencies’ safety initiatives and investments. The MPO should also continue to collaborate with safety practitioners, transportation agency representatives, municipalities, and others to identify both infrastructure and non-infrastructure approaches (such as education and awareness campaigns) to reduce fatalities, injuries, incidents, and other safety outcomes across all transportation modes and systems.
Table 4-1 summarizes key findings about safety needs that MPO staff identified through data analysis and public input. It also includes staff recommendations for addressing each need. A description of the types of recommendations presented in the table includes the following:
Chapter 10–Recommendations to Address Transportation Needs in the Region provides more detail on each of the recommendations. The MPO board should consider these findings when prioritizing programs and projects to receive funding in the LRTP and TIP, and when selecting studies and activities for inclusion in the Unified Planning Work Program (UPWP).
Table 4-1
Safety Needs in the Boston Region Identified through Data Analysis and Public Outreach and Recommendations to Address Needs
| Emphasis Area |
Issue |
Needs |
Recommendations to Address Needs |
|---|---|---|---|
Fatalities and serious injuries from roadway crashes |
Average number of fatalities and serious injuries from roadway crashes have declined over the past five years. However, a multi-strategy approach will be needed to eliminate roadway crash fatalities and injuries in the Boston region. |
Identify crash factors and countermeasures Consider capital investment, education, enforcement, and other approaches to improve roadway safety |
Existing Initiatives Coordinate with partner agencies to collect data that supports safety research and analysis Participate in road safety audits for roadway improvement projects Continue to collect and analyze safety data and monitor performance measures Existing Study Conduct TIP before-after studies to evaluate safety impacts of funded projects Proposed Study Study factors that may contribute to fatal and serious injury crashes on the region’s roadways Proposed Initiatives Publicize transportation safety-oriented education and awareness material through the MPO’s communication and public involvement channels Coordinate with other agencies and stakeholders on their approaches for addressing education, enforcement, and other factors that influence safety |
High crash locations |
The number of all crashes should be reduced. Crash cluster locations with high EPDO values indicate locations with high crash frequencies and/or where crashes are severe. |
Address the region’s top-ranking crash cluster locations. Address MassDOT-identified Top 200 high crash intersections in the Boston region (66 total), such as those on Route 9 in Framingham, Route 107 in Lynn and Salem, and Route 16 in Chelsea, Everett, and Medford. |
Existing Program Fund projects to improve safety at these locations through the MPO’s Intersection Improvements, Complete Streets, and Major Infrastructure investment programs Existing Studies Recommend solutions for specific locations through the Community Transportation Technical Assistance, Addressing LRTP Priority Corridors, Addressing Subregional Priority Roadways, and Low-Cost Solutions for Express Highway Bottlenecks studies Recommend solutions for specific locations through Safety and Operations at Selected Intersections studies New Initiative Publicize transportation safety-oriented education and awareness material through the MPO’s communication and public involvement channels |
Pedestrians |
In the Boston region, the number of pedestrian-involved crashes is increasing. Pedestrians were involved in a disproportionate share of roadway crashes resulting in fatalities (27 percent) and serious injuries (12 percent), based on a 2011–15 rolling annual average. Pedestrian safety was a top concern mentioned during the MPO’s outreach events. |
Address top-ranking pedestrian crash cluster locations, including those in downtown areas in Chelsea, Lynn, Quincy, Boston, and Framingham. Provide well-maintained, connected sidewalk networks. Improve pedestrian connections at intersections. Develop separated shared-use paths. |
Existing Program Fund projects to improve safety for pedestrians through the MPO’s Intersection Improvements, Complete Streets, and Bicycle and Pedestrian investment programs Existing Studies Recommend solutions for specific locations through Community Transportation Technical Assistance, Addressing LRTP Priority Corridors, Addressing Subregional Priority Roadways studies Use the MPO’s Pedestrian Report Card Assessment tool to analyze pedestrian safety and walkability Recommend solutions for locations with high pedestrian crash rates or pedestrian fatalities or injuries Proposed Study Recommend safety solutions for people traveling to transit stops or stations |
Bicyclists |
In the Boston region, bicyclists account for a disproportionate share of roadway crash fatalities (four percent) and serious injuries (five percent) based on a 2011–15 rolling annual average. Bicycle safety was a top concern mentioned during the MPO’s public outreach events. |
Address top-ranking bicycle crash cluster locations, including those in Boston, Cambridge, and Somerville. Develop separated shared-use paths and protected bike lanes. Develop a connected bicycle network. |
Existing Program Fund projects to improve safety for bicyclists through the MPO’s Intersection Improvements, Complete Streets, and Bicycle and Pedestrian investment programs Existing Studies Recommend solutions for specific locations through Community Transportation Technical Assistance, Addressing LRTP Priority Corridors, Addressing Subregional Priority Roadways studies Use the MPO’s Bicycle Report Card Assessment tool to analyze pedestrian safety and walkability Proposed Study Recommend solutions for locations with high bicycle crash rates or bicycle fatalities or injuries |
Trucks |
Truck-involved crashes account for approximately six percent of total motor vehicle crashes in the Boston region; however truck and large vehicle crashes account for 10 percent of roadway fatalities according to a 2011–15 rolling annual average. |
Address top truck crash cluster locations. Modernize obsolete interchanges, such as the I-90 and I-95 interchange in Weston and the I-95 and Middlesex Turnpike interchange in Burlington. |
Existing Program Fund projects to improve safety for trucks through the MPO’s Intersection Improvements, Complete Streets, and Major Infrastructure investment programs Proposed Program Fund projects to improve truck safety through an MPO Interchange Modernization investment programs Existing Study Recommend solutions for specific locations through Low-Cost Solutions for Express Highway Bottleneck studies |
Multimodal roadway usage |
Cars, trucks, buses, bicyclists, pedestrians, and others compete for space and travel priority in constrained roadway environments. Delivery vehicles transporting online purchases and TNC vehicles picking up or dropping off passengers also compete for curb space and create conflicts. Both of these factors can create unsafe conditions for travelers. |
Incorporate Complete Streets design and traffic calming principles in roadway projects. Identify strategies to manage roadway user priority, parking, and curb space. |
Existing Study Apply or support safety- relevant findings from the MPO’s Future of the Curb study (FFY 2019 UPWP) |
Transit safety |
The MBTA reported recent increases in fatalities on its system, particularly on the commuter rail. The MBTA and the RTAs in the Boston region must continue to monitor and reduce bus collisions, derailments, and other accidents that may contribute to negative safety outcomes. |
Collect and analyze safety data, establish transit safety performance measures, and monitor the measures. Identify and invest in priority state-of-good-repair and modernization projects (e.g. positive train control and rapid transit vehicle upgrades). Coordinate with transit providers and partner agencies on safety education and awareness initiatives. |
Proposed Program Fund projects to improve transit safety through an MPO Transit State of Good Repair and Modernization investment programs
|
Connected and Autonomous Vehicles |
CAV technology is advancing. While CAV applications may reduce instances of human driver error, limiting factors such as inclement weather and device inoperability, may reduce their safety effectiveness. Riskier driver, pedestrian, and other roadway user behavior may offset safety benefits. |
Monitor advancements in CAV technology. Monitor and analyze safety impacts of CAV deployments, particularly in the Boston region. |
Proposed Study Research safety outcomes of autonomous vehicle testing in Boston or other metropolitan areas. |
CAV = Connected and Autonomous Vehicles.
EPDO = Equivalent Property Damage Only.
FFY= federal fiscal year.
LRTP= Long-Range Transportation Plan.
MassDOT = Massachusetts Department of Transportation.
MBTA = Massachusetts Bay Transportation Authority.
MPO = metropolitan planning organization.
RTA = regional transit authority.
TNC = transportation network company.
UPWP = Unified Planning Work Program.
Source: Boston Region MPO.
This section presents the research and analysis MPO staff conducted to understand transportation safety needs in the Boston region, which have been summarized in the previous section. Supporting information that MPO staff used to understand safety needs is included in the Appendices of this Needs Assessment.
This section also includes a summary of input staff gathered from stakeholders and the public about transportation safety needs and proposed solutions to meet those needs. Staff considered this input when developing recommendations to achieve the MPO’s safety goals and objectives.
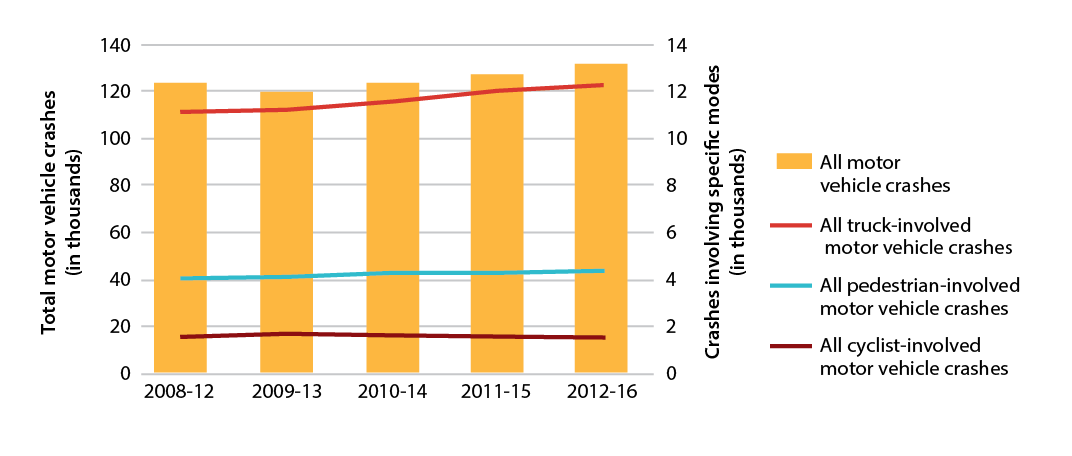
The Commonwealth of Massachusetts and the MPO track traffic crashes using information from the Massachusetts Crash Data System.1 Figure 4-1 shows recent trends in Massachusetts for all motor vehicle crashes, along with those that involve bicyclists, pedestrians, or trucks. In this chart and the other roadway safety charts that follow, data is presented in rolling five-year annual averages for the years 2008 through 2016. As shown in the chart, the average number of total motor vehicle crashes in Massachusetts increased by 7.8 percent over the analysis period, those involving trucks increased by 12.4 percent, and those involving bicycles decreased by less than one percent. Meanwhile, the average number of crashes involving pedestrians increased by 14.2 percent.
Figure 4-1
Motor Vehicle Crashes in Massachusetts

Sources: Massachusetts Crash Data System and Boston Region MPO.
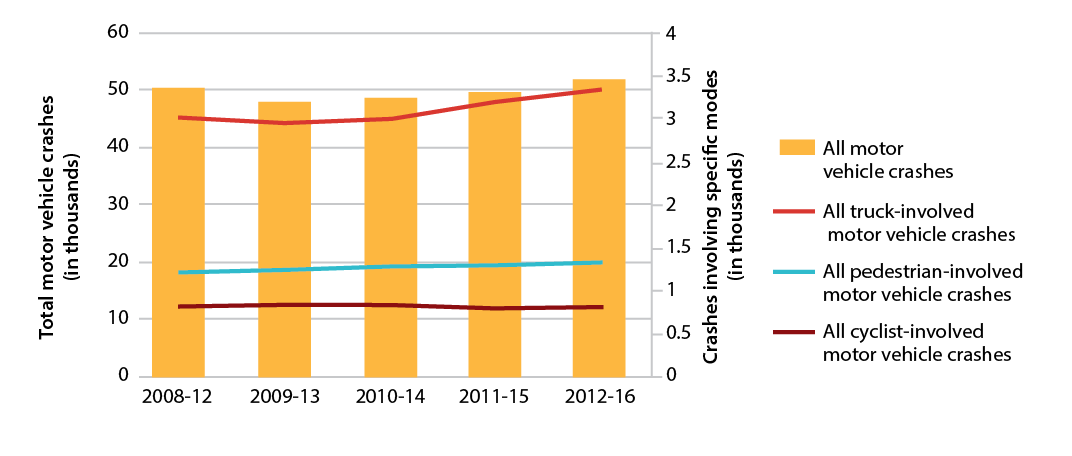
Figure 4-2 provides crash data specific to the 97 municipalities in the Boston region. During the analysis period, the average number of total motor vehicle crashes increased by 3.2 percent, while Massachusetts as a whole experienced an increase of 7.8 percent. In the Boston region, the average number of truck-involved crashes increased by 10.4 percent, the average number of bicycle-involved crashes decreased by 1.1 percent, and the average number of pedestrian-involved crashes increased by 10.8 percent. These results indicate that the Boston region is experiencing similar trends in nonmotorized crashes compared to Massachusetts as a whole.
Figure 4-2
Motor Vehicle Crashes in the Boston Region MPO
Sources: Massachusetts Crash Data System and Boston Region MPO.
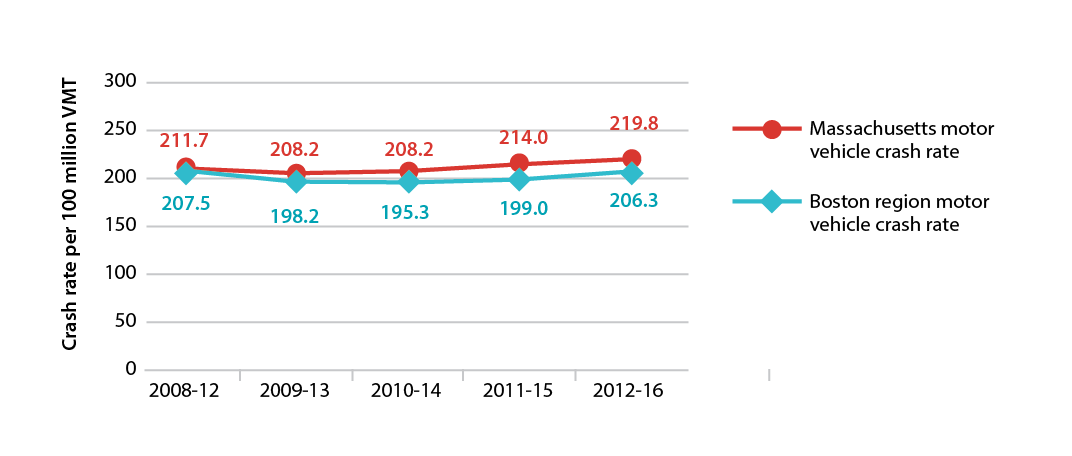
Figure 4-3 compares the crash rates per 100 million vehicle-miles traveled (VMT) for Massachusetts to the crash rate for the Boston region. Over the analysis period, the motor vehicle crash rate in Massachusetts as a whole increased by 3.8 percent, while the rate for the Boston region decreased by less than one percent.
Figure 4-3
Motor Vehicle Crash Rates per 100 Million Vehicle-Miles Traveled
VMT = vehicle-miles traveled.
Sources: Massachusetts Crash Data System and Boston Region MPO.
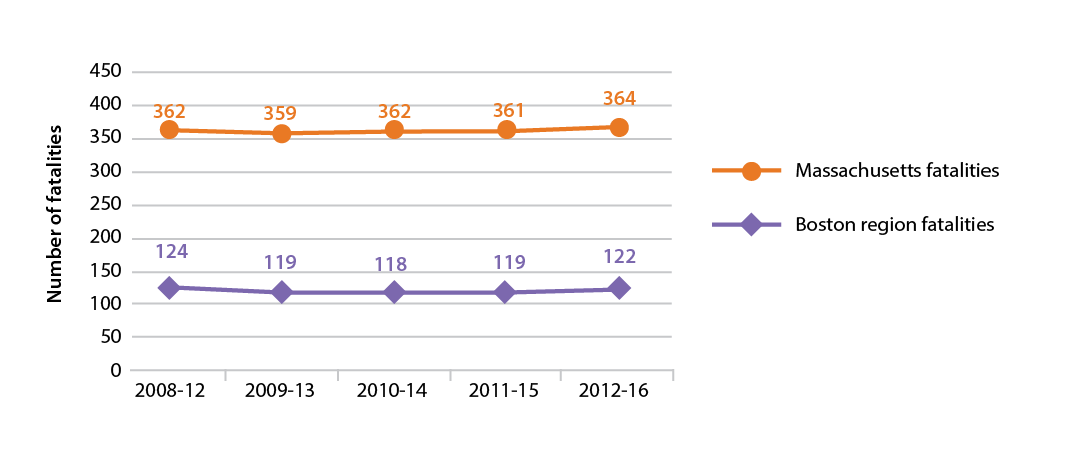
The Commonwealth and the Boston Region MPO monitor crash outcomes, fatalities, and serious injuries, using information reported to the federal Fatality Analysis and Reporting System (FARS) and the Massachusetts Crash Data System. 2 Several of the charts describing crash outcomes below, including Figures 4-4 through 4-10, show information for federally required roadway safety performance measures, for which states and MPOs are required to set annual performance targets. More information about MPO performance targets is included in Table 4-8. Figure 4-4 shows recent trends in fatalities at the Massachusetts and MPO levels. At both the Massachusetts and Boston region levels, five-year annual rolling averages for fatalities have been relatively stable in recent years, with Massachusetts showing a less than one percent increase and the Boston region showing a 1.1 percent decrease.
Figure 4-4
Fatalities from Motor Vehicle Crashes
Note: States and MPOs monitor this roadway safety measure to meet federal performance requirements.
Sources: Federal Fatality Analysis Reporting System and MassDOT.
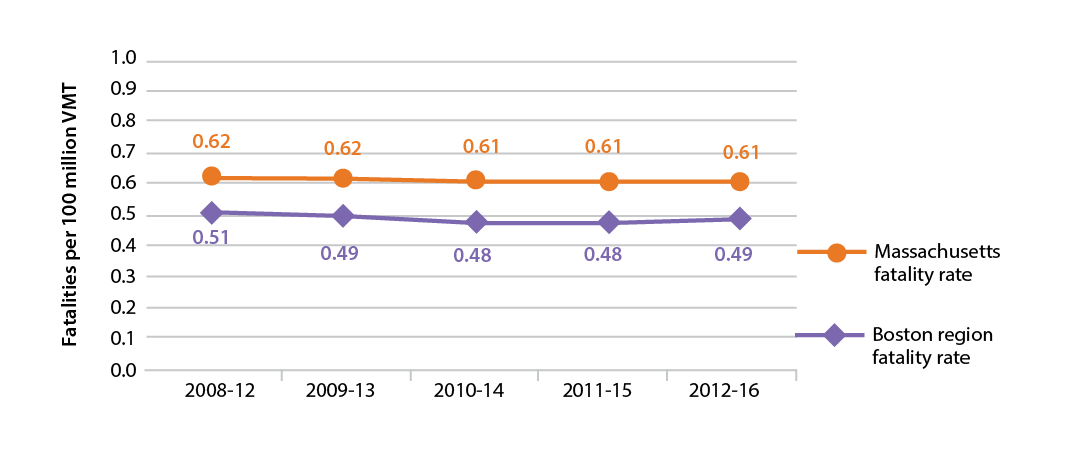
Figure 4-5 shows recent trends in the fatality rate per 100 million VMT for both Massachusetts as a whole and for the Boston region. At the Massachusetts and Boston region levels, average fatality rates have been declining over time, with the state showing a three percent decrease and the Boston region showing a 4.7 percent decrease. These declines may be partially attributed to a slight increase in VMT.
Figure 4-5
Fatality Rate per 100 Million Vehicle-Miles Traveled
Note: States and MPOs monitor this roadway safety measure to meet federal performance requirements
VMT = vehicle-miles traveled.
Sources: Federal Fatality Analysis Reporting System and MassDOT.
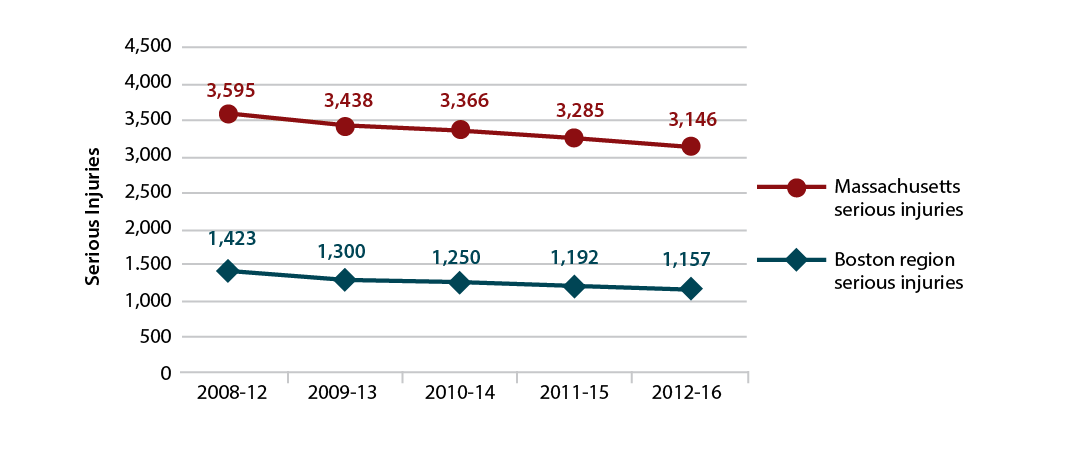
Figure 4-6 shows recent trends in serious injuries at the Massachusetts and Boston region levels.3 The number of serious injuries from motor vehicle crashes declined between 2008 and 2016 both statewide and in the Boston region. It decreased by 12.5 percent statewide and by 18.7 percent in the Boston region.
Figure 4-6
Serious Injuries from Motor Vehicle Crashes
Note: States and MPOs monitor this roadway safety measure to meet federal performance requirements
Sources: Massachusetts Crash Data System and MassDOT.
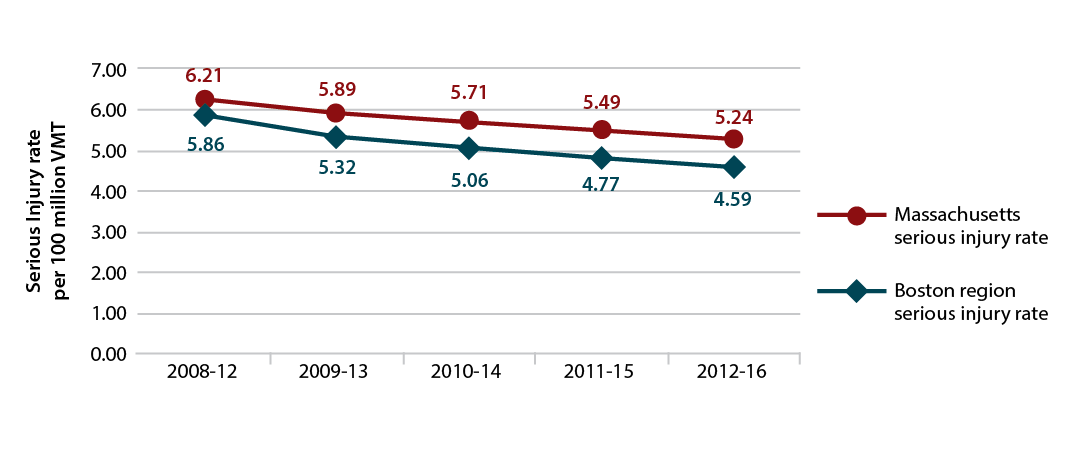
Figure 4-7 shows recent trends in the average serious injury rate per 100 million VMT for both Massachusetts as a whole and for the Boston region. These rates have been decreasing over time at both the state and Boston region levels; it decreased by 15.1 percent statewide and by 21.7 percent in the Boston region.
Figure 4-7
Serious Injury Rate per 100 Million Vehicle-Miles Traveled
Note: States and MPOs monitor this roadway safety measure to meet federal performance requirements.
VMT = vehicle-miles traveled.
Sources: Massachusetts Crash Data System and MassDOT.
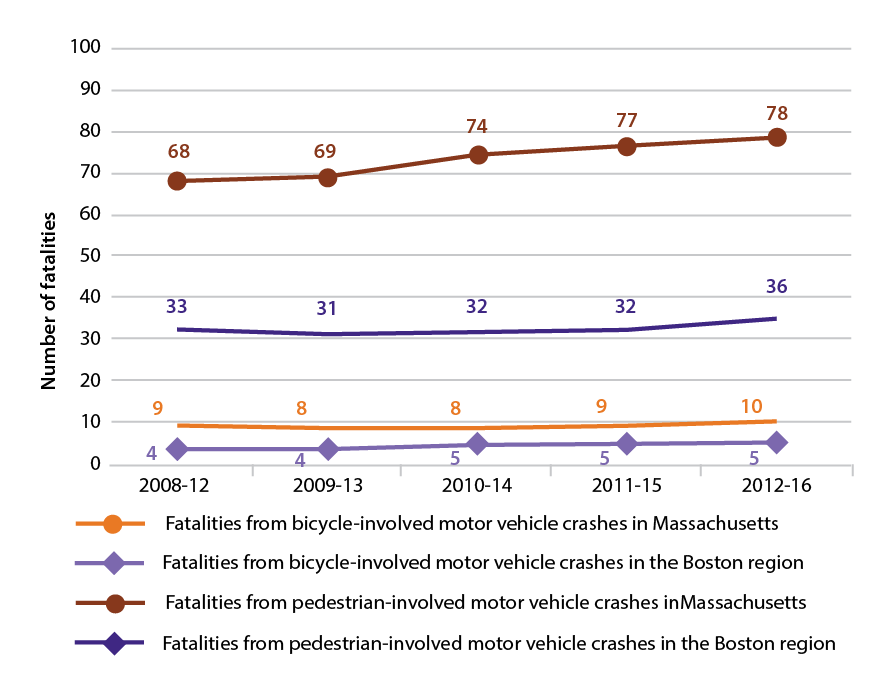
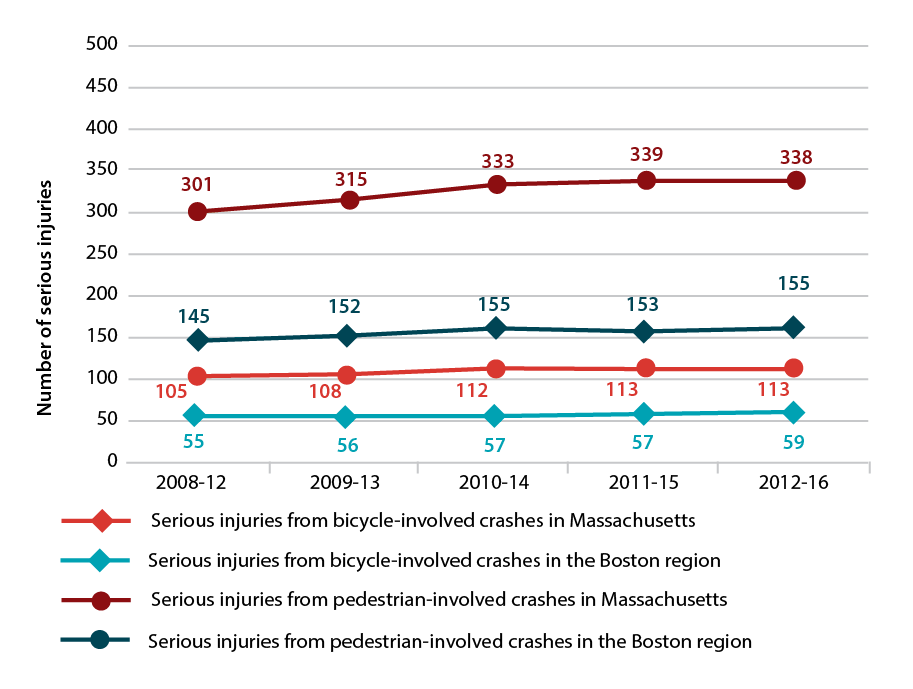
Figures 4-8 and 4-9 present data about fatalities and serious injuries from bicycle- or pedestrian-involved crashes. As noted in Figures 4-1 and 4-2, crashes involving pedestrians have been increasing over time at both the Boston region and statewide levels. Figure 4-8 shows that fatalities from bicyclist- or pedestrian-involved crashes have remained relatively stable at the Boston region level, but at the Massachusetts level, fatalities from pedestrian-involved crashes are increasing. Figure 4-9 shows changes in serious injuries from pedestrian- and bicyclist-involved crashes at both the Boston region level (6.8 percent and 7.3 percent, respectively) and Massachusetts level (12.4 percent and 7.6 percent respectively). Similar to pedestrian-involved crashes that resulted in fatalities, pedestrian-involved crashes that resulted in serious injuries are increasing at the state level.
Figure 4-8
Fatalities from Bicyclist- or Pedestrian-involved Crashes
Sources: Federal Fatality Analysis Reporting System, Massachusetts Crash Data System, and MassDOT.
Figure 4-9
Serious Injuries from Bicycle- or Pedestrian-involved Crashes
Sources: Federal Fatality Analysis Reporting System, Massachusetts Crash Data System, and MassDOT.
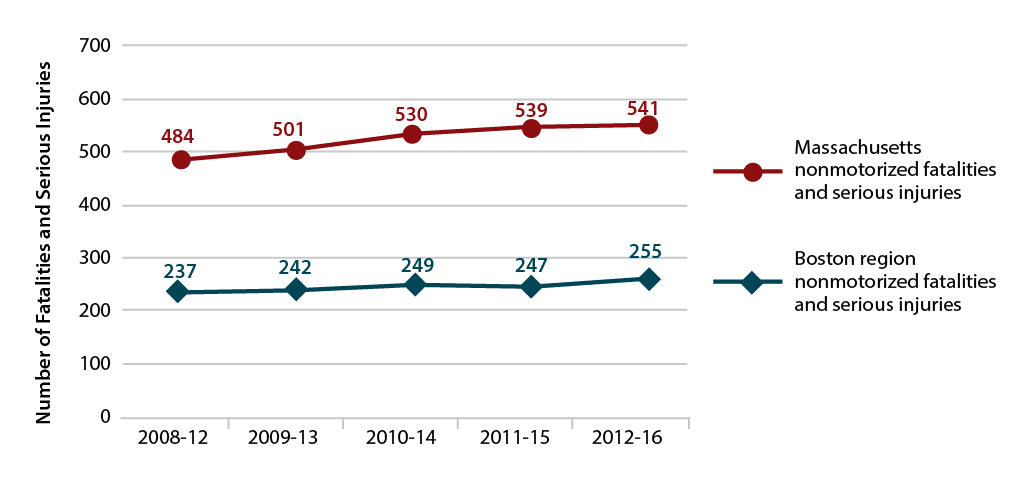
Figure 4-10 presents nonmotorized fatalities and serious injuries for both Massachusetts and the Boston region. This measure includes fatalities and injuries from bicycle- or pedestrian-involved crashes as well as those from crashes involving other nonmotorized modes, such as skateboards, per federal requirements for highway safety performance measures. During the analysis period, nonmotorized fatalities and serious injuries increased by approximately 11.7 percent in Massachusetts as a whole and by approximately 7.6 percent in the Boston region.
Figure 4-10
Nonmotorized Fatalities and Serious Injuries
Note: States and MPOs monitor this roadway safety measure to meet federal performance requirements.
Sources: Federal Fatality Analysis Reporting System, Massachusetts Crash Data System, and MassDOT.
When creating its 2013 SHSP, the Commonwealth identified safety emphasis areas by examining the factors that contribute to motor vehicle crashes that result in fatalities and serious injuries. The sections below discuss specific safety emphasis areas. In each emphasis area, the percentages of fatalities or injuries involving a particular crash factors are expressed in 2011–15 rolling averages.4 Individual motor vehicle crashes can involve a number of different factors; tracking their prevalence can help inform strategies to improve transportation safety.
MassDOT reports that 32 percent of fatalities and 40 percent of serious injuries from motor vehicle crashes in the Boston region were related to crashes at intersections. These values are slightly higher than for Massachusetts overall, where 27 percent of fatalities and 39 percent of serious injuries were related to crashes at intersections. The Boston region includes 66 of the Top 200 Intersection Crash Locations identified in MassDOT’s 2015 Top Crash Locations Report.5 ,6 , Corridors with multiple Top 200 Intersection Crash Locations include the following:
The section of this chapter titled High Crash Locations discusses other MassDOT-identified high crash locations in detail.
MassDOT describes a lane departure crash as one that occurs after a vehicle crosses a roadway edge or centerline or otherwise leaves the travel lane. MassDOT reports that in the Boston region, 50 percent of traffic fatalities occurred in roadway departure crashes, compared to 56 percent for Massachusetts as a whole. In particular, 41 percent of traffic fatalities occurred in roadway departures not near intersections, compared to 47 percent for Massachusetts. MPO staff analyzed the locations with various subtypes of lane departure crashes using 2013–15 crash data, and found that these crashes are prevalent on expressways along I-93 between I-90 and I-95 northbound; I-93 between I-90 and I-95 southbound; and I-90 in Boston, Newton, and Weston. For arterials, MPO staff noted that lane departure crashes were prevalent along Route 3 in Weymouth; Route 1 in Chelsea, Everett, and Revere; Route 16 in Everett; Soldiers Field Road in Boston; and Route 9 in Newton and Wellesley.
MassDOT reports that 23 percent of fatalities and 13 percent of incapacitating injuries occurred in pedestrian-involved crashes in the Boston region. These values are higher than Massachusetts-level values (21 percent and 10 percent, respectively). Meanwhile, four percent of fatalities and five percent of serious injuries occurred in bicycle-involved crashes, compared to three percent of fatalities and three percent of incapacitating injuries throughout Massachusetts. These findings for fatalities and serious injuries, like others in the Roadway Crash Factors section, 2011-15 rolling averages.The section of this chapter titled Roadway High Crash Locations discusses MassDOT-identified high crash locations for pedestrians and bicyclists.
MassDOT reports that 12 percent of fatalities occurred in crashes involving large vehicles, such as trucks or buses, in the Boston region. By comparison, 10 percent of motor vehicle crash fatalities in Massachusetts involved these vehicles. Six percent of serious injuries occurred in crashes involving large vehicles in both Massachusetts as a whole and in the Boston region specifically. The section of this chapter titled Roadway High Crash Locations discusses MassDOT-identified high-truck-crash locations. Meanwhile, 13 percent of fatalities and nine percent of serious injuries occurred in crashes involving motorcycles in the Boston region.
The MPO spends federal transportation dollars primarily on capital transportation projects, such as intersection or Complete Streets roadway improvements. As a result, the MPO pays particular attention to the modes and infrastructure involved in crashes to determine how it may support safety improvements. However, other considerations and safety emphasis areas, such as those pertaining to driver characteristics and behaviors, should also be considered when planning to improve highway safety. Table 4-2 shows the percent of fatalities or serious injuries in the Boston region and Massachusetts that involved driver-related crash factors. Table 4-2 also shows that some factors are more prevalent in motor vehicle crashes resulting in fatalities and serious injuries at the Boston region level than for Massachusetts as a whole, and vice versa. In particular, the involvement of young drivers or older drivers is a factor in a smaller share of Boston region fatalities than for fatalities in Massachusetts overall. Meanwhile, these drivers are involved in larger shares of crashes that result in serious injuries in the Boston region than serious injuries in Massachusetts overall.
Table 4-2
Share of Motor Vehicle Crash Fatalities and Serious Injuries
Related to Crash Factors
Crash Factor |
Percent of Massachusetts Fatalities |
Percent of Boston Region Fatalities |
Percent of Massachusetts Serious Injuries |
Percent of Boston Region Serious Injuries |
Lack of Occupant Protection (e.g., Seat belt use)a |
49% |
48% |
12% |
10% |
Alcohol-impaired Driving |
34% |
34% |
1% |
1% |
Speeding |
28% |
27% |
3% |
2% |
Young Driversb |
11% |
11% |
3% |
14% |
Older Driversb |
20% |
4% |
16% |
19% |
Note: Percentages reflect 2011–15 rolling averages for the Commonwealth and a 101-municipality Boston region that includes four towns that are no longer in the Boston Region MPO’s planning area (Duxbury, Hanover, Pembroke, and Stoughton).
a Fatalities and serious injuries in this category only reflect those experienced by motorists.
b Young drivers are defined as those between 15 and 20 years old, while older drivers are defined as those ages 65 and older.
Sources: Federal Fatality Analysis Reporting System, Massachusetts Crash Data System, and MassDOT.
MassDOT accounts for these factors as well as the roadway characteristic and transportation mode factors (discussed earlier in this section) when it develops safety initiatives and coordinates with municipalities throughout the Commonwealth. Going forward, MassDOT will be putting increased emphasis on other factors, such as driver inattention, to address safety issues on the Commonwealth’s roadways. The MPO can be attentive to these driver characteristics and behaviors when conducting its own safety planning, and can look for opportunities to publicize and otherwise support MassDOT initiatives that address these areas.
To address crashes, fatalities, and injuries on the Boston region’s roadway network, the Boston Region MPO examines MassDOT-identified crash-cluster locations and uses these as indicators of where safety issues may be present. MassDOT creates these crash clusters using a procedure for processing, standardizing, matching, and aggregating crash data from the MassDOT Registry of Motor Vehicles by geographic location.7 Crash severity is measured using the Equivalent Property Damage Only (EPDO) index, which assigns higher weighted values to crashes involving fatalities or injuries than to those only involving property damage. MassDOT establishes a set of high priority all-mode, bicycle, and pedestrian crash cluster locations by selecting the top five percent of each type of cluster for each regional planning area, using a ranking scheme that accounts for EPDO index values. Projects that aim to address safety needs in areas where these clusters are located are eligible for federal Highway Safety Improvement Program (HSIP) program funding, which supports roadway safety improvements. When evaluating TIP projects, MPO staff notes where projects are located with respect to each of these types of clusters. This information helps the MPO identify whether projects are addressing locations that have relatively high crash incidences and/or high fatality and injury incidences.
The following sections discuss top-ranked crash-cluster locations in the Boston region. The tables in these sections provide details about crash cluster locations; however these locations are best viewed spatially to understand the area encompassed by the crash cluster. Details on these crash clusters are available in the MPO’s LRTP Needs Assessment application at https://www.ctps.org/maploc/www/apps/lrtpNeedsAssessmentApp/index.html. Details on HSIP-eligible all-mode, bicycle, and pedestrian crash clusters are available using MassDOT’s interactive crash cluster map at https://gis.massdot.state.ma.us/topcrashlocations/. Chapter 8, on transportation equity needs, provides more information on where these crash clusters are located with respect to MPO-defined transportation equity zones (TEZs). These TEZs reflect areas where specific populations (including minorities, people with disabilities, youth, the elderly, and people with limited English proficiency) or types of households (including low-income and transit dependent households) exceed regional thresholds. Understanding where these populations are located with respect to high crash locations helps the MPO to address transportation safety needs in equitable ways.
This chapter discusses MassDOT all-mode HSIP clusters created using 2013–15 crash data. There are 993 crash clusters in the Boston region. Table 4-3 presents all-mode crash clusters with an EPDO index value greater than 150, along with information about the other cluster types these clusters intersect. These top-ranked all-mode clusters are also discussed in Chapter 8, which provides information about whether these all-mode clusters are located in MPO-identified TEZs. Table 4-3 shows that many, but not all, of these locations are on interstate segments or at interchanges. Many of these locations are in Inner Core municipalities, although these all-mode crash cluster locations exist throughout the Boston region.
Table 4-3
Top-Ranked HSIP Eligible All-Mode Crash Clusters
| All-Mode Crash Cluster Location |
Municipality |
Cluster EPDO Value |
Intersects Expressway |
Intersects Arterial Route |
Intersects HSIP Bicycle |
Intersects HSIP |
Intersects MPO Staff-identified Truck Crash Cluster(s) |
Intersects |
Included in Charting Progress to 2040 Top 25 Highway Crash Locations |
|---|---|---|---|---|---|---|---|---|---|
Interstate 93 at Columbia Road (north of Exit 15) |
Boston |
638 |
X |
|
|
|
X |
|
X |
Middlesex Turnpike at Interstate 95 |
Burlington |
577 |
X |
X |
|
|
X |
|
X |
Interstate 93 at Interstate 95 |
Reading |
496 |
X |
|
|
|
X |
|
X |
Interstate 93 at North Washington Street |
Boston |
491 |
X |
|
|
X |
X |
|
X |
Interstate 93 near ramps to Furnace Brook Parkway (north of Exit 8) |
Quincy |
405 |
X |
|
|
|
X |
|
X |
Interstate 95 at Route 4 (Bedford Street) |
Lexington |
399 |
X |
X |
|
|
X |
|
X |
Interstate 93 at Route 3A (Gallivan Boulevard/ |
Boston |
391 |
X |
|
|
|
X |
|
X |
Interstate 93 at Granite Avenue (Exit 11) |
Milton |
391 |
X |
|
|
|
X |
|
X |
Route 9 at Interstate 95 |
Wellesley |
374 |
X |
X |
|
|
X |
|
X |
Interstate 93 (northbound) near Exit 23 (Government Center) |
Boston |
349 |
X |
|
|
|
X |
|
|
Interstate 95 at ramps to Neponset Street |
Norwood |
348 |
X |
|
|
|
X |
|
|
Route 62 (Elliot Street) near Route 128 |
Danvers |
326 |
X |
X |
|
|
X |
|
|
Interstate 93 near ramps for Furnace Brook Parkway (south of Exit 8) |
Quincy |
315 |
X |
|
|
|
X |
|
|
Interstate 93 at Montvale Avenue |
Woburn, Stoneham |
310 |
X |
|
|
|
X |
|
|
Interstate 93 at ramps to Victory Road (south of Exit 13) |
Boston |
305 |
X |
|
|
|
X |
|
|
East Street Rotary at East and Canton streets |
Westwood |
294 |
|
|
|
|
|
|
X |
Interstate 93 at Columbia Road (south of Exit 15) |
Boston |
290 |
X |
|
|
|
X |
|
|
Interstate 93 (northbound) at ramp to Interstate 95 |
Stoneham |
281 |
X |
|
|
|
|
|
|
Route 3 at ramps to Route 18 (Main St) (Exit 16) |
Weymouth |
273 |
X |
|
|
|
X |
|
X |
Interstate 93 at Morrissey Boulevard |
Boston |
266 |
X |
|
|
|
X |
|
|
Interstate 93 (northbound) at Route 37 (Granite Street) |
Braintree |
265 |
X |
|
|
|
X |
|
X |
Interstate 95 at Route 3 |
Burlington |
262 |
X |
X |
|
|
X |
|
|
Interstate 93 (southbound) near East Berkeley Street |
Boston |
260 |
X |
|
|
|
X |
|
|
Interstate 93 at Leverett Connector |
Boston |
251 |
X |
|
|
|
X |
|
X |
Interstate 93 (southbound) at Exit 23 (I-90 to Purchase Street) |
Boston |
240 |
X |
|
|
|
X |
|
|
Interstate 495 at Route 2 |
Littleton |
233 |
X |
|
|
|
X |
|
|
Route 18 (Main Street) at West Street |
Weymouth |
229 |
|
X |
|
|
X |
X |
X |
Route 37 (Granite Street) at Forbes Road |
Braintree |
228 |
|
X |
|
|
X |
X |
|
Interstate 93 (northbound) at ramps to Route 3 |
Braintree |
227 |
X |
|
|
|
X |
|
|
Interstate 93 (near ramps to Granite Avenue) |
Milton |
225 |
X |
|
|
|
X |
|
|
Route 28 at Route 3 (Leverett Circle) |
Boston |
221 |
X |
X |
|
|
X |
|
|
Route 28 at Route 16 |
Medford |
220 |
X |
X |
|
X |
X |
X |
|
Route 3A (Southern Artery) at Broad Street |
Quincy |
218 |
|
X |
|
X |
|
X |
|
Interstate 93 south of Exit 20 (Massachusetts Avenue Connector) |
Boston |
218 |
X |
|
|
|
X |
|
|
Route 28 (Embankment Road) at Route 3 (near Longfellow Bridge) |
Boston |
215 |
X |
|
|
X |
|
|
|
Route 1 at Route 129 |
Lynnfield |
213 |
X |
X |
|
|
X |
X |
X |
Interstate 95 at Route 30 (north of Exit 24) |
Weston |
203 |
X |
|
|
|
X |
|
|
Route 1 at Salem Street |
Malden, Revere |
200 |
X |
|
|
|
X |
|
|
Interstate 93 near Upton Street |
Quincy |
198 |
X |
|
|
|
X |
|
|
Interstate 95 at Totten Pond Road |
Waltham |
198 |
X |
|
|
|
X |
|
|
Interstate 93 (southbound) at Route 37 (Granite Street) |
Braintree |
197 |
X |
|
|
|
X |
|
|
Morton Street at Harvard Street |
Boston |
195 |
|
X |
|
|
|
X |
|
Interstate 93 near Long Wharf |
Boston |
194 |
X |
|
|
|
X |
|
|
Interstate 95 at Route 2 |
Lexington |
193 |
X |
X |
|
|
X |
|
X |
Interstate 90 near Oak Street |
Weston |
191 |
X |
|
|
|
X |
|
|
Massachusetts Avenue near Memorial Drive |
Cambridge |
190 |
X |
X |
X |
|
X |
X |
|
Route 1 (Newburyport Turnpike) at Route 1 Connector |
Peabody |
189 |
X |
|
|
|
X |
X |
|
Condon Circle at Salem Street |
Lynnfield, Lynn |
187 |
|
X |
|
|
X |
|
|
Interstate 95 (northbound) at Route 20 |
Waltham |
185 |
X |
|
|
|
X |
X |
|
Route 85 (Cedar Street) at Fortune Boulevard |
Milford |
181 |
|
X |
|
|
X |
X |
|
Interstate 93 at Massachusetts Avenue Connector |
Boston |
180 |
X |
X |
|
|
X |
X |
|
Interstate 93 (near Zakim Bridge) |
Boston, Cambridge |
179 |
X |
X |
|
|
X |
|
|
Interstate 95 at ramps to Route 16 |
Newton |
178 |
X |
|
|
|
X |
|
|
Interstate 95 (southbound) at Route 20 |
Waltham |
176 |
X |
|
|
|
X |
|
|
Interstate 93 at Route 138 (Washington Street) |
Canton |
172 |
X |
X |
|
|
X |
|
X |
Union Street Rotary at ramp to Route 3 (southbound) |
Braintree |
171 |
|
|
|
|
X |
|
|
Route 2 at Reformatory Circle |
Concord |
170 |
X |
X |
|
|
X |
|
|
Hammond Pond Parkway at Route 9 (Boylston Street) |
Newton |
167 |
|
X |
|
|
X |
|
|
Route 126 (Hartford Avenue) at Deerfield Lane |
Bellingham |
166 |
|
X |
|
|
|
X |
|
Interstate 95 at Route 135 |
Dedham |
164 |
X |
X |
|
|
X |
|
|
Route 18 (Main Street) at Pond and Pleasant streets |
Weymouth |
164 |
|
X |
|
|
|
X |
|
Interstate 93 at ramps to Frontage Road (southbound)/SouthHampton Street |
Boston |
163 |
X |
|
|
|
X |
|
|
Revere Beach Parkway at Webster Avenue |
Chelsea |
162 |
|
X |
|
|
X |
X |
|
Interstate 95 (northbound) at ramps to East Street |
Westwood |
160 |
X |
|
|
|
X |
|
|
Interstate 93 northbound at ramp to South Main Street |
Foxborough |
159 |
X |
|
|
|
X |
|
|
Route 3 northbound at ramp to Derby Street |
Hingham |
158 |
X |
|
|
|
X |
|
|
Broadway at Route 129 (Lynnfield Street) |
Lynn |
158 |
|
X |
|
|
X |
X |
|
Route 3 southbound at ramp to Union Street |
Braintree |
158 |
X |
|
|
|
X |
X |
|
Route 9 (Worcester Road) at Cochituate Road |
Framingham |
155 |
|
X |
|
|
|
X |
|
Interstate 95 northbound at ramp to Washington Street |
Woburn |
154 |
X |
|
|
|
|
|
|
Interstate 90 at ramps to Interstate 95 |
Weston |
152 |
X |
|
|
|
X |
|
|
Soldiers Field Road at North Harvard Street |
Boston |
152 |
|
X |
|
|
X |
|
|
Route 1A at Premium Outlets Boulevard |
Wrentham |
151 |
|
X |
|
|
X |
X |
|
Route 9 (Worcester Road) west of Caldor Road |
Framingham |
150 |
|
X |
|
|
|
|
|
Interstate 93 at Derby Street |
Hingham |
150 |
X |
|
|
|
X |
|
|
Note: Clusters were selected from Massachusetts 2013–15 HSIP-eligible All-mode Crash Clusters for the Boston region. Expressway and arterial routes are based on designations from the Boston Region’s Congestion Management Process. Massachusetts top crash locations were identified using data in the MassDOT 2015 Top Crash Locations Report, March 2018, available at mass/gov/lists/top-high-crash-locations-by-year.
EPDO = Equivalent Property Damage Only.
HSIP = Highway Safety Improvement Program.
Sources: Massachusetts Department of Transportation and Boston Region MPO.
MassDOT established a set of HSIP-eligible bicycle clusters using 2006–15 crash data and a 100-meter buffer around the locations of crashes involving bicycles. There are 54 bicycle crash clusters in the Boston region. Table 4-4 presents 10 bicycle crash cluster locations with an EPDO index value greater than 100, along with information about the other cluster types that these clusters intersect.
Table 4-4
Top-Ranked HSIP Eligible Bicycle Crash Clusters
Bicycle Crash Cluster Area |
Municipality |
Cluster EPDO Value |
Intersects Arterial Route |
Intersects HSIP Pedestrian Crash Cluster(s) |
Intersects Other HSIP Bicycle Crash Cluster(s) |
Intersects All-Mode HSIP Crash Cluster(s) |
Intersects MPO Staff-Identified Truck Crash Cluster(s) |
Intersects Massachusetts Top Crash Location(s) |
Massachusetts Avenue (from Harvard Square to Memorial Drive) |
Cambridge |
989 |
X |
X |
X |
X |
X |
X |
Beacon and Hampshire streets and Broadway (Park Street to Galileo Galleli Way) |
Cambridge, Somerville |
942 |
|
X |
X |
X |
|
|
Massachusetts Avenue (near Porter Square) |
Cambridge, Somerville |
525 |
X |
X |
X |
X |
X |
|
Somerville Avenue, Summer Street, and Bow Street (near Union Square) |
Somerville |
213 |
|
X |
X |
|
|
|
Cambridge Street (Quincy Street to Maple Avenue, near Harvard Square) |
Cambridge, Somerville |
139 |
|
X |
X |
|
|
|
Broadway and Inman Street (near Central Square) |
Cambridge |
125 |
|
X |
X |
|
|
|
Massachusetts Avenue near Cedar Street |
Cambridge |
123 |
X |
|
X |
X |
X |
|
Massachusetts Avenue at John F Kennedy Street (near Harvard Square) |
Cambridge |
115 |
X |
X |
X |
X |
X |
|
Massachusetts Avenue near Commonwealth Avenue |
Boston |
114 |
X |
|
|
X |
X |
|
Cambridge Street and Broadway (near Harvard Square) |
Cambridge |
105 |
|
X |
X |
|
|
|
Note: Clusters were selected from Massachusetts 2006-15 HSIP-eligible Bicycle Crash Clusters for the Boston region. Arterial routes are based on designations from the Boston Region’s Congestion Management Process. Massachusetts top crash locations were identified using data in the MassDOT 2015 Top Crash Locations Report, March 2018, available at mass/gov/lists/top-high-crash-locations-by-year.
EPDO = Equivalent Property Damage Only.
HSIP = Highway Safety Improvement Program.
Sources: Massachusetts Department of Transportation and Boston Region MPO.
MassDOT established a set of HSIP-eligible pedestrian crash clusters using 2006–15 crash data and a 100-meter buffer around the locations of crashes involving pedestrians. There are 73 pedestrian crash clusters in the Boston region. Table 4-5 presents 22 locations with an EPDO index value of 100 or more, along with information about the other types of clusters that these pedestrian clusters intersect. As shown in the table below, many of these top-ranked crash clusters exist in downtown areas or intersect major arterial routes in the Boston region.
Table 4-5
Top-Ranked HSIP Eligible Pedestrian Crash Clusters
| Pedestrian Crash Cluster Area |
Municipality |
Cluster EPDO Value |
Intersects Arterial Route |
Intersects Other HSIP Pedestrian Crash Cluster(s) |
Intersects HSIP Bike Crash Cluster(s) |
Intersects All-Mode HSIP Crash Cluster(s) |
Intersects MPO Staff-identified Truck Crash Cluster(s) |
Intersects Massachusetts Top Crash Locations(s) |
|---|---|---|---|---|---|---|---|---|
Downtown Chelsea (Broadway, Everett Avenue, and surrounding streets) |
Chelsea |
916 |
|
X |
X |
X |
X |
|
Downtown Lynn (Essex, Union, Liberty, and Central streets, and surrounding streets) |
Lynn |
733 |
X |
X |
|
X |
X |
X |
Massachusetts Avenue (Hancock Street to Lansdowne Street, and neighboring streets, near Central Square) |
Cambridge |
432 |
X |
X |
X |
X |
X |
X |
Quincy Center (Hancock Street from Washington to School streets) |
Quincy |
305 |
|
|
X |
X |
X |
X |
Downtown Boston (near Court, Summer, Park and India streets) |
Boston |
264 |
|
|
X |
|
|
|
Davis Square |
Somerville, Cambridge |
257 |
|
X |
|
|
X |
|
Downtown Framingham (Waverly, Concord, and Hollis streets) |
Framingham |
219 |
X |
X |
|
X |
X |
X |
Watertown Square (Main, Mt. Auburn, N. Beacon, and Galen streets) |
Watertown |
209 |
X |
X |
|
X |
X |
|
Newton Centre (Beacon Street, Centre Street, and surrounding streets) |
Newton |
184 |
X |
X |
|
X |
X |
|
Downtown Salem (Washington, New Derby, Lafayette, and surrounding streets) |
Salem |
173 |
X |
X |
X |
X |
|
|
Main Street (approximately Grant to Banks streets) |
Waltham |
170 |
X |
X |
|
X |
X |
|
Broadway (Mountain Avenue to Revere Beach Parkway) and Park Avenue |
Revere |
163 |
X |
|
|
X |
X |
|
Mt. Auburn Street and Massachusetts Avenue (Harvard Square) |
Cambridge |
158 |
X |
X |
X |
|
X |
|
Boston Common and Downtown Crossing Areas (Tremont, Washington, Essex and Boylston streets) |
Boston |
156 |
X |
|
X |
|
|
|
Prospect and Cambridge streets (Inman Square) |
Cambridge |
126 |
|
X |
|
X |
|
|
Central Square |
Waltham |
124 |
X |
X |
|
X |
X |
|
Cambridge Street (Sciarappa Street to East Street, near Route 28) |
Cambridge |
118 |
|
X |
|
|
|
|
Harvard Street (near Coodlidge Corner) |
Brookline |
115 |
X |
X |
|
|
|
|
Western Avenue (Mall Street to Franklin Street) |
Lynn |
113 |
X |
|
X |
X |
X |
X |
Hancock Street (Adams Street to Washington Street near Quincy Center) |
Quincy |
112 |
X |
|
X |
X |
X |
|
Main Street, Downtown Woburn |
Woburn |
101 |
X |
|
|
X |
X |
|
Route 3A in Quincy (Sea Street to Brackett Street) |
Quincy |
100 |
|
|
|
X |
|
X |
Note: Clusters were selected from Massachusetts 2006-15 HSIP-eligible Pedestrian Crash Clusters for the Boston region. Arterial routes are based on designations from the Boston Region’s Congestion Management Process. Massachusetts top crash locations were identified using data in the MassDOT 2015 Top Crash Locations Report, March 2018, available at mass/gov/lists/top-high-crash-locations-by-year.
EPDO = Equivalent Property Damage Only.
HSIP = Highway Safety Improvement Program.
Sources: Massachusetts Department of Transportation and Boston Region MPO.
MassDOT does not specifically identify a set of clusters for truck-involved crashes, but MPO staff followed MassDOT’s methodology for creating all-mode crash clusters to generate a set of truck crash clusters using 2013–15 crash data. Staff identified 329 truck crash clusters that accounted for the top five percent of clusters in the Boston region, ranked by EPDO. Table 4-6 presents locations with an EPDO index value greater than 30, along with information about the other cluster types that these clusters intersect. Many of these high-ranking truck crash clusters exist at expressway-to-expressway interchanges and expressway-to-arterial interchanges. A noteworthy exception is the truck crash cluster at Kosciuszko Circle in Boston, which is located near the JFK/UMASS transit station and also intersects HSIP-eligible bicycle and pedestrian crash clusters.
Table 4-6
Top-Ranked MPO-identified Truck Crash Clusters
| Truck Crash Cluster Area |
Municipality |
Cluster EPDO Value |
Intersects Expressway |
Intersects Arterial Route |
Intersects HSIP Pedestrian Crash Cluster(s) |
Intersects Other HSIP Bicycle Crash Cluster(s) |
Intersects All-Mode HSIP Crash Cluster(s) |
|---|---|---|---|---|---|---|---|
Interstate 93 at Columbia Road (north of Exit 15) |
Boston |
68 |
X |
|
|
|
X |
Middlesex Turnpike at Interstate 95 |
Burlington |
65 |
X |
|
|
|
X |
Route 9 at Interstate 95 |
Wellesley |
53 |
X |
X |
|
|
X |
Interstate 93 near ramps for Furnace Brook Parkway (north of Exit 8) |
Quincy |
52 |
X |
|
|
|
X |
Interstate 495 at Interstate 290 |
Marlborough |
48 |
X |
|
|
|
X |
Interstate 93 (northbound) near ramps for Furnace Brook Parkway (south of Exit 8) |
Quincy |
48 |
X |
|
|
|
X |
Interstate 93 near ramps to Albany Street |
Boston |
39 |
X |
|
|
|
X |
Interstate 93 near Exit 20A (South Station) |
Boston |
38 |
X |
|
|
|
X |
Interstate 95 at Ramps to Neponset Street |
Norwood |
36 |
X |
|
|
|
X |
Interstate 95 at Route 4 (Bedford Street) |
Lexington |
35 |
X |
X |
|
|
X |
Interstate 93 at North Washington Street |
Boston |
35 |
X |
|
|
|
X |
Interstate 93 at Interstate 95 |
Reading |
35 |
X |
|
|
|
X |
Kosciuszko Circle |
Boston |
34 |
|
X |
X |
X |
X |
Interstate 495 at Route 2 |
Littleton |
33 |
X |
|
|
|
X |
Interstate 95 at Route 20 |
Waltham |
32 |
X |
|
|
|
X |
Interstate 90 at ramps to Interstate 95 (west of Exit 15) |
Weston |
31 |
X |
|
|
|
X |
Interstate 90 near Edgell Road |
Framingham |
30 |
X |
|
|
|
X |
Interstate 90 near Wood Street |
Hopkinton |
30 |
X |
|
|
|
X |
Note: Expressway and Arterial routes are based on designations from the Boston Region’s Congestion Management Process.
EPDO = Equivalent Property Damage Only.
HSIP = Highway Safety Improvement Program.
MPO = metropolitan planning organization.
Sources: Massachusetts Department of Transportation and Boston Region MPO.
During fall 2017 and winter 2018, MPO staff collected feedback on transportation issues, needs, and opportunities from municipal planners and officials, transportation advocates, members of the general public, and other stakeholders. During this outreach process, 118 participants commented on transportation safety needs. This section focuses on safety issues related to car, truck, bicycle, and pedestrian travel on the region’s roadways. Public feedback on transit safety is discussed later in this chapter.
Those who participated in the MPO’s outreach process identified a variety of concerns related to roadway safety.
Participants in the MPO’s outreach process identified specific needs and solutions to address these and other safety concerns. Many of these needs and solutions may overlap with those mentioned in Chapter 5 through Chapter 8. The ideas are summarized below.
MPO staff also reviewed feedback from other public gathering processes, including the 2017 MassMoves public workshops and outreach conducted for the GoBoston 2030 transportation plan. Several interest areas in common with the MPO’s outreach emerged and are included below.
These outreach processes also yielded other valuable themes to consider when planning to improve roadway safety.
Table 4-7
General Safety Improvement Strategies and Current or Potential MPO Roles
| General Strategy |
Current or Potential MPO Role |
|---|---|
Improve data collection, quality, and analysis |
Fund safety data collection and management projects through the UPWP, and coordinate with other agencies to share data |
Identify crash locations and causes and safety problems |
Continue to analyze crash data, including for specific locations |
Incorporate safety elements into roadway design and maintenance |
Develop safety recommendations as part of corridor and intersection studies Continue to participate in project-level RSAs to identify safety-issues and improvement opportunities at potential project locations Fund safety improvement projects in the TIP |
Conduct research to more effectively address crash frequency and severity |
Continue to conduct safety-oriented research studies on crash factors, countermeasures, and other topics |
Incorporate changes precipitated by new directives related to healthy transportation |
Incorporate healthy transportation policies into MPO planning processes Incorporate healthy transportation guidance and recommendations into corridor and intersection studies |
Integrate safety issues into planning documents |
Continue to account for various safety needs in TIP, LRTP, and UPWP development Incorporate MassDOT, MBTA, and other safety plans into MPO planning processes |
Develop infrastructure improvements that address the needs of different types of users |
Develop safety recommendations as part of corridor and intersection studies Fund safety improvement projects in the TIP |
Improve design and engineering of facilities |
Research design best practices in the UPWP |
Develop education and training for safety practitioners on best practices for design |
Fund safety-related technical assistance and guidebook and tool development through the UPWP Publicize training and educational opportunities through MPO public involvement channels |
Provide alternative transportation |
Analyze opportunities to provide alternative transportation in UPWP studies, and fund alternative transportation projects in the TIP |
Improve communication and collaboration among entities, including municipalities, that are working to address transportation safety |
Consider opportunities to use MPO meetings or events to support discussions on transportation safety issues |
Create public education and awareness campaigns |
Provide information through MPO public involvement channels |
Enhance safety enforcement for relevant safety factors, and develop collaborative enforcement efforts |
Not applicable |
Improve motor carrier systems |
Not applicable |
Consider enhancements to driver licensing |
Not applicable |
Improve processes for setting roadway speed limits |
Not applicable |
Continue to develop and implement practices, policies, and procedures to improve work zone and traffic incident set-ups to maximize safety |
Not applicable |
Prevent alcohol service to underage youth and intoxicated persons by enforcing alcoholic beverage control laws |
Not applicable |
LRTP = Long-Range Transportation Plan.
MassDOT = Massachusetts Department of Transportation.
MBTA = Massachusetts Bay Transportation Authority.
MPO = metropolitan planning organization.
RSAs = Road Safety Audits.
TIP = Transportation Improvement Program.
UPWP = Unified Planning Work Program
Sources: Massachusetts Strategic Highway Safety Plan and Boston Region MPO.
Federally required roadway safety performance measures and associated targets also help shape approaches to address roadway safety. These performance measures pertain to fatalities and serious injuries from traffic incidents, apply to all public roads, and are expressed as five-year rolling annual averages. The Commonwealth examined historic data and projected five-year rolling average values for these measures and set targets for calendar year (CY) 2019 that represent 2014–19 rolling annual averages. The Boston Region MPO voted to adopt these targets in February 2018 and has agreed to plan and program projects so that they contribute to the Commonwealth’s highway safety targets.
Table 4-8 displays the highway safety targets set by the Commonwealth. For all measures except the nonmotorized fatalities and serious injuries measure the Commonwealth considered the general downward trend lines in the historic data when setting its CY 2019 targets. Meanwhile, MassDOT recognizes that its initiatives to increase nonmotorized travel throughout the Commonwealth have posed a challenge to concurrent activities to reduce nonmotorized fatalities and injuries. Rather than adopt a target that reflects an increased amount of nonmotorized fatalities and serious injuries, MassDOT has set a CY 2019 target that is approximately equal to the 2011–15 rolling average value for nonmotorized fatalities and serious injuries (see Figure 4-10). The Commonwealth and the Boston Region MPO are required to update these targets on an annual basis.
Table 4-8
2019 Massachusetts Statewide Highway Safety Performance Targets
Highway Safety Performance Measure |
2019 Safety Measure Target (Expected 2015–19 Rolling Average) |
Number of fatalities |
353.00 |
Rate of fatalities per 100 million VMT |
0.58 |
Number of serious injuries |
2,801.00 |
Rate of serious injuries per 100 million VMT |
4.37 |
Number of nonmotorized fatalities and serious injuries |
541.00 |
VMT = vehicle-miles traveled.
Source: Commonwealth of Massachusetts.
MassDOT’s five-year Capital Investment Plan (CIP) plays a key role in implementing the strategies in the SHSP and for addressing the performance targets listed in Table 4-8. The CIP describes how the federal HSIP funds that Massachusetts receives are assigned to programs and projects. The FFYs 2019–23 CIP supported these roadway safety improvement strategies through a variety of different reliability and modernization-oriented programs, including those relating to bridges, intersections, roadways, bicycle and pedestrian facilities, and intelligent transportation systems. In particular, the CIP included a highway-oriented Safety Improvements program, which supports repairs to traffic signals, highway lighting systems, impact attenuators, traffic signs, and pavement markings. Federally funded investments made through the aforementioned programs that affect the Boston region appear in the Boston Region MPO’s TIP.
Transportation projects that address location-specific safety issues and opportunities begin with project designs and later become candidates for safety-related funding programs. Many types of MPO-funded UPWP studies recommend safety improvements for intersections and corridors, as noted in Appendix B, MPO Studies and Reports. Both MassDOT and the Boston Region MPO’s project selection processes include safety-oriented criteria. MassDOT stakeholders also assess safety issues and opportunities by conducting RSAs at candidate project locations. MPO staff typically participate in RSAs conducted in the Boston region. A project becomes eligible for HSIP funding when an RSA is completed, and recommendations from these RSAs, along with those from UPWP studies, can be incorporated into the MassDOT-managed project design process.
Other transportation agencies in the region, including those at the municipal level, support roadway safety through their own activities. In particular, Boston, Cambridge, and Somerville address roadway safety using the same Vision Zero approach that informs the Commonwealth’s “Move Toward Zero” goal. These cities have analyzed and publicized data to better understand safety issues and crash locations, and have or are in the process of developing Vision Zero action plans. Examples of municipal level initiatives to advance Vision Zero include:
The City of Boston has integrated Vision Zero planning with its GoBoston 2030 transportation plan and has created Priority Corridors and Safe Crossings, Walk and Bike Friendly Main Streets, Neighborhood Slow Streets, and Walkable Streets and ADA Improvements programs to support Vision Zero investments. The Boston Region MPO should continue to monitor these efforts and coordinate with these and other municipalities to identify ways that the MPO can support Vision Zero initiatives.
As with roadway safety, a number of factors affect the safety of the Boston region’s transit systems, including infrastructure and vehicle condition as well as customer, employee, and general public practices and behavior. Likewise, the region’s public transit providers must balance a number of considerations—including safety, operations, expansion needs and opportunities, and asset maintenance—when deciding how to invest in their systems. By understanding transit safety trends as well as system preservation and modernization, capacity management, and mobility considerations discussed later in this Needs Assessment, the MPO can make better decisions about how to improve the Boston region’s transit infrastructure and service.
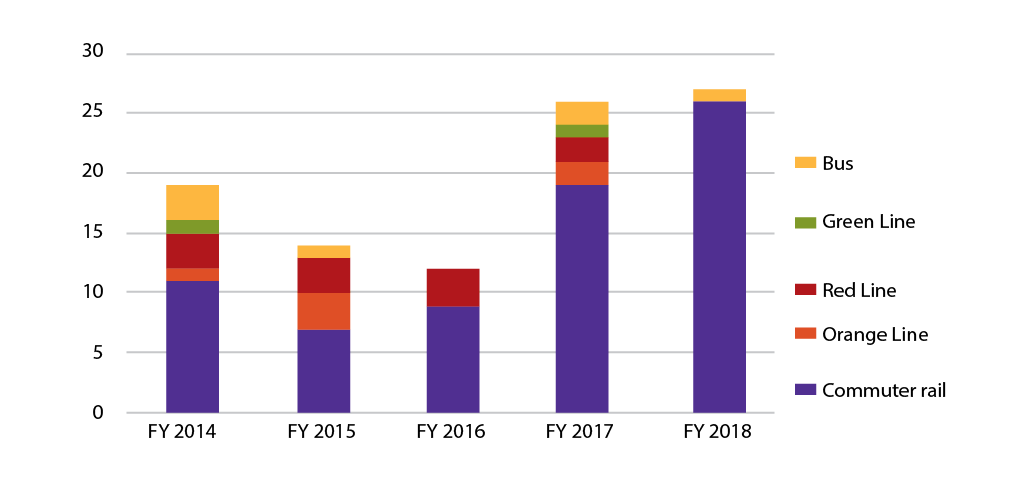
The MBTA is the major transit provider in the Boston region, providing heavy and light rail, commuter rail, bus, ferry, and paratransit service in a complex, wide-reaching transit system. MBTA staff monitors a variety of performance measures to understand, respond to, and proactively plan safety needs on the system. For example, Figure 4-11 displays fatalities for the MBTA’s bus and rail systems for the past six state fiscal years (SFYs). As the figure illustrates, most fatalities occurred on the commuter rail system. The number of fatalities on these MBTA systems more than doubled from SFY 2016 to SFY 2017, an increase attributed to growth in person/train collisions on the commuter rail network. This increase in fatalities on the commuter rail system continued into SFY 2018. MassDOT’s annual Tracker Performance report notes that a committee of federal and MBTA experts has been created to analyze and address emerging trends related to person/train conditions.9 The MBTA has also partnered with Operation Lifesaver to prevent collisions, fatalities, and injuries near railroad tracks and has collaborated with Samaritans, which addresses suicide prevention.
Figure 4-11
Fatalities as a Result of Transit Incidents by MBTA Line
Note: These figures include intentional and unintentional fatalities.
FY = Fiscal Year
MBTA = Massachusetts Bay Transportation Authority.
Sources: MBTA Safety and MassDOT Office of Performance Management and Innovation.
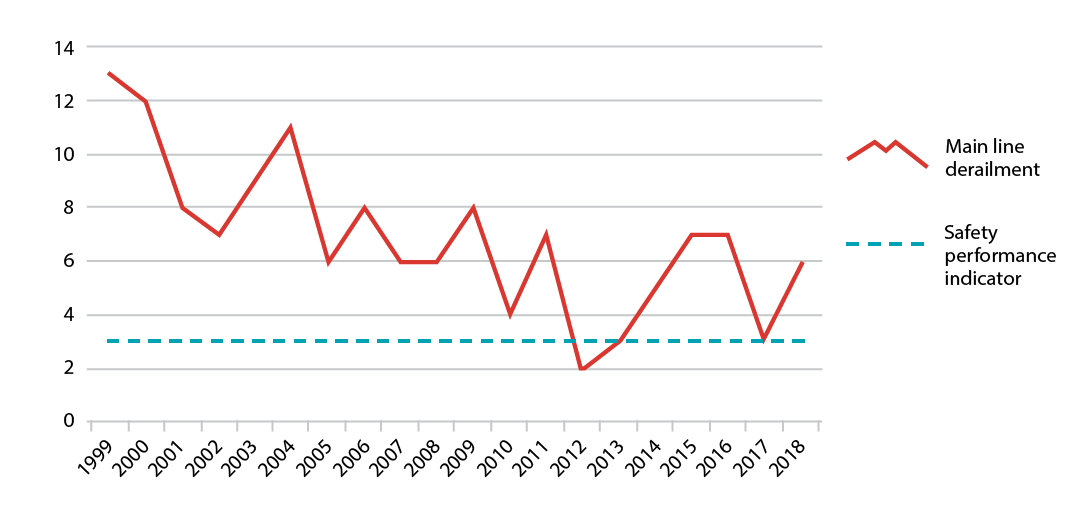
Other safety-relevant measures include derailments, which are defined as non-collision incidents in which one or more wheels of a transit vehicle unintentionally leaves the rail. Derailments can take place in rail yards or on mainlines. Figure 4-12 focuses on main line derailments, which have been trending downward over time. MBTA staff continues to work to eliminate derailments on its rail systems, and is specifically focused on eliminating human factor derailments, which were identified as the probable cause of 45 percent of 2017 derailments and 50 percent of 2018 derailments. Common human factor derailment causes include improperly setting switches and violating the red phases of signals.10
Figure 4-12
MBTA Yearly Main Line Derailments 1999-2018 (Light and Heavy Rail)
Note: This chart reflects mainline derailments occurring as part of both revenue (passenger) and nonrevenue service. The safety performance indicator is established by the MBTA’s Chief Safety Officer. Derailment numbers above the safety performance indicator goal signify a need for greater focus on the examination of causal factors and mitigation
MBTA = Massachusetts Bay Transportation Authority.
Source: MBTA Quarterly Safety Report, January 14, 2019.
Figures 4-13 and 4-14 show data pertaining to MBTA bus collisions from mid-2016 through 2018, categorized by factor. Figure 4-13 focuses specifically on total bus collisions, estimates for which are based on incidents where there is a report or alleged contact with an MBTA bus, regardless of severity. These counts are based on MBTA operations logs and incidents reported to MBTA Safety. Figure 4-14 focuses on reportable bus collisions, which are those that involve a person requiring transport to a medical facility, any collision involving three or more transports for medical treatment, or any collision resulting in property damage equal to $50,000 or more. These figures highlight that people or vehicles are often factors in these collisions. Since buses generally share roadways with other vehicles, bicyclists, and pedestrians, many of the roadway safety concerns discussed earlier in this section may affect bus travel as well. MBTA staff notes the agency has formed a Bus Accident Reduction committee to address issues related to collisions.
Figure 4-13
MBTA Total Bus Collisions
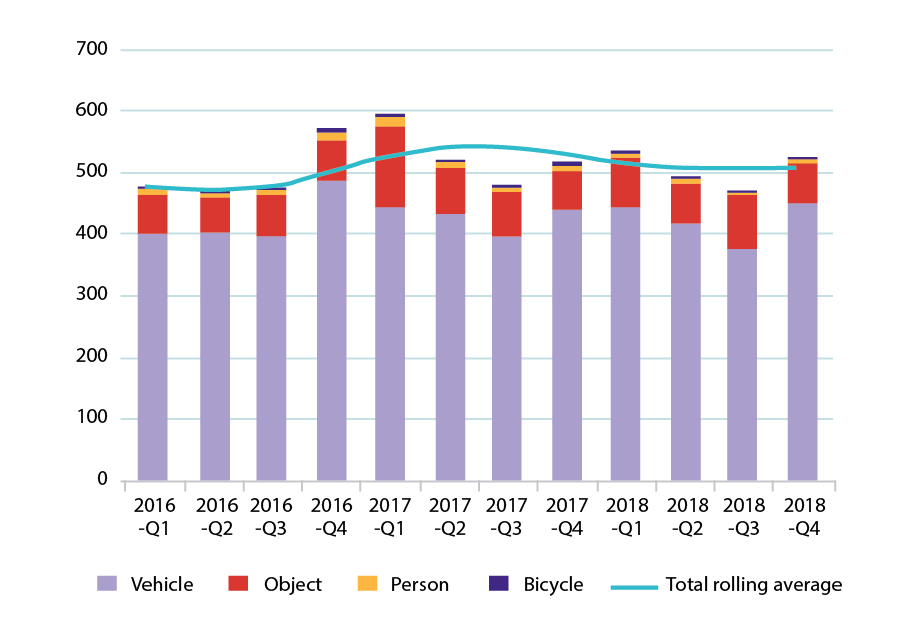
Note: These counts of total bus collisions are based on incidents where there is report or alleged contact with an MBTA bus regardless of severity. These counts are based on MBTA operations logs and incidents reported to MBTA Safety.
MBTA = Massachusetts Bay Transportation Authority. Q = Quarter.
Source: MBTA Quarterly Safety Report, January 14, 2019.
Figure 4-14
MBTA Reportable Bus Collisions
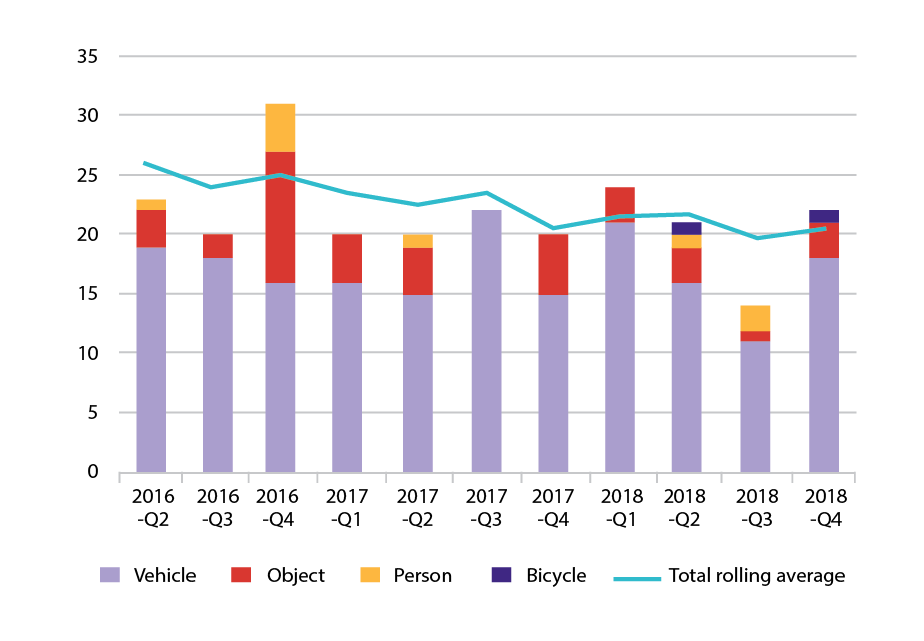
Note: Reportable bus collisions are those that involved a person requiring transport to a medical facility, any collision involving three or more transports for medical treatment, or any collision resulting in property damage equal to $50,000 or more.
MBTA = Massachusetts Bay Transportation Authority.Q = Quarter.
Source: MBTA Quarterly Safety Report, January 14, 2019.
The RTAs in the Boston region similarly monitor safety data. MassDOT’s Office of Performance Management and Innovation reports several RTA safety metrics in its annual Tracker Performance report. The CATA and the MWRTA are of particular interest to the Boston Region MPO, because they report their investments in the Boston Region MPO’s TIP.
Figure 4-15 shows injuries per 100,000 unlinked passenger trips for RTA fixed-route bus or demand response service. These normalized injury values are presented in five-year rolling annual averages. CATA reported no injuries occurring on its fixed-route service during the three periods, and it only reported a positive average number of injuries per 100,000 unlinked person trips for its demand response service for the SFYs 2012–16 period. MWRTA reports declining injury rates for both its fixed route and demand response services. Neither of these transit providers reported fatalities for any of the three analysis periods.
Figure 4-15
Regional Transit Authority Service: Injuries per 100,000 Unlinked Passenger Trips
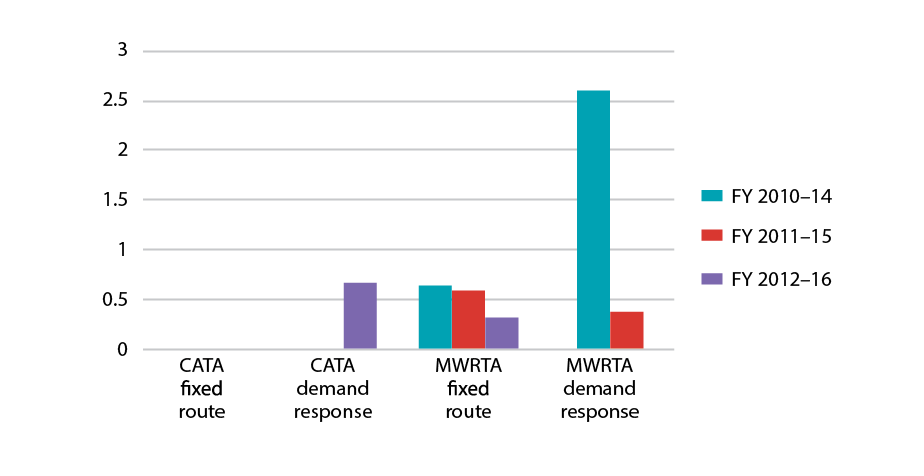
Note: Injuries reflect the annual number of injuries that resulted from unintentional contact with transit vehicles or property. An injury is recorded for each person who received medical attention on the premises or was transported away to receive medical care.
CATA = Cape Ann Transportation Authority.
FY = Fiscal Year.
MWRTA = MetroWest Regional Transit Authority.
Source: National Transit Database: Safety and Security Time Series Module.
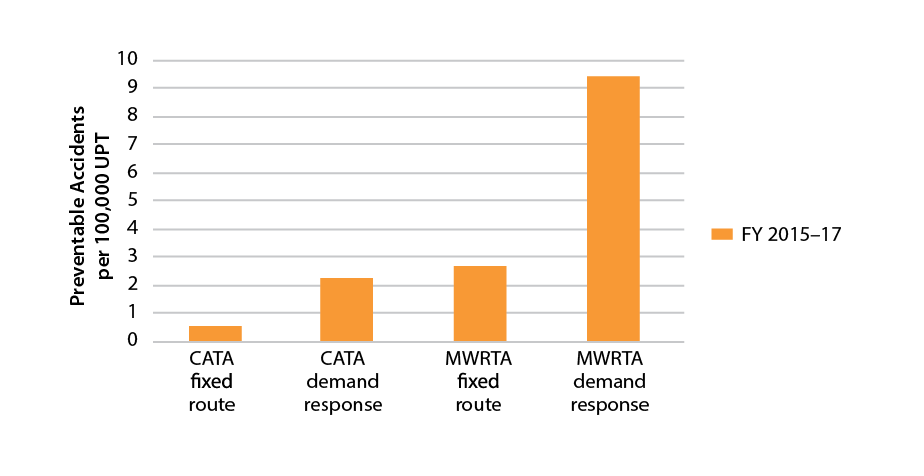
Figure 4-16 shows preventable accidents per 100,000 unlinked passenger trips for RTA fixed-route bus service and demand response service. Preventable accidents are those in which the driver of the transit vehicle is normally deemed responsible or partly responsible for the occurrence of the accident. These normalized preventable accident values are presented in three-year rolling annual averages.
Figure 4-16
Regional Transit Authority Fixed-Route Bus Service: Preventable Accidents per 100,000 Unlinked Passenger Trips
CATA = Cape Ann Transportation Authority.
FY = Fiscal Year.
MWRTA = MetroWest Regional Transit Authority.
UPT = unlinked passenger trips.
Source: MassDOT Rail and Transit National Transit Database: Safety and Security Time Series Module.
Participants in the MPO’s outreach process noted that there are safety issues at bus stops and stations and identified ways to improve transit safety.
Some of these solutions may overlap with those mentioned in Chapter 5, System Preservation and Modernization Needs, Chapter 6, Capacity Management and Mobility Needs, and Chapter 8, Transportation Equity Needs. Suggestions to improve transit safety included the following:
Activities to improve transit safety may range from data management and capital investment to new protocols and employee training. In its 2017 Strategic Plan, the MBTA highlights several specific needs, mandates, and initiatives pertaining to safety, which include workforce safety planning and programming, and the rail and bus system items outlined below.
The needs of transit agencies pertaining to transportation safety are, and will continue to be, shaped in part by federal mandates established under MAP-21 and continued under the FAST Act. The National Public Transportation Safety Plan (2017) creates a guiding framework for agency-level safety planning by establishing safety performance criteria for public transportation systems, and by recommending minimum safety performance standards for transit operations and the procurement of transit vehicles. Under the proposed Public Transportation Agency Safety Plan rule, public transportation providers receiving federal financial assistance would be required to develop an agency safety plan.14 These plans would include methods for identifying and evaluating safety risks throughout transit systems, strategies to minimize the exposure of people and property to hazards, targets for National Public Transportation Safety Plan performance, and other features.
The MPO will have a more integrated role in transit safety through the monitoring of transit safety performance measures and the development of targets for those measures. The MBTA, CATA, MWRTA, MassDOT, and the MPO will need to coordinate on setting targets for established measures pertaining to transit-related fatalities, serious injuries, safety events, and system reliability. These measures will help transportation agencies decide how to invest in “safety, reconstruction, or rehabilitation of existing assets in order to achieve and maintain a state of good repair.”15 Transit providers will establish targets for their respective systems, and the MPO will be responsible for setting targets for the Boston region.
MassDOT and transit agencies will work towards achieving these targets in part through capital investments, which are captured in MassDOT’s CIP. Federally funded investments made through the aforementioned programs that affect the Boston region appear in the Boston Region MPO’s TIP. Many of the 2019-23 CIP’s reliability and modernization programs, including those pertaining to MBTA and RTA facilities, stations, vehicles, and systems, relate to transit safety because they help to keep transit in a state of good repair. Examples of CIP programs with specific transit safety components include:
Often, transit system investments that address safety also address system preservation considerations. The Federal Transit Administration (FTA) notes that transit providers would consider the results of asset condition assessments, which are required for the development of the agency’s Transit Asset Management Plan, when performing safety risk management and safety assurance activities.16 In the future, the combination of transit providers’ Agency Safety Plans and their Transit Asset Management plans (discussed in Chapter 5) will help identify and prioritize initiatives that will improve the safety of the transit systems operating in the MPO region. These plans will provide valuable information to the MPO as it considers transit agencies’ proposed investments for the LRTP and TIP, as well as potential opportunities to provide support with MPO funds.
Looking ahead to 2040, advancements in CAV technology will have implications for transportation safety. Connected vehicle technology supports communication from vehicle to vehicle or from vehicles to transportation infrastructure, which may also support the transmission of data about vehicle speed, brake status, and other safety-relevant information. Autonomous vehicle technology transfers the role of monitoring and responding to the travel environment from humans to automated systems. These deployments can range from driver assistance to full automation of the vehicle.
Equipping passenger, freight, and transit vehicles with CAV technology could generate safety benefits. The National Highway Traffic Safety Administration analyzed crash data nationwide for 2015 and attributed about 94 percent of the critical reasons for motor vehicle crashes to drivers.17 CAV technologies could address human driving errors, such as those caused by fatigue, distraction, limited situational awareness, or under- or over-reaction to the travel environment.18 These improvements could increase not only driver safety, but the safety of other roadway users, such as bicyclists and pedestrians. CAV technology may also improve the way vehicles operate in hazardous or constrained areas, such as tight parking spots or work zones. Also, real time provision of traffic signal phase and timing (SPaT) information could transmit warnings and advisories to vehicles approaching signalized intersections.19 These types of benefits could result in saved lives, reduced health care costs, improved productivity, and reduced need for emergency response.
However, it is also possible that increased deployment of CAV technology may have neutral or negative effects on transportation safety. An evaluation of crash data by the Casualty Actuarial Society’s Automated Vehicles Task Force found that 49 percent of crashes involved a limiting factor (such as inclement weather, inoperable traffic control devices, vehicle deficiencies, or driver behavior issues) that might reduce the effectiveness of or disable CAV technology.20 Vehicle passengers or other roadway users could be inclined to engage in riskier behaviors, such as not using seatbelts or jaywalking, which may offset the benefits of CAV technology. Questions about how highly automated vehicles (HAV) may account for other roadway users persist, such as whether computing algorithms are likely to perform better than experienced human drivers, as do questions about non-HAV users may perceive or anticipate HAV actions. Planners and regulators will have to be attentive to how safety benefits and costs could vary depending on the market penetration of HAVs in the overall vehicle fleet.
Response to developments in CAV technology can happen at multiple levels of government. The Commonwealth’s Commission on the Future of Transportation recommends that the Massachusetts governor should “consider proposing legislation to establish statutory and regulatory structures that would enable the safe and reliable deployment of CAVs.”21 In the MPO staff report, Connected and Autonomous Vehicles and the Boston Region MPO—A First Look, staff recommend actions for the MPO to stay current on CAV advancements and to plan for and respond to these technologies. Safety-relevant actions include the following:
The transportation safety issues discussed in this chapter have focused on fatalities, injuries, and other negative outcomes arising from typical travel on the region’s roadways and transit systems. These negative outcomes may result from the design or condition of roadway or transit assets; from unintended consequences of driver, customer, or other behaviors; from weather, or from other factors. However, ensuring a safe transportation system also involves protecting the system from security incidents, such as terrorist attacks, and from natural disasters. These considerations will continue to be important, particularly for new transportation technologies and networks, such as those that may be implemented to support CAV travel.
Preventing and responding to security needs can involve capital investment, such as in new facility designs or in sensing, monitoring, or surveillance equipment. It can also involve operations planning and management to support communication and emergency response. Surface transportation agencies such as MassDOT, the MBTA, and the Massachusetts Port Authority have responsibilities in both capital investment and operations planning and management. MassDOT’s 2019–23 CIP includes programs designed to support security initiatives across MassDOT divisions. Programs in the FFYs 2019–23 CIP include:
With respect to transportation security, the Boston Region MPO relates most closely to capital investment processes that support security and communications assets. Federally funded investments made through the aforementioned programs that affect the Boston region appear in the Boston Region MPO’s TIP. The MPO can also serve as a forum for transportation agencies and other stakeholders to discuss transportation security concerns and identify ways to incorporate them into the transportation planning process.
The MPO also expects that climate change may affect transportation safety, specifically through its impacts on transportation infrastructure. More details about this are discussed in Chapter 5, System Preservation and Modernization.
Since the MPO last updated its Needs Assessment in 2014, there have been several planning and policy changes that affect the content of this chapter:
MPO staff have also made several updates to this chapter, based on these planning and policy changes, data availability, and other factors.
1 The accuracy of the analysis results presented in this section depends on the accuracy of the crash information reported to the Fatality Analysis and Reporting System (FARS) and the Massachusetts Crash Data System.
2 MassDOT defines serious injuries as incapacitating injuries, which are identified through incident reporting by police and vehicle operators using the Commonwealth of Massachusetts Motor Vehicle Crash Operator Report. The Massachusetts Law Enforcement Crash Report Data Dictionary defines incapacitating injuries as non-fatal injuries resulting in severe lacerations, broken or distorted extremities, crush injuries, significant skull, chest, or abdominal injuries, significant burns, paralysis, or unconsciousness when taken from the crash scene. See Massachusetts Law Enforcement Crash Report Data Dictionary, pg. 100.
3 MassDOT defines serious injuries as incapacitating injuries, which are identified based on incident reporting by police and operators using the Commonwealth of Massachusetts Motor Vehicle Crash Operator Report. (See additional details in Footnote 2).
4 The Boston region crash factor information presented in this section is based on the MPO boundaries prior to October 2018, when the MPO region included Duxbury, Hanover, Pembroke, and Stoughton.
5 MassDOT identified these top crash locations by examining clusters of motor vehicle crashes and ranking them based on their collective Equivalent Property Damage Only (EPDO) index value. (For more information on EPDO values, see the “High Crash Locations” section of this chapter.) MassDOT considered a crash cluster for inclusion in its Top 200 High Crash Location list if it was considered to be at an intersection. Clusters containing grade separated roadways or weaving sections, such as those located at rotaries or ramps, were excluded. Intersections located at the ends of off-ramps or traffic circles/rotaries were also generally excluded. See MassDOT 2015 Top Crash Locations Report, 2018, pg. 5.
6 MassDOT 2015 Top Crash Locations Report, 2018, pg. 7-10.
7 The crash cluster mapping process involves setting a 25 meter search radius around individual crash locations to find nearby crash locations and merging the areas around adjacent crash locations to create clusters. The search radius increases to 100-meters for bicycle- or pedestrian-involved crashes. For more information, see MassDOT’s 2015 Top Crash Locations Report, 2018, pg. 4-5, and MassDOT’s Top Crash Locations and Maps webpage at https://www.mass.gov/service-details/top-crash-locations-and-maps (accessed January 22, 2019).
8 Commonwealth of Massachusetts. Massachusetts 2018 Strategic Highway Safety Plan, 2019. Accessed January 22, 2019, at https://www.mass.gov/files/documents/2019/01/18/dot_SHSP_2018.pdf, pg. 5.
9 Massachusetts Department of Transportation. Tracker 2017: MassDOT’s Annual Performance Report. 2017 (revised March 2018). Accessed December 10, 2018, at https://www.mass.gov/files/documents/2018/04/20/Tracker2017.pdf, pg. 69. See also Tracker 2018: MBTA Performance at https://massdottracker.com/mbta/, accessed January 22, 2019.
10 Nickle, Ron and Durso, Holly, Massachusetts Bay Transportation Authority (MBTA). MBTA Quarterly Safety Report. January 14, 2019. Accessed January 23, 2019, at https://cdn.mbta.com/sites/default/files/fmcb-meeting-docs/2019/01-january/2019-01-14-fmcb-safety-update-original.pdf, pg. 14.
11 US Department of Transportation Federal Railroad Administration (FRA). “Positive Train Control (PTC) Legislation & Regulations. https://www.fra.dot.gov/Page/P0564. Accessed August 13, 2018.
12 “Line of sight” refers to a railway industry mode of operation that requires trains to operate under speed restrictions so that train operators can come to a stop within half the range of their vision. See City of Edmonton. “Metro Line: Fact Sheet–Operations.” 2015. Accessed January 22, 2019, at https://www.edmonton.ca/transportation/Metro_Line_Operations_Fact_Sheet_August_2015.pdf pg. 1.
13 Massachusetts Bay Transportation Authority. Fiscal Management and Control Board: MBTA Strategic Plan, 2017, accessed January 22, 2019, at https://cdn.mbta.com/sites/default/files/fmcb-meeting-docs/reports-policies/2017-mbta-strategic-plan.pdf, pg. 18.
14 The Public Transportation Agency Safety plan Safety Plan rule would not apply to MBTA Commuter Rail, which is overseen by the Federal Railroad Administration (FRA). However, the System Safety Rule (49 CFR 270), most recently stayed till December 4, 2018, would require the development of a Commuter Rail system safety plan.
15 US. Department of Transportation Federal Transit Administration. National Public Transportation Safety Plan. 2017, accessed January 22, 2019, at https://www.transit.dot.gov/sites/fta.dot.gov/files/docs/National%20Public%20Transportation%20Safety%20Plan_1.pdf, pg. 30.
16 US Department of Transportation Federal Transit Administation, “Fact Sheet: Public Transportation Agency Safety Plans Notice of Proposed Rulemaking (NPRM).” Accessed January 22, 2019, at https://www.transit.dot.gov/sites/fta.dot.gov/files/docs/Fact_Sheet_Public_Transportation_Agency_Safety_Plans_Notice_of_Proposed_Rulemaking_NPRM.pdf, pg. 2.
17 US Department of Transportation National Highway Traffic Safety Administration. “Critical Reasons for Crashes Investigated in the National Motor Vehicle Crash Causation Survey.” Traffic Safety Facts: Crash Stats. February 2015. Accessed January 22, 2019, at https://crashstats.nhtsa.dot.gov/Api/Public/ViewPublication/812115, p. 2.
18 Central Transportation Planning Staff. Connected and Autonomous Vehicles and the Boston MPO—A First Look. December 2017. Accessed January 22, 2019, at https://www.ctps.org/data/pdf/studies/other/Connected_and_Autonomous_Vehicles.pdf pg. 10.
19 California PATH Program Institute of Transportation Studies University of California, Berkeley. Investigating the Potential Benefits of Broadcasted Signal Phase and Timing (SPaT) Data under IntelliDriveSM. 2011. Accessed January 22, 2019, at http://www.cts.virginia.edu/wp-content/uploads/2014/04/PFS_SPAT99_Final.pdf, pg. 17.
20 Casualty Actuarial Society Automated Vehicles Task Force. Restating the National Highway Transportation Safety Administration’s National Motor Vehicle Crash Causation
Survey for Automated Vehicles. 2014. Casualty Actuarial Society E-Forum, Fall 2014–Volume 1. Accessed January 23, 2019, at https://www.casact.org/pubs/forum/14fforum/CAS%20AVTF_Restated_NMVCCS.pdf, pg. 1 and 16. See also Smith et al. Benefits Estimation Framework for Automated Vehicle Operations, 2015. Volpe National Transportation Systems Center. Accessed January 23, 2019, at https://rosap.ntl.bts.gov/view/dot/4298/dot_4298_DS1.pdf, pg. 13-14.
21 Commission on the Future of Transportation in the Commonwealth. Choices for Stewardship: Recommendations to Meet the Transportation Future. Volume 1. Accessed January 22, 2019, at https://www.mass.gov/files/documents/2019/01/10/FOTCVolume1.pdf, pg. 48.
< Chapter 3 - Travel Patterns in the Boston Region | Chapter 5 - System Preservation and Modernization Needs >