
TIP Project Impacts:
Before-and-After Evaluations
Project Contributors
Rounaq Basu
Sarah Philbrick
William Kuttner
Ryan Hicks
Julie Dombroski
Mark S. Abbott
Graphics
Ken Dumas
Kim Delauri
Central Transportation Planning Staff is
directed by the Boston Region Metropolitan
Planning Organization (MPO). The MPO is composed of
state and regional agencies and authorities, and
local governments.
Thank you to Ryan Hicks, William Kutner, and Mark Abbott, all formerly of CTPS, who contributed substantially to this research.
Thank you to Julie Dombroski, formerly of CTPS, who contributed substantially to the data analysis used in this report.
CIVIL RIGHTS NOTICE TO THE PUBLIC
Welcome. Bem Vinda. Bienvenido. Akeyi. 欢迎. 歡迎
You are invited to participate in our transportation planning process, free from discrimination. The Boston Region Metropolitan Planning Organization (MPO) is committed to nondiscrimination in all activities and complies with Title VI of the Civil Rights Act of 1964, which prohibits discrimination on the basis of race, color, or national origin (including limited English proficiency). Related federal and state nondiscrimination laws prohibit discrimination on the basis of age, sex, disability, and additional protected characteristics.
For additional information or to file a civil rights complaint, visit www.bostonmpo.org/mpo_non_discrimination.
To request this information in a different language or format, please contact:
Boston Region MPO Title IV Specialist
10 Park Plaza, Suite 2150
Boston, MA 02116
Phone: 857.702.3700
Email: civilrights@ctps.org
For people with hearing or speaking difficulties, connect through the state MassRelay service, www.mass.gov/massrelay. Please allow at least five business days for your request to be fulfilled.
Abstract
Each year the Boston Region Metropolitan Planning Organization (MPO) programs more than $6 billion dollars in funding through the Transportation Improvement Program (TIP) to transportation projects in the Boston region. Of that amount, the MPO has complete discretion over $730 million of funding. Projects that are candidates to receive this Regional Target funding are evaluated based on the projects’ abilities to achieve our regional goals for equity, safety, mobility and reliability, resiliency, access and connectivity, and clean air and healthy communities.
While projects are scored and funded based on their projected benefits, it is important to review projects after they are completed to see if they have achieved intended goals. As part of our commitment to learning from experience and improving technical practice, the Boston Region MPO has conducted a study to review four projects funded with Regional Target funds. The purpose of this study was to analyze the safety, congestion, and mobility impacts of Regional Target-funded projects on their respective project areas. Future studies may focus on other projects advanced in the TIP by the Massachusetts Department of Transportation and regional transit authorities.
This study was conducted over a number of years with a large pause in data collection and analysis during the height of the COVID-19 pandemic in 2020. Because the study has been completed in sections, you will notice that some analyses, particularly those done before 2020, use older data. We are still confident that the findings from this study are useful for understanding the way Regional Target-funded projects have influenced their respective project areas.
1.1 Project Evaluation in MPO Planning
1.1.2 The Four Projects Evaluated
Chapter 2— Hancock and East/West Squantum Streets, Quincy
2.2 Description of Key Project Elements
2.2.1 Expanding the Central Intersection
2.2.2 North Quincy High School Crosswalk
2.2.3 Interconnection of Traffic Signals
2.3 Evaluating Project Effectiveness
2.3.1 Measures of Effectiveness
2.3.4 Urban Design and Land Use
Chapter 3— Lebanon Street Reconstruction, Melrose
3.2 Description of Key Project Elements
3.2.1 Physical Improvements Within an Existing Right-of-Way
3.2.2 Intersection Complex at Lynde, Grove, and Lebanon Streets
3.2.3 Intersection of Upham and Lebanon Streets
3.2.4 Intersection of Main, Green, Porter, and Lebanon Streets
3.3 Evaluating Project Effectiveness
3.3.1 Measures of Effectiveness
3.3.4 Urban Design and Land Use
Chapter 4— Broadway Reconstruction, East Somerville
4.2 Description of Key Project Elements
4.2.1 Transforming and Enhancing an Obsolete Streetscape
4.3 Evaluating Project Effectiveness
4.3.1 Measures of Effectiveness
4.3.4 Urban Design and Land Use
Chapter 5— Community Path Extension, Somerville
5.3 Evaluating Project Effectiveness
5.3.1 Measures of Effectiveness
5.3.3 Urban Design and Land Use
Chapter 6—Recommendations and Conclusions
6.1 Notable Project Elements Successes and Challenges
6.1.4 Somerville (Community Path Extension)
6.2 Future Project Recommendations
6.2.4 Somerville (Community Path Extension)
Chapter 7—Conclusions and Next Steps
7.2.1 Conduct a Follow-up Before-and-After Study on Regionally Significant Projects
Figure 1 Locations of Evaluated Projects
Figure 3 Hancock and East/West Squantum Streets Intersection, September 2014
Figure 4 Hancock and East/West Squantum Streets Intersection, May 2016
Figure 5 North Quincy High School Crosswalk, September 2014
Figure 6 North Quincy High School Crosswalk, May 2016
Figure 7 Signalized Driveway and Reconstructed Crosswalk, July 2020
Figure 8 Hancock and Squantum Streets, Change in AM Travel Time Index
Figure 9 Hancock and Squantum Streets, Change in PM Travel Time Index
Figure 10 Lebanon Street Reconstruction, Project Area June 2019
Figure 11 Corner of Grove and Lebanon Streets, September 2007
Figure 12 Corner of Grove and Lebanon Streets, September 2018
Figure 13 Lynde, Grove, and Lebanon Streets Intersection, September 2014
Figure 14 Lynde, Grove, and Lebanon Streets Intersection, May 2016
Figure 15 Upham and Lebanon Streets Intersection, September 2014
Figure 16 Upham and Lebanon Streets Intersection, May 2016
Figure 17 Intersection of Main, Green, Porter, and Lebanon Streets, September 2014
Figure 18 Intersection of Main, Green, Porter, and Lebanon Streets, May 2016
Figure 19 Main, Lebanon, and Upham Streets, Change in AM Travel Time Index
Figure 20 Main, Lebanon, and Upham Streets, Change in PM Travel Time Index
Figure 21 Broadway Reconstruction, Project Area June 2010
Figure 22 Broadway Reconstruction, Project Area June 2019
Figure 23 Streetscape in Front of East Somerville Branch Library, June 2010
Figure 24 Streetscape in Front of East Somerville Branch Library, June 2019
Figure 25 Loading Zone, August 2020
Figure 26 Loading Zone Sign, August 2020
Figure 27 Change in AM Travel Time Index, Broadway and McGrath Highway
Figure 28 Change in PM Travel Time Index, Broadway and McGrath Highway
Figure 29 Somerville Community Path Extension Project Area
Figure 30 Rail Right-of-Way East of Cedar Street, 2001
Figure 31 Community Path at Cedar Street, 2020
Figure 32 Rail Right-of-Way at Lowell Street, 2001
Figure 33 Community Path at Lowell Street, 2020
Table 1 Hancock Street and East/West Squantum Streets, Reconstruction Crash Statistics
Table 2 Crashes at 275 Hancock Street, Quincy, near North Quincy High School and McDonald’s
Table 3 Hancock Street Corridor Intersection Approach, AM Peak Hour Traffic Volumes
Table 4 Hancock Street Corridor Intersection Approach, PM Peak Hour Traffic Volumes
Table 5 Hancock Street Corridor Intersection, AM Level of Service, Delay, and Queue Length
Table 6 Hancock Street Corridor Intersection, PM Level of Service, Delay, and Queue Length
Table 7 Change in AM and PM INRIX Performance Metrics—2012 to 2019
Table 8 Lebanon Street Corridor Crash Statistics
Table 9 Lebanon Street Corridor Intersection Approach, AM Peak Hour Traffic Volumes
Table 10 Lebanon Street Corridor Intersection Approach, PM Peak Hour Traffic Volumes
Table 11 Lebanon Street Corridor Intersection AM Level of Service, Delay, and Queue Length
Table 12 Lebanon Street Corridor Intersection, PM Level of Service, Delay, and Queue Length
Table 13 Change in AM and PM INRIX Performance Metrics—2012 to 2019, Lebanon Street Corridor
Table 15 Broadway Corridor Intersection Approach, AM Peak Hour Traffic Volumes
Table 16 Broadway Corridor Intersection Approach, PM Peak Hour Traffic Volumes
Table 17 Broadway Corridor Intersection, AM Level of Service, Delay, and Queue Length
Table 18 Broadway Corridor Intersection, PM Level of Service, Delay, and Queue Length
Table 19 Broadway Corridor, Change in AM and PM INRIX Performance Metrics—2012 to 2019
Table 20 12-Hour Use Summary March 23, 2023, 6:00 AM to 6:00 PM
Appendix B Highway Capacity Manual (HCM) Synchro Reports - Before and Projected
Appendix C Highway Capacity Manual (HCM) Synchro Reports – 2023 (After)
Appendix D Turning Movement Counts (TMCS) for the Study Area Intersections
Building or modifying transportation infrastructure exerts a powerful influence on the built environment, the economy, and society as a whole. Metropolitan planning organizations (MPO) are responsible for identifying, evaluating, and prioritizing broad classes of potential infrastructure investments within their planning regions. This process considers many quantitative transportation measures of candidate projects as well as the projects’ estimated benefits to the region and the advancement of MPO goals. The MPO’s project review process, which precedes the start of construction, is carried out through the annual preparation of the five-year Transportation Improvement Program (TIP).
By its nature, the creation of infrastructure requires years of planning, design, and construction. Every year, new projects are placed in the planning and construction pipelines, and this parade of new projects commands the attention of the planning community. MPO members and local stakeholders are justifiably interested in the progress toward project completion by implementing agencies and, once complete, whether projects are realizing their envisioned benefits.
These concerns are echoed by the MPO’s federal partners, and federal regulation requires before-and-after evaluations as part of the mandatory Congestion Management Process (CMP). Federally mandated before-and-after reviews are not just progress reports. Before-and-after studies examine whether the MPO’s investment strategies that inform the project selection process are suitable for the types of projects and situations where they are being applied.
Four projects were selected for this study and their locations are shown in Figure 1. Each project represents a distinct level of network modification:
Programmed 2014, construction completed spring 2015
$4.6 million
The intersection accommodated existing traffic levels poorly. Turning lanes were added requiring land takings.
Programmed 2014, construction completed spring 2016
$3.8 million
Almost a mile of Lebanon Street and intersecting roadways were rebuilt, mostly within the existing right-of-way (ROW), to address safety concerns. Minor land acquisitions were required to reconstruct sidewalks to current standards.
Programmed 2012, completed fall 2015
$7.9 million
Almost a half-mile of Broadway’s 100-foot-wide ROW was rebuilt with a significantly reduced pavement area, widened sidewalks, and added streetscape enhancements.
Programmed 2014, completed spring 2016
$4.6 million
A quarter-mile of abandoned freight rail ROW was converted into a multiuse path.
Figure 1
Locations of Evaluated Projects
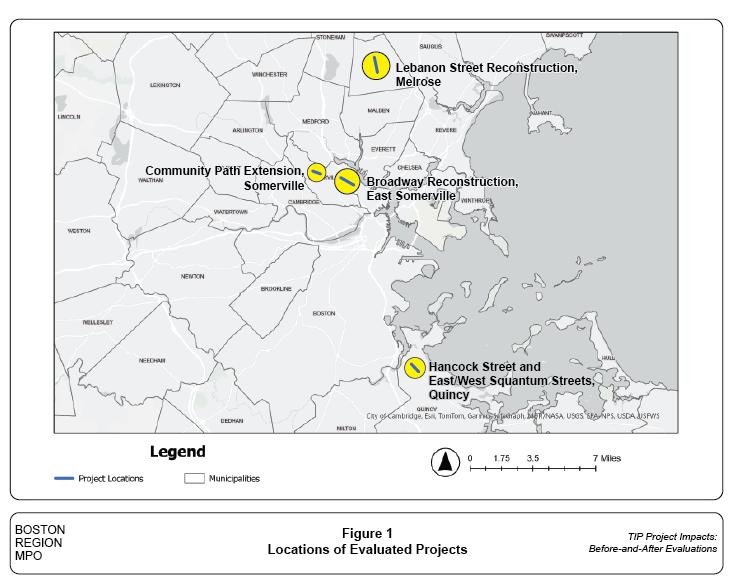
The project costs ranged from $1.9 million to $7.9 million. These project expenditures may appear small when compared with the large projects, which are often subjects of extensive public debate. However, projects of this smaller scale can still have a major impact on their immediate environment. While much of the analyses in this study are based on traffic and safety statistics, impacts resulting from project design will also be highlighted.
The analysis of each project was designed based on the individual characteristics of the project. The information provided in planning documents available for each project reflected the scope and purpose of the particular project. Some analyses, such as those on crash experience, could be applied uniformly to the three roadway projects. Other impacts, such as parking availability, were not relevant to all projects.
Chapter 2— Hancock and East/West Squantum Streets, Quincy
Hancock Street meets East and West Squantum Streets in north Quincy. On the four corners of the intersection are a gasoline station, a bank, a drug store, and North Quincy High School. Behind these direct abutters are the North Quincy Red Line station with its associated bus ramps and parking facilities, a fire station, a McDonald’s restaurant, a city Target store, a Starbucks, a parochial school, and various small businesses and housing. Three MBTA bus routes (MBTA bus Routes 210, 211 and 217) pass through this intersection and serve the Red Line station without making a layover.
Hancock Street at this location is Route 3A and is designated by the Massachusetts Department of Transportation (MassDOT) as an urban principal arterial. East and West Squantum Streets are urban minor arterials. The project area is centered on the intersection of these three streets and extends one or two blocks along each of the four approaches (Figure 2). The inability of this intersection to efficiently accommodate peak period traffic not only caused congestion delays but also impeded use of the nearby intersections and curb cuts in the project area.
The reconstruction effort brought all project area elements up to current standards, added lanes at the central intersection, added a signalized pedestrian crosswalk, and coordinated all traffic signals affecting the study area. This project received its notice to proceed in July 2014 and construction was completed in spring of 2015. The initial cost estimate in the MassDOT project information database was $3,891,350 and the bid price was $4,579,476.
Figure 2 is an aerial photo of the central intersection post-reconstruction. A functional design report (FDR) prepared in 2009 (released in January 2010) listed several deficiencies at this location:
The delays and congestion resulted in intersection level-of-service (LOS) ratings in 2009 of D during the AM peak travel period and E during the PM peak. Without intervention, LOS in 2029 was projected to be E during the AM peak and F during the PM peak, the lowest scores on the A through F LOS scale. LOS levels E and F are considered unacceptable. LOS during the afternoon school release time was projected to decline from C to D between 2009 and 2029, reflecting the prevalence of students using cars or being picked up from school. LOS and related traffic statistics were analyzed by individual traffic movements, as described in the following section.
The capacity of the intersection is largely determined by the number of lanes. Prior to reconstruction, the intersection had two lanes approaching in each of the four directions. Three of the four directions had only one departure lane. Despite this few number of lanes, the pedestrian crosswalks were placed where they were lengthier than necessary.
Figure 2
Hancock and East/West Squantum Streets Intersection
Project Area
Post-construction, June 2022
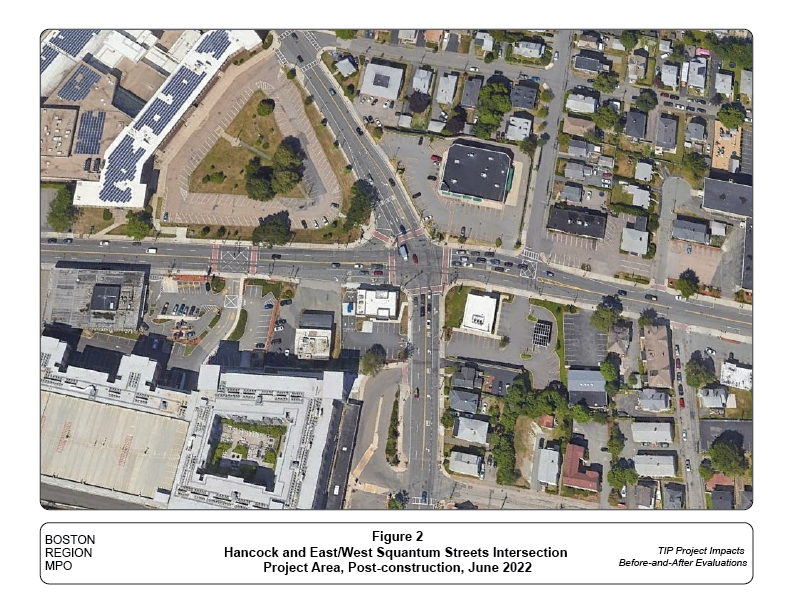
Figure 3
Hancock and East/West Squantum Streets Intersection
September 2014
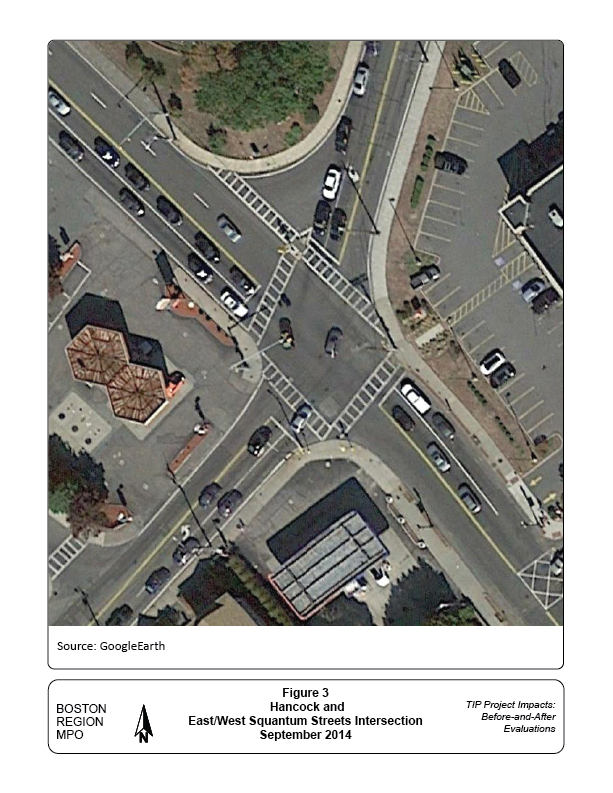
Figure 4
Hancock and East/West Squantum Streets Intersection
May 2016
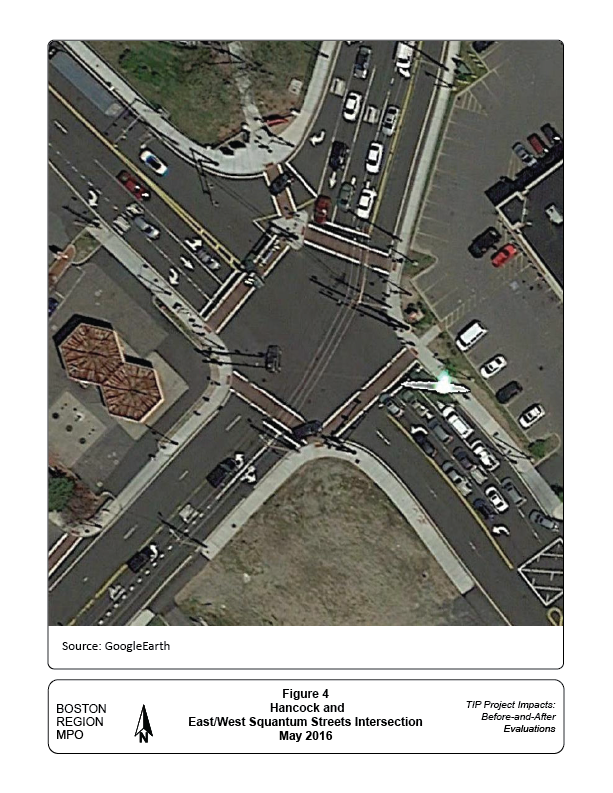
The FDR envisioned several changes to improve the safety and performance of the intersection. As shown in Figure 4, these improvements included widening each of the four roadway segments and adding lanes at the intersection:
The FDR’s 2029 projections for the build option showed that AM peak LOS would improve to D compared with E in the no-build option. Congestion during the PM peak was more severe than during the AM peak, but the proposed improvements were expected to improve LOS from F to C, a substantial improvement.
The added right-turn lane on westbound East Squantum Street and the second departure lane on southbound Hancock Street were not mentioned explicitly in the FDR, but these improvements are clearly visible in Figure 4. The FDR did mention lengthy crosswalks but did not include a conceptual plan to address them. Comparing Figures 3 and 4 shows that some of the crosswalks have been redesigned to be shorter despite the increase in the overall size of the intersection.
The FDR identified the mid-block crosswalk between North Quincy High School and the McDonald’s restaurant on the west side of Hancock Street as a location with significant safety problems. The safety problems were exacerbated by the placement of curb cuts for the McDonald’s parking lot and drive-through service. The traffic entering and exiting McDonald’s also contributed to traffic flow problems. Left turns were prohibited at these driveways between 7:00 and 9:00 AM and between 4:00 and 6:00 PM. Figure 5 is an aerial photo of this crosswalk prior to reconstruction. The FDR noted three pedestrian safety issues here:
The key recommendation of the FDR was to upgrade crosswalk control to a fully functioning signal, which would complement appropriate pavement markings as shown in Figure 6. The FDR mentioned lack of pedestrian control as a problem but did not propose a solution. However, a fence was installed next to the reconstructed sidewalk and the path from the high school building was rebuilt to bring pedestrians directly to the crosswalk.
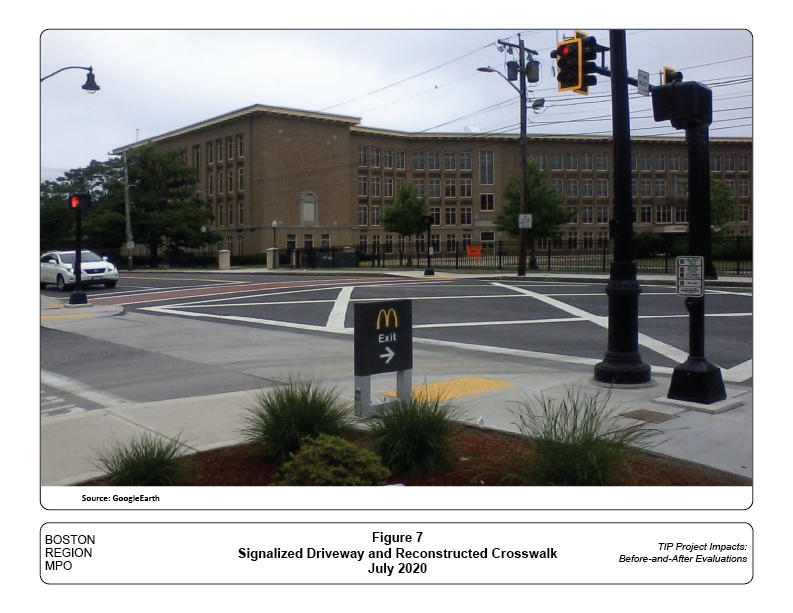
The project did not resolve the problem of the proximity of the crosswalk to one of the McDonald’s driveways. After the most recent GoogleEarth imagery in June 2019 (Figure 2) the McDonald’s vehicle-circulation system was reconstructed, channeling traffic through a signalized intersection, shown in Figure 7, which also leads to a plaza with a city Target store and Starbucks.
Pedestrians also cross Hancock Street at this new business-access intersection. The pedestrian crosswalk no longer aligns with the path from the high school building, possibly enticing students to cross at the point where they reach Hancock Street rather than walking the short distance to the new intersection. If jaywalking becomes a problem, it would be possible to modify the fence and pathway to bring students directly to the crosswalk from the high school.
The curbs separating Hancock Street from its sidewalks have been raised since this corridor was reconstructed. Additionally, an intermittent buffer of trees and bricks was removed in favor of extending the sidewalk to the curb. The crosswalk that traverses on the right-turn lane on East Squantum Street eastbound at the Hancock Street and Squantum Street intersection was repositioned diagonally to align with pedestrian behavior. Previously, pedestrians would cross diagonally outside of the crosswalk. Other accessible features were installed at this intersection, such as tactile pavement near curb-cuts and raised island curbs.
Figure 5
North Quincy High School Crosswalk
September 2014

Figure 6
North Quincy High School Crosswalk
May 2016
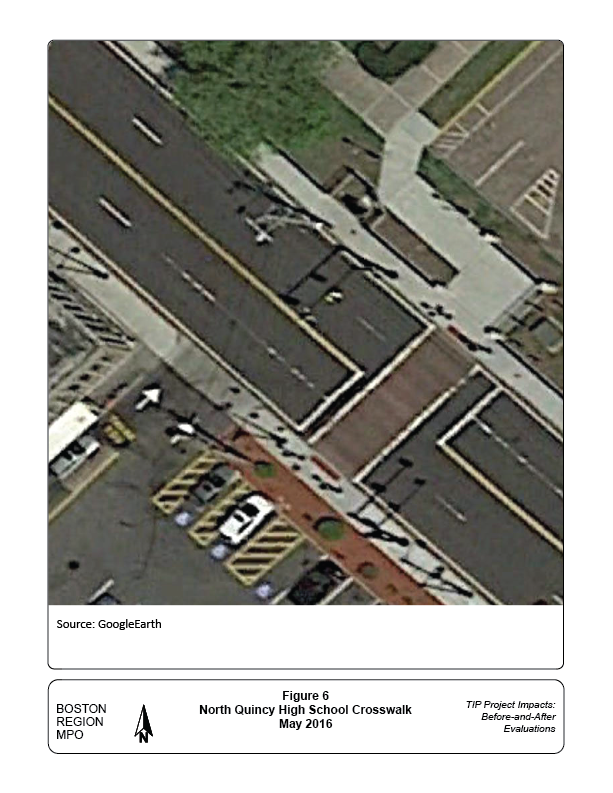
Figure 7
Signalized Driveway and Reconstructed Crosswalk
July 2020
The signal equipment at the central intersection was not connected and coordinated with the signalized intersections directly to the north and to the south, at Hunt Street/MBTA Driveway and Glover Street respectively. It should be noted that the signal equipment at Hunt Street/MBTA Driveway was considered part of the project area while the intersection itself was not. The equipment at these adjacent intersections was largely outdated or substandard.
The 2029 traffic simulation results presented in the FDR assumed coordinated signal operations throughout the project area in the build scenario. On a recent field visit, the various roadway elements, including signals, appeared to have been replaced as described in the FDR. Coordinated operation of the adjacent signal subsystems are now present, as the four signalized intersections in this study area are now coordinated via hardware interconnect. At the intersection of Hancock Street and Squantum Street, each approach now has its own signal bar, which has increased signal visibility. Previously, signals for all approaches shared a single signal bar.
Improving safety for bicyclists was listed as one of the purposes of the project. The project rebuilt or refurbished the sidewalks, signage, pavement markings, and expanded the roadway surface width to further accommodate people riding bicycles. The various reconstructions and improvements implemented in the project area appear to have improved safety and efficiency for bicycle use throughout the project area.
The improvements observed in the project area follow closely the recommendations presented in the FDR. This section discusses how successful the project has been at meeting its transportation goals and, more broadly, how the project has influenced its immediate vicinity qualitatively. There were three aspects of the evaluation:
Crash statistics were developed for the three calendar-year time periods preceding and following project construction activity, and these data are summarized in Table 1. The before interval comprises 2011 through 2013. The notice to proceed was issued in July 2014 and construction was completed in spring 2015. The after interval comprises crashes from 2016 through 2018, the most recent data available at the time of the analysis. The 2018 crash statistics were preliminary but agreed with police records.
The crashes listed in Table 1 are totals for an extended area of project influence. This includes the project area plus portions of streets just outside the project area where traffic safety might have been impacted by the project. Crashes at commercial driveways at the corner of Hunt and Hancock Streets are an examples of crashes included in the area of project influence.
There were 212 crashes in the after period, 20 percent more than the previous period when there were 177 crashes. Sideswipe crashes accounted for most of the increase. Traffic counts are not available for these periods, so reliable estimation of the crash rates is not possible. If average weekday traffic has increased by less than 20 percent, then the crash rate has increased.
Tragically, there was one fatality in the after period. One night in October 2016, a pedestrian at the intersection of Hollis Avenue and Hancock Street stepped into Hancock Street and was hit and killed by a light truck traveling northbound. The driver stopped and the official crash record indicates no improper driving.
Hollis Avenue is labeled in Figure 1, and its intersection with Hancock Street is clearly seen in Figures 2 and 3 with prominent “do not block the box” striping visible both before and after the project.
Before the project there were no crosswalk pavement markings. In the after photo, brick-red textured pavement and striping clearly indicates a crosswalk across Hollis Avenue, but there are no pavement markings for the Hancock Street crossing there. The closest opportunity to cross Hancock Street would be 120 feet north of Hollis Avenue at the central intersection. Between Squantum Street and Glover Street, there are two crosswalks.
The corridor now has 17.5 crossing opportunities per mile, which is sufficient by industry standards. Given the fatality, however, more could be done in this area to improve safety, such as by adding a crosswalk with a mid-block crossing sign on Hancock Street near Hollis Avenue.
Table 1
Hancock Street and East/West Squantum Streets
Reconstruction Crash Statistics
| All Crashes | ||||
| Crash Variable | Before | After | ||
| Crash Severity | ||||
| Fatal injury | 1 | |||
| Nonfatal injury | 35 | 38 | ||
| Property damage only (none injured) | 132 | 161 | ||
| Not reported | 10 | 12 | ||
| Manner of Collision | ||||
| Rear-end | 59 | 62 | ||
| Angle | 64 | 66 | ||
| Head-on | 5 | 10 | ||
| Sideswipe: same direction | 23 | 47 | ||
| Sideswipe: opposite direction | 2 | 5 | ||
| Single-vehicle crash | 17 | 17 | ||
| Not reported | 7 | 5 | ||
| Road Surface Conditions | ||||
| Dry | 142 | 176 | ||
| Wet | 29 | 27 | ||
| Snow/ice | 1 | 7 | ||
| Not reported | 5 | 2 | ||
| Ambient Light Conditions | ||||
| Daylight | 116 | 124 | ||
| Dusk | 1 | 4 | ||
| Dawn | 5 | |||
| Dark: lighted roadway | 54 | 77 | ||
| Dark: roadway not lighted | 2 | 1 | ||
| Not reported | 4 | 1 | ||
| Crashes by Roadway Users | ||||
| Vehicle-only | 164 | 202 | ||
| Vehicle-pedestrian | 12 | 8 | ||
| Vehicle-bicycle | 1 | 2 | ||
| Bicycle-pedestrian | ||||
| Crash Location | ||||
| Intersection | 86 | 111 | ||
| Segment | 91 | 101 | ||
| Total Crashes | 177 | 212 | ||
| Before period: CY 2011-2013 (July 2014 notice to proceed) | ||||
| After period: CY 2016-2018 (constructuion completed spring 2015) | ||||
| Source: Central Transportation Planning Staff | ||||
Efforts to improve safety in the project area are ongoing and the section of Hancock Street between North Quincy High School and McDonald’s illustrates progress and opportunity. McDonald’s is located at 275 Hancock Street and reporting authorities record this address for crashes at one of the driveways or the pedestrian crossing. This simplifies the preparation of time-series data to track the crash history at the location.
Table 2 shows a simplified summary of crash history at this location for three distinct two-year periods. The FDR reported a total of 17 crashes here during 2006 and 2007, the most recent data available at that time in 2010. Four of these crashes involved personal injury.
Table 2
Crashes at 275 Hancock Street, Quincy, near North Quincy High School and McDonald’s
Crash Severity |
2006–07 |
2012–13 |
2016–17 |
Property only |
13 |
13 |
16 |
Injury |
4 |
7 |
3 |
Total |
17 |
20 |
19 |
Source: MassDOT IMPACT portal and Central Transportation Planning Staff analysis.
Six years later the 2012–13 total of property damage crashes was the same, but accidents with injuries had almost doubled to seven. Among the seven injuries were two pedestrians and a bicyclist. This crash history is evidence of the conditions prior to construction that the improvements proposed in the FDR were designed to address.
Four years later, after the project was complete, there were fewer injurious crashes at this location during a comparable two-year period. In 2016 and 2017, there were three crashes with injuries. No pedestrians or bicyclists were injured in this period. The three injured persons were all vehicle occupants. The number of property-only crashes increased to 16. However, the recent implementation of signal control at the McDonald’s driveway has the potential to meaningfully reduce crashes at this location.
There were multiple changes in this corridor that contributed to changes in travel patterns:
Traffic volumes for this corridor were collected on Wednesday, March 22, 2023, a typical workday while school was in session. The data were collected from 6:00 AM to 6:00 PM, with the AM peak hour being 7:15 AM to 8:15 AM and the PM peak hour being 5:00 PM to 6:00 PM. See Appendix D for traffic count summaries. Tables 3 and 4 display the traffic volumes for the AM and PM peak periods for the following scenarios:
After the project, all four major intersections experienced a decline in traffic volumes during the AM peak period. The most significant was at the Hancock Street and Hunt Street intersection, which experienced a 20 percent decline. The decrease in traffic at this intersection was due to the reduction of vehicles turning into the MBTA entrance because of the installation of a second entrance to the Red Line station. Additionally, MBTA ridership was still depressed due to the pandemic at the time of data collection and this was likely the cause of the reduction in turning movements at the Hunt Street intersection. Traffic volumes were, surprisingly, four percent lower at the McDonald’s entrance. However, traffic volumes were nearly 500 percent higher on the eastbound approach into the intersection, indicating that the second MBTA entrance, and Target and Starbucks were attracting new trips. These trips, however, were offset by the reduction in traffic volumes on Hancock Street in both directions.
In the PM peak period, traffic volumes were lower at every intersection, with the Hancock Street and Hunt Street intersection experiencing a decrease of 22 percent. This was due to the decline in MBTA ridership, similar to the AM peak period. Unfortunately, data were not available for the eastbound approach near the McDonald’s entrance for the PM peak period for the Before scenario. Therefore, the findings for this time period are inconclusive.
Table 3
Hancock Street Corridor Intersection Approach
AM Peak Hour Traffic Volumes
| Hancock Street (NB/SB) at Hunt Street/MBTA Entrance (EB/WB) | |||||
| Scenario | EB | WB | NB | SB | Total |
| Before (2009) | 90 | 0 | 814 | 702 | 1606 |
| Projected (2029) | 99 | 0 | 900 | 779 | 1778 |
| After (2023) | 37 | 0 | 808 | 435 | 1280 |
| Before/After Difference | -53 | 0 | -6 | -267 | -326 |
| Change (percentage) | -59% | N/A | -1% | -38% | -20% |
| Hancock Street (NB/SB) at McDonalds Entrance (EB/WB) | |||||
| Scenario | EB | WB | NB | SB | Total |
| Before (2009) | 34 | 0 | 902 | 515 | 1451 |
| Projected (2029) | 37 | 0 | 996 | 585 | 1618 |
| After (2023) | 201 | 0 | 783 | 405 | 1389 |
| Before/After Difference | 167 | 0 | -119 | -110 | -62 |
| Change (percentage) | 491% | N/A | -13% | -21% | -4% |
| Hancock Street (NB/SB) at Squantum Streets (EB/WB) | |||||
| Scenario | EB | WB | NB | SB | Total |
| Before (2009) | 606 | 385 | 869 | 498 | 2358 |
| Projected (2029) | 668 | 432 | 919 | 529 | 2548 |
| After (2023) | 591 | 506 | 703 | 463 | 2263 |
| Before/After Difference | -15 | 121 | -166 | -35 | -95 |
| Change (percentage) | -2% | 31% | -19% | -7% | -4% |
| Hancock Street (NB/SB) at Glover Avenue (EB/WB) | |||||
| Scenario | EB | WB | NB | SB | Total |
| Before (2009) | 0 | 55 | 748 | 369 | 1172 |
| Projected (2029) | 0 | 61 | 913 | 409 | 1383 |
| After (2023) | 0 | 180 | 611 | 256 | 1047 |
| Before/After Difference | 0 | 125 | -137 | -113 | -125 |
| Change (percentage) | N/A | 227% | -18% | -31% | -11% |
| EB = eastbound. N/A = not applicable. NB = northbound. SB = southbound. WB = westbound. | |||||
| Sources: MassDOT Project File 605729 Functional Design Report; Central Transportation Planning Staff | |||||
Table 4
Hancock Street Corridor Intersection Approach
PM Peak Hour Traffic Volumes
| Hancock Street (NB/SB) at Hunt Street/MBTA Entrance (EB/WB) | |||||
| Scenario | EB | WB | NB | SB | Total |
| Before (2009) | 253 | 0 | 549 | 848 | 1650 |
| Projected (2029) | 278 | 0 | 717 | 943 | 1938 |
| After (2023) | 30 | 0 | 570 | 685 | 1285 |
| Before/After Difference | -223 | 0 | 21 | -163 | -365 |
| Change (percentage) | -88% | N/A | 4% | -19% | -22% |
| Hancock Street (NB/SB) at McDonalds Entrance (EB/WB) | |||||
| Scenario | EB | WB | NB | SB | Total |
| Before (2009) | N/A | N/A | 687 | 837 | 1524 |
| Projected (2029) | N/A | N/A | 770 | 931 | 1701 |
| After (2023) | 240 | 0 | 629 | 639 | 1508 |
| Before/After Difference | N/A | N/A | -58 | -198 | -16 |
| Change (percentage) | N/A | N/A | -8% | -24% | -1% |
| Hancock Street (NB/SB) at Squantum Streets (EB/WB) | |||||
| Scenario | EB | WB | NB | SB | Total |
| Before (2009) | 583 | 348 | 701 | 838 | 2470 |
| Projected (2029) | 651 | 416 | 734 | 932 | 2733 |
| After (2023) | 607 | 309 | 565 | 675 | 2156 |
| Before/After Difference | 24 | -39 | -136 | -163 | -314 |
| Change (percentage) | 4% | -11% | -19% | -19% | -13% |
| Hancock Street (NB/SB) at Glover Avenue (EB/WB) | |||||
| Scenario | EB | WB | NB | SB | Total |
| Before (2009) | 0 | 51 | 634 | 614 | 1299 |
| Projected (2029) | 0 | 56 | 709 | 689 | 1454 |
| After (2023) | 0 | 62 | 528 | 471 | 1061 |
| Before/After Difference | 0 | 11 | -106 | -143 | -238 |
| Change (percentage) | N/A | 22% | -17% | -23% | -18% |
| Sources: MassDOT Project File 605729 Functional Design Report; Central Transportation Planning Staff | |||||
| EB = eastbound. N/A = not applicable. NB = northbound. SB = southbound. WB = westbound. | |||||
Staff compared the Before (2009) and Projected (2029) LOS, delay and queue timings with the Synchro analysis for the After (2023) data at each intersection. Tables 5 and 6 show the conditions of each scenario for the AM and PM peak period.
The After (2023) LOS for the intersection near the McDonald’s entrance operates at a LOS B, but the eastbound exit of the intersection operates at a E for both the AM and PM peak period. Additionally, the Hancock Street and Squantum Street intersection LOS improved slightly in the AM peak period, from D in 2009 to a C in 2023. However, the Hancock Street and Glover Street intersection experienced a worse decline than expected, with the LOS dropping from an A to a C in the AM peak period, largely due to the increase in traffic on the Glover Street westbound approach. In the PM peak period, the Hancock Street and Squantum Street intersection LOS was projected to improve from an E in 2009 to a C in the 2029 projected scenario, but only improved to a D in 2023. This was a result of the LOS declining on all approaches on Squantum Street between 2009 and 2023.
Table 5
Hancock Street Corridor Intersection
AM Level of Service, Delay, and Queue Length
| N/A | Before1 | N/A | N/A | Projected Build 20292 | N/A | N/A | After3 | N/A | ||
| Intersection / Approach | Movement | LOS | Delay4 | 95% Q5 | LOS | Delay | 95% Q | LOS | Delay | 95% Q |
| Hancock Street and Hunt Street/MBTA Entrance | N/A | N/A | N/A | N/A | N/A | N/A | N/A | N/A | N/A | N/A |
| Hancock Street NB | LTR | C | 20.6 | 323 | A | 6.1 | 224 | A | 2.2 | 42 |
| Hancock Street SB | LTR | B | 13.9 | 193 | A | 6.5 | 226 | A | 1.6 | 41 |
| MBTA EB LT (2009) | LT | C | 32.4 | 63 | E | 72.8 | 102 | |||
| MBTA Entrance EB | LR | A | 9.9 | 0 | ||||||
| MBTA EB R (2009) | R | C | 30.5 | 34 | D | 54.5 | 53 | |||
| Overall | — | B | 18.4 | B | 10.1 | A | 2.1 | |||
| Hancock Street and McDonalds Entrance | N/A | N/A | N/A | N/A | N/A | N/A | N/A | N/A | N/A | N/A |
| Hancock Street NB | LT | A | 7.2 | 165 | ||||||
| Hancock Street SB | TR | A | 4.1 | 55 | ||||||
| McDonalds Entrance | LR | E | 56.6 | 211* | ||||||
| Overall | — | B | 13.4 | |||||||
| Hancock Street and Squantum Street | N/A | N/A | N/A | N/A | N/A | N/A | N/A | N/A | N/A | N/A |
| Hancock Street NB | L | C | 32.8 | 273 | B | 18.9 | 255 | B | 19.4 | 166 |
| Hancock Street NB | TR | C | 30.8 | 766 | B | 16.5 | 294 | B | 18.4 | 200 |
| Hancock Street SB | LT | N/A | N/A | N/A | E | 61.9 | 215 | C | 30.6 | 117 |
| Hancock Street SB | R | N/A | N/A | N/A | C | 26.6 | 223 | A | 5.8 | 65 |
| Hancock Street SB LTR (2009) | LTR | C | 33.2 | 340 | N/A | N/A | N/A | N/A | N/A | N/A |
| Squantum Street EB | L | F | 82.8 | 414 | E | 56.2 | 374 | D | 47.8 | 267 |
| Squantum Street EB | TR | C | 31.8 | 345 | D | 38.6 | 370 | D | 39.2 | 345 |
| Squantum Street WB | L | D | 38.8 | 88 | E | 58.6 | 87 | E | 65.2 | 105 |
| Squantum Street WB | T | D | 52.4 | 363 | E | 71.9 | 279 | E | 70 | 248 |
| Squantum Street WB | R | C | 37.3 | 93 | E | 71.9 | 279 | A | 4.5 | 11 |
| Overall | — | D | 39.9 | D | 40.3 | C | 34 | |||
| Hancock Street and Glover Avenue | N/A | N/A | N/A | N/A | N/A | N/A | N/A | N/A | N/A | N/A |
| Hancock Street NB | TR | A | 8.1 | 524 | A | 9.5 | 178 | B | 13.4 | 307 |
| Hancock Street SB | LT | A | 4.9 | 262 | B | 10 | 330 | A | 9.1 | 228 |
| Glover Street WB | LR | C | 28.3 | 4 | D | 52.5 | 16 | E | 59.5 | 382 |
| Overall | — | A | 8.5 | B | 12.4 | C | 22.3 | |||
| LOS= Level of Service, EB = eastbound. N/A = not applicable. NB = northbound. SB = southbound. WB = westbound 1:2009 2:Projected in FDR 3:2023 4:delay in seconds 5:95th percentile volume Sources: CTPS Analysis, Functional Design Report |
Table 6
Hancock Street Corridor Intersection
PM Level of Service, Delay, and Queue Length
| N/A | Before1 | N/A | N/A | Projected Build 20292 | N/A | N/A | After3 | N/A | ||
| Intersection / Approach | Movement | LOS | Delay4 | 95% Q5 | LOS | Delay | 95% Q | LOS | Delay | 95% Q |
| Hancock Street and Hunt Street/MBTA Entrance | N/A | N/A | N/A | N/A | N/A | N/A | N/A | N/A | N/A | N/A |
| Hancock Street NB | LTR | A | 6.7 | 139 | A | 5.3 | 135 | A | 3.1 | 78 |
| Hancock Street SB | LTR | A | 8.4 | 282 | B | 10.4 | 341 | A | 3 | 85 |
| MBTA EB LT (2009) | LT | C | 26.2 | 131 | E | 64.6 | 202 | N/A | N/A | N/A |
| MBTA Entrance EB | LR | D | 41.6 | 38 | ||||||
| MBTA EB R (2009) | R | C | 22.5 | 87 | D | 49.5 | 133 | N/A | N/A | N/A |
| Overall | — | B | 10.7 | B | 16.5 | A | 4.2 | |||
| Hancock Street and McDonalds Entrance | N/A | N/A | N/A | N/A | ||||||
| Hancock Street NB | LT | A | 9 | 153 | ||||||
| Hancock Street SB | TR | A | 5 | 84 | ||||||
| McDonalds Entrance | LR | E | 61.4 | 263* | ||||||
| Overall | — | B | 15.7 | |||||||
| Hancock Street and Squantum Street | N/A | N/A | N/A | N/A | ||||||
| Hancock Street NB | L | C | 32.8 | 273 | C | 34.2 | 247 | B | 13.9 | 122 |
| Hancock Street NB | TR | C | 30.8 | 766 | B | 13.3 | 218 | B | 12.2 | 140 |
| Hancock Street SB | LT | N/A | N/A | N/A | C | 25 | 506 | C | 25.4 | 226 |
| Hancock Street SB | R | N/A | N/A | N/A | A | 9.1 | 117 | A | 5.3 | 62 |
| Hancock Street SB LTR (2009) | LTR | F | 123.9 | 692 | N/A | N/A | N/A | N/A | N/A | N/A |
| Squantum Street EB | L | D | 35.8 | 273 | E | 56.3 | 236 | D | 53.2 | 249 |
| Squantum Street EB | TR | C | 31.6 | 426 | D | 51.7 | 458 | E | 63.1 | 467 |
| Squantum Street WB | L | D | 37.8 | 111 | F | 108.3 | 105 | F | 86.1 | 83 |
| Squantum Street WB | T | D | 52.1 | 334 | D | 52.2 | 198 | E | 72.6 | 152 |
| Squantum Street WB | R | C | 34.7 | 72 | D | 52.2 | 198 | A | 2.2 | 0 |
| Overall | — | E | 64.3 | C | 33.6 | D | 35.1 | |||
| Hancock Street and Glover Avenue | N/A | N/A | N/A | N/A | ||||||
| Hancock Street NB | TR | A | 6.4 | 416 | A | 4.5 | 384 | A | 6 | 305 |
| Hancock Street SB | LT | A | 6 | 508 | A | 3.3 | 142 | A | 6 | 265 |
| Glover Street WB | LR | C | 29.9 | 20 | D | 53.4 | 29 | C | 28.8 | 36 |
| Overall | — | A | 7.3 | A | 6.2 | A | 7.7 | |||
| LOS= Level of Service, EB = eastbound. N/A = not applicable. NB = northbound. SB = southbound. WB = westbound 1:2009 2:Projected in FDR 3:2023 4:delay in seconds 5:95th percentile volume Sources: CTPS Analysis, Functional Design Report |
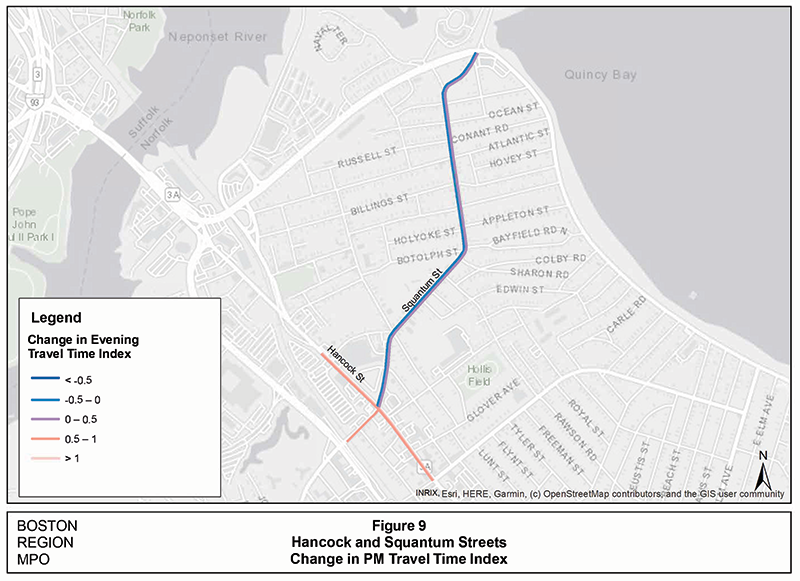
Table 7 shows the change in performance metrics for both the AM and PM periods between 2012 and 2019. Additionally, Figures 8 and 9 show the change in Travel Time Index on both AM and PM peak periods, respectively. Maps for the change in level of travel time reliability (LOTTR), speed, speed index, and congested time are in Appendix A.
Table 7
Change in AM and PM INRIX Performance Metrics—2012 to 2019
Roadway |
Corridor |
Direction |
LOTTR |
Speed |
Travel Time Index |
Speed Index |
Congestion Time |
Hancock Street |
Commander Shea Boulevard to Billings Road |
Northbound |
0.17 (0.2) |
-6.8 (-8.4) |
0.55 (0.66) |
-0.23 (-0.28) |
43.7 (51.1) |
Hancock Street |
Billings Road to Commander Shea Boulevard |
Southbound |
0.08 (0.18) |
-7.8 (-12) |
0.70 (1.77) |
-0.26 (-0.40) |
51.8 (52.5) |
Squantum Street |
Newport Avenue to Quincy Shore Drive |
Northbound |
0.46 (0.12) |
-10 (-10.5) |
0.67 (0.78) |
-0.33 (-0.35) |
45.3 (47.3) |
Squantum Street |
Quincy Shore Drive to Newport Avenue |
Southbound |
0.4 (0.17) |
-10.3 (-10) |
0.88 (1.00) |
-0.34 (-0.33) |
44.3 (46.9) |
Notes: Parentheses () denote PM.
LOTTR = Level of Travel Time Reliability.
Source: INRIX.
The findings are as follows:
Travel time index (TTI)1 : Travel time indices increased on Hancock and Squantum Streets in both directions between 2012 and 2019, and the most significant increase occurred on southbound Hancock Street in the PM peak period..
Speed index (SI)2 : The speed indices decreased from 2012 to 2019 on both Hancock and Squantum Streets, in both directions, in both the AM and PM peak periods. The most significant decrease was on Hancock Street southbound during the PM peak period.
Congested time3 : Congested time measures on both Hancock and Squantum Streets also indicate that congestion has become significantly worse. Congested time has increased by at least 45 minutes per peak period hour at all locations for both peak periods.
Level of travel time reliability (LOTTR)4 : The level of travel time reliability on the roadway increased between 2012 and 2019, but not significantly on Hancock Street. The only notable increase occurred in the AM peak period on Squantum Street both eastbound and westbound
Summary: Based on the performance metrics from the INRIX data, congested conditions on Hancock and Squantum Streets were significantly worse in 2019 than in 2012. However, most changes made at the intersection of Hancock and Squantum Streets were implemented to create safer conditions, rather than address congestion.
Figure 8
Hancock and Squantum Streets
Change in AM Travel Time Index
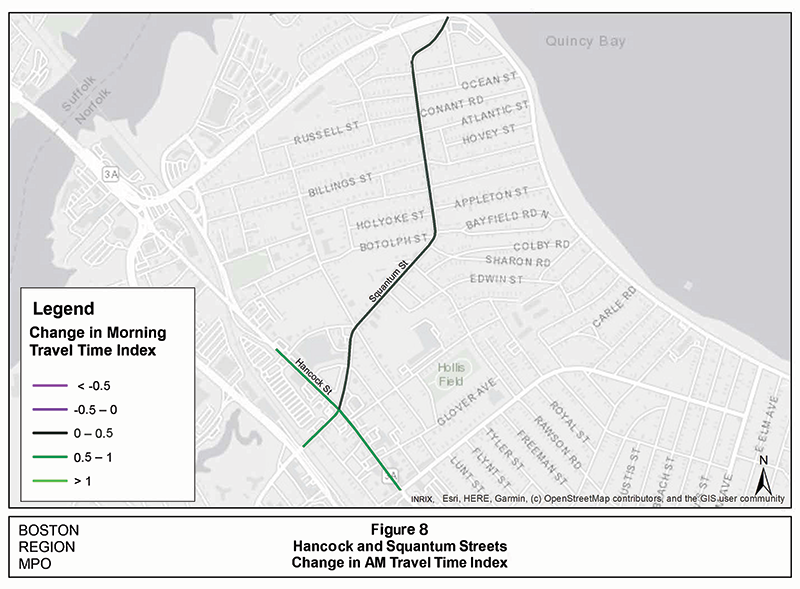
Figure 9
Hancock and Squantum Streets
Change in PM Travel Time Index
A transportation project can significantly influence the patterns of urban development in its vicinity. This is especially true if the project involves land takings and a substantial increase in system capacity. However, it is difficult to predict how simply adding capacity will influence development at or near an improvement. If a transportation system is so overloaded that it cannot function effectively, this condition has the potential to impede what would otherwise be a natural development process in its vicinity.
This does not appear to be the case in Quincy where the central intersection was reaching an unacceptable congestion level. The capacity of the intersection was substantially expanded but the land taken for this expansion, including a gasoline station’s driveway apron, did not harm the urban fabric.
Substantial new housing is being built adjacent to the North Quincy Red Line station. Many of the new residents will be Red Line commuters. It is reasonable to ask whether having just expanded the central intersection, an inexorable process is now underway that will return the intersection to capacity as new residents use the intersection to access the station.
The 2020 FDR hinted at an opportunity for managing potential new traffic in this location. The challenge of accommodating vehicle drop-off and pickup activity at the two nearby schools was mentioned several times in the FDR, usually in the context of a traffic or roadway design issue that required planning. On a field visit, numerous signs were observed in the project area for the purpose of keeping the problem of school-related parking under control. The private automobile has gradually become the mode of choice for school access for many families, partially due to the decrease in school bus service over the last few decades and the perception that other modes of travel, such as bicycling or walking, are unsafe. Ongoing efforts to reverse this trend could help stabilize traffic in the project area in the long term.5
Chapter 3— Lebanon Street Reconstruction, Melrose
Lebanon Street begins at Main Street near the center of Melrose. Branching from Main Street at a narrow angle it gradually turns toward the southeast and reaches the Malden city limits after about 1.5 miles. About one mile into Malden, it reaches the important Route 60 east-west corridor as Maplewood Street.
The project reconstructed or improved the northernmost 0.54 miles of Lebanon Street. Improvements were also made to intersecting streets close to the reconstructed intersections, so the total project length was 0.9 miles. The project corridor included one block of Main Street and six blocks of Lebanon Street, as shown in Figure 10. Main Street is classified as an urban major arterial and Lebanon Street as an urban minor arterial.
Housing is present on all seven blocks of the project corridor—mostly detached two- and three-unit houses. On Main Street some of these buildings have been repurposed as offices. There is an assisted-living complex and a large apartment structure on the northernmost block of Lebanon Street across the street from the Melrose-Wakefield Hospital, which is the only institutional structure on the project corridor. There is a strip mall, including a Whole Foods grocery store, just north of the corridor. Melrose High School is 0.2 miles northwest of this corridor.
Detached housing predominates along the remaining five blocks with single-family homes more common towards the southern end. There are two MBTA bus routes that provide peak-period service every 30 minutes. MBTA bus Route 131 circulates through the nearby residential areas, crossing the project corridor on Grove and Upham Streets. The Route 137 MBTA bus travels on Main Street, passing through the corridor north of the Lebanon Street merge with Main Street. Both routes act as feeder shuttles to the Orange Line via Malden Center.
The reconstruction and improvements were implemented mostly within the existing right-of-way and these efforts brought all project area elements up to current standards. The project received its notice to proceed in July 2014 and construction was completed in spring of 2016. The initial cost estimate in the MassDOT project information database was $4,063,555 and the bid price was $3,837,156. A functional design report prepared in 2007 estimated the cost to be $3,300,000.
The FDR prepared in December 2007 listed a number of deficiencies along the project corridor, including the following:
Most of these deficiencies could be remedied by simply reconstructing to modern standards. Lebanon Street’s problematic intersections with Lynde and Upham streets required redesign of these intersections.
Given that almost all the abutting buildings in the project corridor were houses, significant land takings were not considered an option for addressing these deficiencies. The challenge of this project would be to bring the corridor up to modern standards and improve two intersections using only the preexisting pavement area and ROW.
The project envisioned a uniform pair of 11.5-foot lanes on Lebanon Street within the project area. These travel lanes would be bordered by solid white lines at least 1.5 feet from the granite curb, providing a clearly defined area available to bicycles. Altogether the minimum pavement width is 26 feet. The minimum ROW width is 40 feet. The remaining 14 feet within the ROW could be allocated to sidewalks on both sides of the street, including two-foot landscaped buffers at selected locations.
This minimal 40-foot ROW configuration was implemented in the central three blocks of the project corridor between East Foster and East Emerson Streets, which includes the problematic Upham Street intersection. South of East Foster Street and north of East Emerson Street the ROW widens, and the paved surface could increase to as wide as 29.5 feet. The 23 feet allocated to the paired travel lanes remained constant, but the shoulders could be widened to as much as 6.5 feet for the two directions combined.
Figure 10
Lebanon Street Reconstruction
Project Area
June 2019
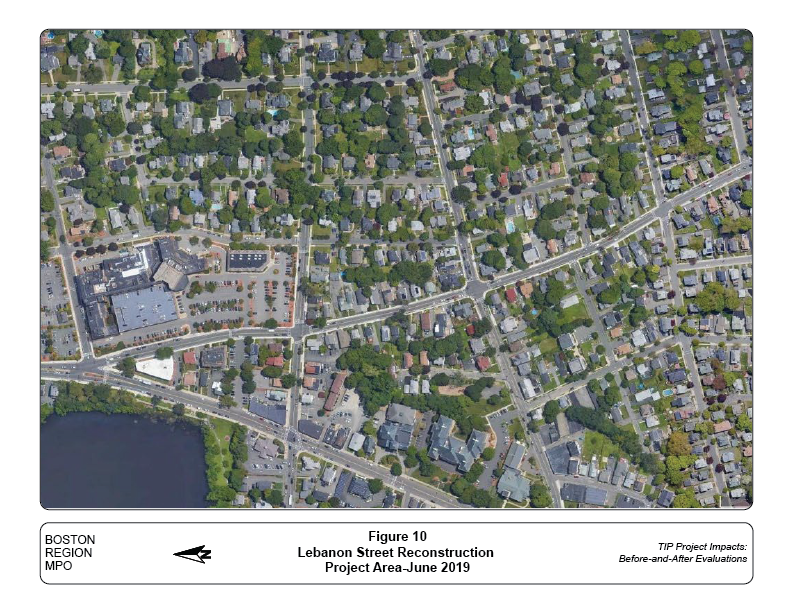
Figure 11
Corner of Grove and Lebanon Streets
September 2007
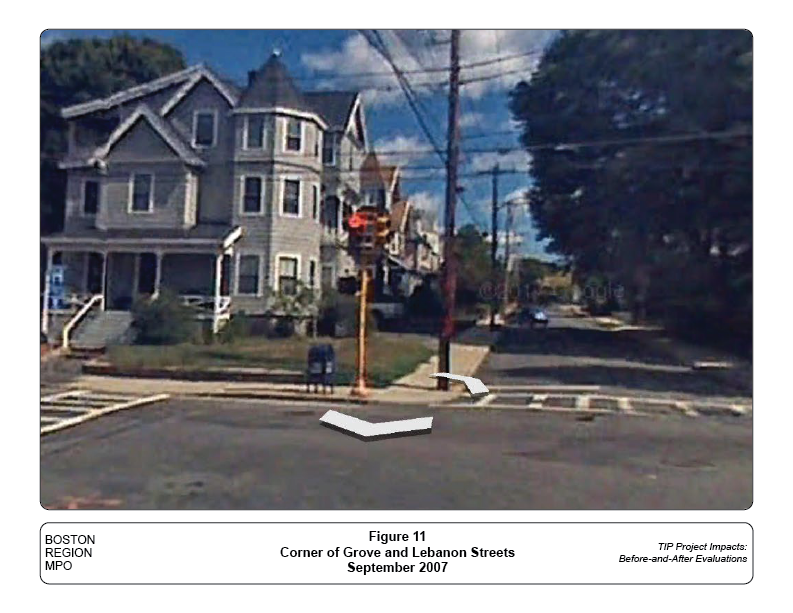
Figure 12
Corner of Grove and Lebanon Streets
September 2018
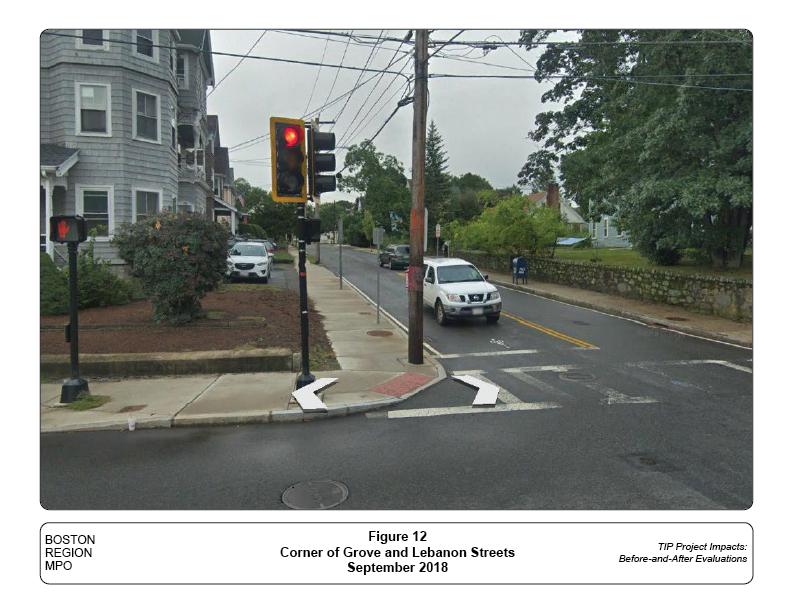
Some small land takings were necessary to accommodate the reconstruction of sidewalks to modern standards. But, as shown in Figures 11 and 12, land takings were minimal. Both images are of the northeast corner of Grove and Lebanon Streets, the southernmost signalized intersection in the project area. The image in Figure 11 is from September 2007. The more recent image in Figure 12 shows substantially the same turning radius at the corner and the same utility pole inches from the curb. The rest of this intersection was redesigned in conjunction with the nearby Lynde Street intersection. However, except for the accessibility ramp, this corner was merely rebuilt, not modified.
Other changes that were implemented include the restriping of on-street parking on Lebanon Street in front of Melrose-Wakefield Hospital, and the addition of bicycle lanes along southbound Main Street. Two-foot grass buffers along the southbound side of Lebanon Street were also built on most locations in this corridor.
The proximity of Grove and Lynde Streets at their intersections with Lebanon Street was mentioned as a deficiency in the FDR. The intersection prior to reconstruction is shown in Figure 13. The faded crosswalk markings are at the signalized intersection of Lebanon Street, aligned north-south, and Grove Street, aligned east-west. The northeast corner of this intersection is the corner shown in Figures 11 and 12.
Lynde Street is a one-way street that terminates at a stop sign at Lebanon Street, as shown in Figure 13. Lynde Street approaches this location from the southwest, and when it meets Lebanon Street it is only 47 feet away from Grove Street. There is a stop sign and a break in the center line of Lebanon Street allowing vehicles on Lynde Street to make a left turn onto Lebanon Street.
Even though no crashes at Lynde Street were reported in the FDR or have been identified in a recent crash analysis, an intersection complex such as the confluence of Lynde, Grove, and Lebanon Streets is intrinsically unsafe because it invites driver confusion with cars entering the intersection from unusual and unexpected directions.
The FDR recommended that Lynde Street be redirected so it would intersect with Grove Street about 100 feet west of Lebanon Street. Grove Street at this point has about one-fourth the traffic of Lebanon Street and, presumably, vehicles would be able to turn from Lynde onto Grove in either direction.
The plan was later modified and Lynde Street was reconstructed in its original alignment, but its intersection with Lebanon Street was modified to allow only a right turn, as shown in Figure 14. A new sidewalk system was constructed throughout the intersection complex, and the new crosswalk at Lynde Street is about half the length as in the previous condition.
The FDR also recommended increasing turning radii at the intersection of Grove and Lebanon Streets but did not mention the specific corners to be redesigned. Three corners, including the northeast corner shown in Figure 12, were reconstructed at their same location. The southwest corner had its turning radius increased in conjunction with a narrowing of the southbound Lebanon Street departure lane.
The departure lane was narrowed to extend the consistent lane width and bicycle accommodation described above. The project limit was a short distance south of this point.
The FDR mentioned one congestion-related deficiency: excessive queues at the signalized intersection of Upham and Lebanon Streets because of the lack of any dedicated left-turn lanes. The preconstruction condition is shown in Figure 15, showing the single approach lanes. Also visible in the aerial photo are deteriorated pavement markings and obsolete asphalt sidewalks.
The delays and congestion resulted in intersection level-of-service ratings in 2007 of E during both the AM and PM peak periods. LOS in 2027 was projected to be F during both the AM and PM peak periods, the lowest score on the A through F LOS scale. LOS levels E and F are considered unacceptable. LOS and related traffic statistics are analyzed by individual traffic movement in the following section.
Figure 13
Lynde, Grove, and Lebanon Streets Intersection
September 2014
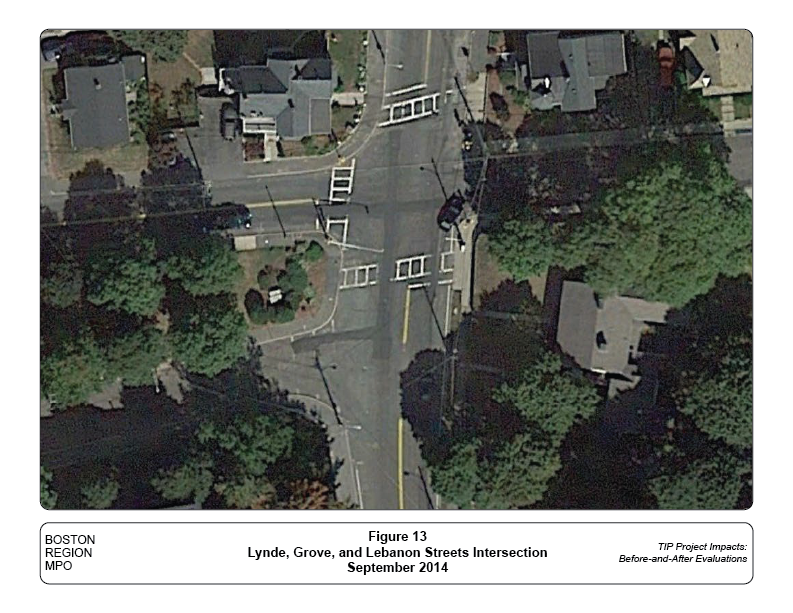
Figure 14
Lynde, Grove, and Lebanon Streets Intersection
May 2016
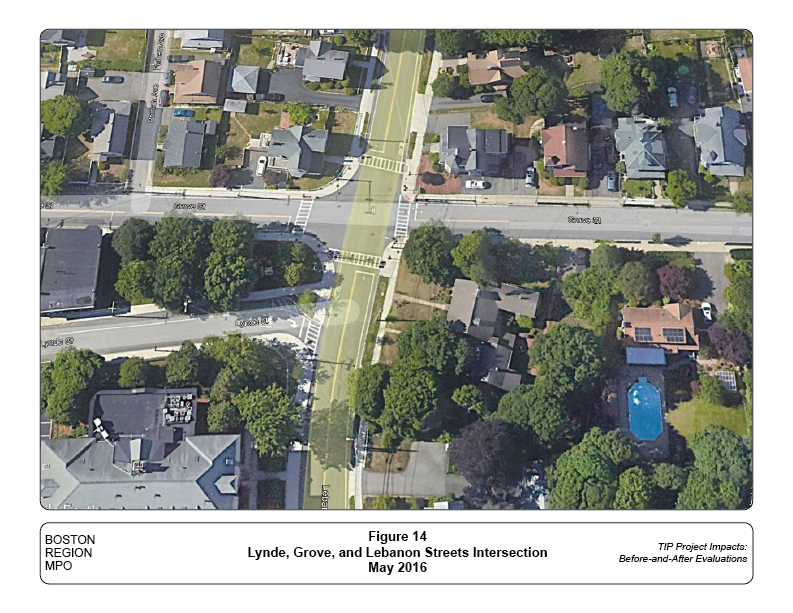
Figure 15
Upham and Lebanon Streets Intersection
September 2014
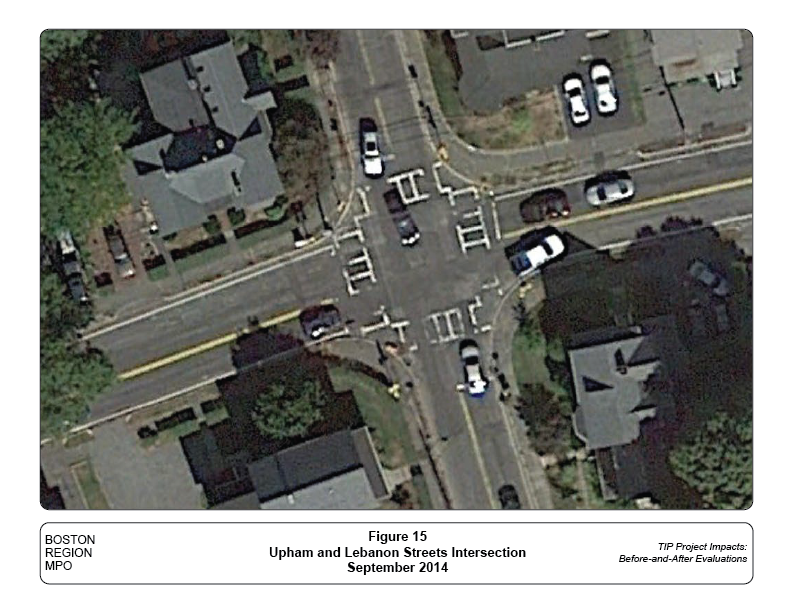
Figure 16
Upham and Lebanon Streets Intersection
May 2016
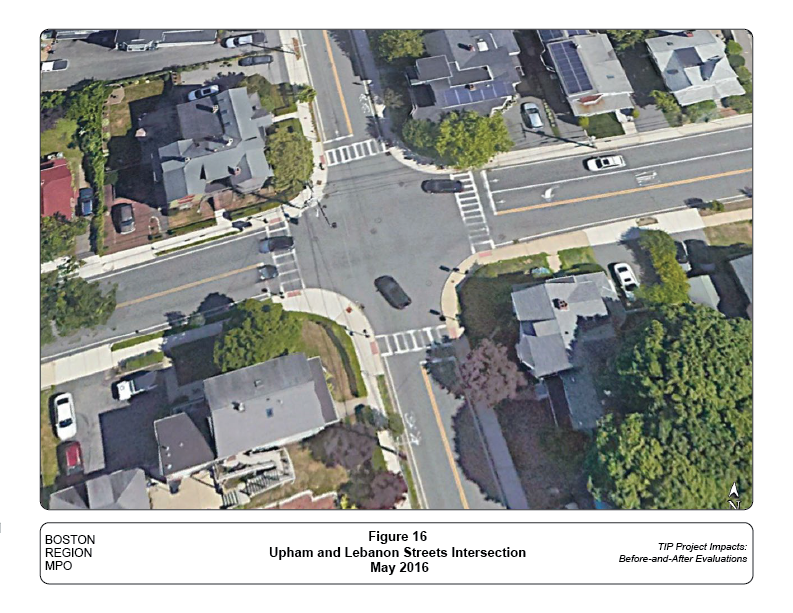
Turning movement counts indicated that the greatest demand for left turns would be for traffic flowing west on Upham Street, both in the AM and PM peak hours. Upham Street has a 50-foot ROW for the entire 140 feet between Lebanon Street and Rowe Street, the first street to the east (see Figure 10). This allowed the addition of a third lane between Rowe and Lebanon Streets, as shown in Figure 16.
Before the improvement the 50-foot ROW had 28 feet of pavement with 12-foot lanes and two-foot shoulders. The remaining 22 feet were available for sidewalks separated from the road by grass strips. The pavement was expanded to 35 feet divided between the three lanes. With 15 feet available for the two sidewalks, grass strips were eliminated on the north side of Upham Street but were incorporated into the reconstructed south side sidewalk system. (The grass strips do not appear in Figure 16.)
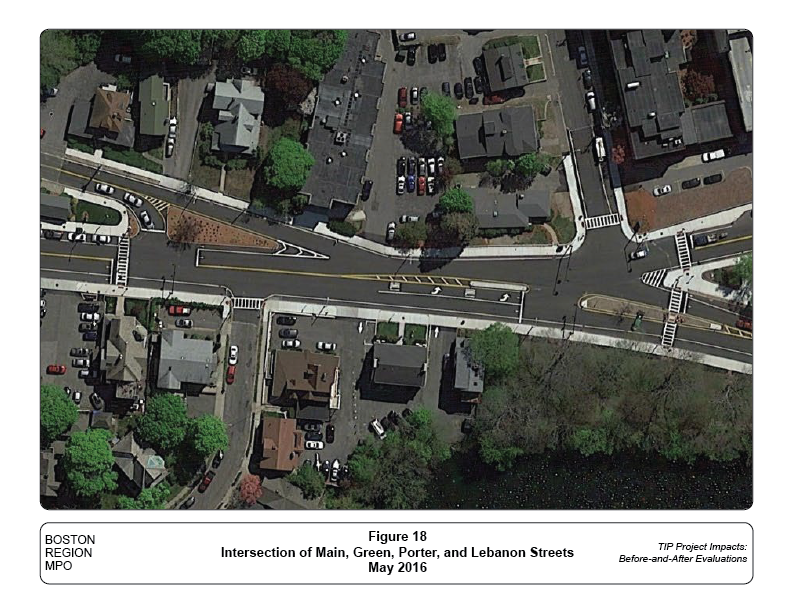
At the north end of Lebanon Street is a complex of intersecting streets including Main Street, the major north-south arterial in the area, and Green and Porter Street branching away from Main Street to the east. This short section of Main Street with its intersections with Green, Porter, and Lebanon Streets was included in the project area, and its configuration prior to reconstruction is shown in Figure 17.
Despite the unusual configuration of the converging roadways at this location, the FDR did not cite any specific deficiencies. Traffic signals are located at two points in this complex, and the worst LOS prior to the project was a C in the PM peak period at three of the approaches. The LOS of the northbound Lebanon Street approach was projected to decline to a D in 2027, still an acceptable LOS. Crash experience here was lower than at the busy Upham Street intersection and the problematic Grove and Lynde Streets.
Figure 18 shows this roadway complex after reconstruction. The key improvement to the configuration was to the delineation of the roadway and pedestrian subsystems throughout the area. Specific actions included the following:
Figure 17
Intersection of Main, Green, Porter, and Lebanon Streets
September 2014
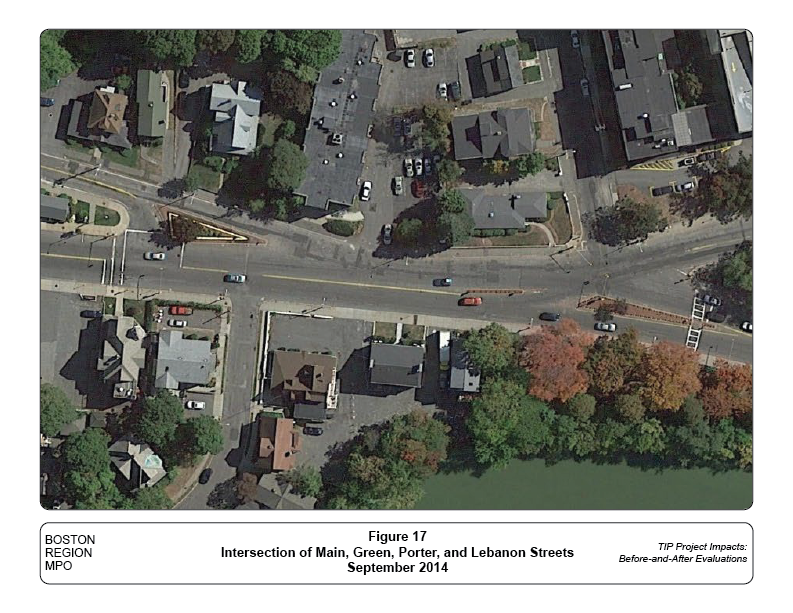
Figure 18
Intersection of Main, Green, Porter, and Lebanon Streets
May 2016
The improvements observed in the project area follow closely the recommendations presented in the FDR. This section estimates how successful the project has been at meeting its transportation goals. More broadly, this section also considers qualitatively how the project has influenced its immediate vicinity. There were three aspects of the evaluation:
Safety was not identified as a deficiency in the FDR and crash rates prior to construction were below the state and Massachusetts Highway Department District 4 averages. However, improving safety was listed as a project objective. The FDR identified 73 crashes in the project area during the 2003–05 period, 27 of which involved injuries.
Crash statistics for the project area are summarized in Table 8. The project was completed in spring of 2016 and project area crash statistics were developed for the calendar year (CY) 2017–19 period. The CY 2018 and 2019 numbers were preliminary at the time of the analysis but generally agreed with crash reports provided by the local police.
For CY 2011–13, the three full years prior to construction, there were a total of 73 crashes in the project area, 18 involving injuries. During the three-year period after project completion, there were 58 crashes with six involving injuries. Most of this improvement is from the number of angle crashes declining from 31 to 12.
The crash rates in the FDR were calculated for intersections by dividing the number of crashes by millions of entering vehicles. The total volume of traffic was counted at the time the FDR was prepared but was not known for the 2011–13 and 2017–19 periods. If traffic has increased since the FDR was prepared, the crash rate may have decreased even more than the decrease in actual crashes.
Table 8
Lebanon Street Corridor Crash Statistics
| All Crashes | ||||
| Crash Variable | Before | After | ||
| Crash Severity | ||||
| Fatal injury | ||||
| Nonfatal injury | 18 | 6 | ||
| Property damage only (none injured) | 50 | 47 | ||
| Not reported | 5 | 5 | ||
| Manner of Collision | ||||
| Rear-end | 21 | 28 | ||
| Angle | 31 | 12 | ||
| Head-on | 2 | 1 | ||
| Sideswipe: same direction | 8 | 7 | ||
| Sideswipe: opposite direction | 3 | 1 | ||
| Single-vehicle crash | 8 | 7 | ||
| Not reported | 2 | |||
| Road Surface Conditions | ||||
| Dry | 64 | 47 | ||
| Wet | 8 | 4 | ||
| Snow/ice | 1 | 5 | ||
| Unknown | 2 | |||
| Ambient Light Conditions | ||||
| Daylight | 49 | 40 | ||
| Dark: lighted roadway | 19 | 15 | ||
| Dusk | 2 | |||
| Dawn | 2 | |||
| Dark: roadway not lighted | 2 | |||
| Not reported | 1 | 1 | ||
| Crashes by Roadway Users | ||||
| Vehicle-only | 71 | 56 | ||
| Vehicle-pedestrian | 2 | 1 | ||
| Vehicle-bicycle | 1 | |||
| Bicycle-pedestrian | ||||
| Crash Location | ||||
| Intersection | 43 | 34 | ||
| Segment | 30 | 24 | ||
| Total Crashes | 73 | 58 | ||
| Before period: CY 2011-2013 (July 2014 notice to proceed) | ||||
| After period: CY 2017-2019 (constructuion completed spring 2016) | ||||
| Source: Central Transportation Planning Staff | ||||
Notable changes to the corridor that could affect traffic patterns include the following:
Traffic volume data for this corridor were collected on Wednesday, March 22, 2023, a typical workday while school was in session. The data were collected from 6:00 AM to 6:00 PM, with the AM peak hour being 7:30 AM to 8:30 AM and the PM peak hour being 4:45 PM to 5:45 PM. See Appendix D for traffic count summaries. Tables 9 and 10 display the traffic volumes for the AM and PM peak periods for the following scenarios:
Overall, after construction traffic volumes during the AM peak period decreased in every intersection except for Lebanon Street at Upham Street (four percent) and Lebanon Street at Grove Street (eight percent). However, some of the other intersections experienced increases in individual turning movements. PM peak period volumes declined at every intersection: the Main Street and Lebanon Street intersection experienced the most significant decrease, 20 percent.
.
Table 9
Lebanon Street Corridor Intersection Approach
AM Peak Hour Traffic Volumes
| Main Street (NB/SB) at Green Street/Crystal Street (EB/WB) | |||||
| Scenario | EB | WB | NB | SB | Total |
| Before (2007) | 0 | 401 | 682 | 699 | 1782 |
| Projected (2027) | 0 | 466 | 792 | 811 | 2069 |
| After (2023) | 0 | 216 | 644 | 660 | 1520 |
| Before/After Difference | 0 | -185 | -38 | -39 | -262 |
| Change (percentage) | N/A | -46% | -6% | -6% | -15% |
| Main Street (NB/SB) at Lebanon Street (EB/WB) | |||||
| Scenario | EB | WB | NB | SB | Total |
| Before (2007) | 0 | 377 | 360 | 1091 | 1828 |
| Projected (2027) | 0 | 438 | 419 | 1265 | 2122 |
| After (2023) | 0 | 385 | 298 | 840 | 1523 |
| Before/After Difference | 0 | 8 | -62 | -251 | -305 |
| Change (percentage) | N/A | 2% | -17% | -23% | -17% |
| Lebanon Street (NB/SB) at Emerson Street (EB/WB) | |||||
| Scenario | EB | WB | NB | SB | Total |
| Before (2007) | 128 | 200 | 349 | 386 | 1063 |
| Projected (2027) | 149 | 232 | 405 | 447 | 1233 |
| After (2023) | 116 | 231 | 414 | 290 | 1051 |
| Before/After Difference | -12 | 31 | 65 | -96 | -12 |
| Change (percentage) | -9% | 16% | 19% | -25% | -1% |
| Lebanon Street (NB/SB) at Upham Street (EB/WB) | |||||
| Scenario | EB | WB | NB | SB | Total |
| Before (2007) | 127 | 606 | 431 | 420 | 1584 |
| Projected (2027) | 147 | 704 | 501 | 487 | 1839 |
| After (2023) | 164 | 663 | 495 | 326 | 1648 |
| Before/After Difference | 37 | 57 | 64 | -94 | 64 |
| Change (percentage) | 29% | 9% | 15% | -22% | 4% |
| Lebanon Street (NB/SB) at Foster Street (EB/WB) | |||||
| Scenario | EB | WB | NB | SB | Total |
| Before (2007) | 114 | 136 | 455 | 651 | 1356 |
| Projected (2027) | 133 | 158 | 528 | 756 | 1575 |
| After (2023) | 118 | 112 | 511 | 605 | 1346 |
| Before/After Difference | 4 | -24 | 56 | -46 | -10 |
| Change (percentage) | 4% | -18% | 12% | -7% | -1% |
| Lebanon Street (NB/SB) at Grove Street (EB/WB) | |||||
| Scenario | EB | WB | NB | SB | Total |
| Before (2007) | 95 | 199 | 428 | 678 | 1400 |
| Projected (2027) | 110 | 231 | 497 | 787 | 1625 |
| After (2023) | 122 | 198 | 571 | 626 | 1517 |
| Before/After Difference | 27 | -1 | 143 | -52 | 117 |
| Change (percentage) | 28% | -1% | 33% | -8% | 8% |
Table 10
Lebanon Street Corridor Intersection Approach
PM Peak Hour Traffic Volumes
| Main Street (NB/SB) at Green Street/Crystal Street (EB/WB) | |||||
| Scenario | EB | WB | NB | SB | Total |
| Before (2007) | 0 | 183 | 1013 | 610 | 1806 |
| Projected (2027) | 0 | 213 | 1176 | 709 | 2098 |
| After (2023) | 0 | 137 | 705 | 613 | 1455 |
| Before/After Difference | 0 | -46 | -308 | 3 | -351 |
| Change (percentage) | N/A | -25% | -30% | 0% | -19% |
| Main Street (NB/SB) at Lebanon Street (EB/WB) | |||||
| Scenario | EB | WB | NB | SB | Total |
| Before (2007) | 0 | 481 | 596 | 782 | 1859 |
| Projected (2027) | 0 | 558 | 692 | 910 | 2160 |
| After (2023) | 0 | 359 | 361 | 731 | 1451 |
| Before/After Difference | 0 | -122 | -235 | -51 | -408 |
| Change (percentage) | N/A | -25% | -39% | -7% | -22% |
| Lebanon Street (NB/SB) at Emerson Street (EB/WB) | |||||
| Scenario | EB | WB | NB | SB | Total |
| Before (2007) | 193 | 113 | 487 | 350 | 1143 |
| Projected (2027) | 224 | 131 | 565 | 407 | 1327 |
| After (2023) | 172 | 95 | 392 | 303 | 962 |
| Before/After Difference | -21 | -18 | -95 | -47 | -181 |
| Change (percentage) | -11% | -16% | -20% | -13% | -16% |
| Lebanon Street (NB/SB) at Upham Street (EB/WB) | |||||
| Scenario | EB | WB | NB | SB | Total |
| Before (2007) | 199 | 529 | 611 | 370 | 1709 |
| Projected (2027) | 231 | 614 | 710 | 430 | 1985 |
| After (2023) | 191 | 391 | 553 | 398 | 1533 |
| Before/After Difference | -8 | -138 | -58 | 28 | -176 |
| Change (percentage) | -4% | -26% | -9% | 8% | -10% |
| Lebanon Street (NB/SB) at Foster Street (EB/WB) | |||||
| Scenario | EB | WB | NB | SB | Total |
| Before (2007) | 169 | 43 | 666 | 519 | 1397 |
| Projected (2027) | 197 | 49 | 774 | 601 | 1621 |
| After (2023) | 162 | 29 | 577 | 495 | 1263 |
| Before/After Difference | -7 | -14 | -89 | -24 | -134 |
| Change (percentage) | -4% | -33% | -13% | -5% | -10% |
| Lebanon Street (NB/SB) at Grove Street (EB/WB) | |||||
| Scenario | EB | WB | NB | SB | Total |
| Before (2007) | 180 | 120 | 680 | 540 | 1520 |
| Projected (2027) | 209 | 139 | 790 | 626 | 1764 |
| After (2023) | 225 | 109 | 568 | 535 | 1437 |
| Before/After Difference | 45 | -11 | -112 | -5 | -83 |
| Change (percentage) | 25% | -9% | -16% | -1% | -5% |
Staff compared the Before (2009) and projected (2027) LOS, delay, and queue timings with a Synchro analysis for the After (2023) data at each intersection in the Lebanon corridor. Tables 11 and 12 show the conditions of each scenario for the AM and PM peak period.
In both the AM and PM peak period, the LOS for Main Street and Lebanon Street was projected to remain at an LOS of B but actually declined to E. This decline was due to the reduced LOS related to the left-turn movement on Main Street southbound, which changed from C to F, and the reduced LOS on Lebanon Street northbound, which changed from C to E, for both the AM and PM peak periods. Additionally, the improvements on Upham Street and Lebanon Street were projected to improve to a D but only improved to a C, which reflects the improvement for the westbound movements at this intersection.
Table 11
Lebanon Street Corridor Intersection
AM Level of Service, Delay, and Queue Length
| N/A | 2007 Before1 | N/A | N/A | 2027 Projected2 | N/A | N/A | 2023 After3 | N/A | ||
| Intersection / Approach | Movement | LOS | Delay4 | 95% Q5 | LOS | Delay | 95% Q | LOS | Delay | 95% Q |
| Main Street at Green Street | N/A | N/A | N/A | N/A | N/A | N/A | N/A | N/A | N/A | N/A |
| Main Street NB | T | C | 9.4 | 147 | B | 15.9 | 295* | C | 27.9 | 336* |
| Main Street NB | R | A | 0.2 | 0 | A | 0.2 | 0 | A | 0 | 0 |
| Main Street SB | TR | B | 12.2 | 291 | D | 47.7 | 746* | B | 10.3 | 352 |
| Green Street WB | LR | D | 47.7 | 333* | C | 28.9 | 439* | E | 57.3 | 224* |
| Overall | — | B | 18.4 | C | 29.1 | C | 24.5 | |||
| Main Street and Lebanon Street | N/A | N/A | N/A | N/A | N/A | N/A | N/A | N/A | N/A | N/A |
| Main Street NB | TR | C | 23.6 | 281 | E | 63.8 | 280 | D | 42.2 | 404 |
| Main Street SB | T | A | 3.3 | 39 | A | 1.4 | 0 | C | 23.3 | 371* |
| Main Street SB | L | C | 32 | 342* | A | 0.6 | 0 | F | 130 | 448 |
| Lebanon Street NB | TR | C | 24.3 | 274 | B | 18.3 | 181 | E | 65.1 | 441 |
| Overall | — | B | 18.4 | B | 18.2 | E | 61.6 | |||
| Emerson Street and Lebanon Street | N/A | N/A | N/A | N/A | N/A | N/A | N/A | N/A | N/A | N/A |
| Emerson Street EB | LTR | C | 20.2 | 101 | C | 28 | 123 | C | 20.9 | 70 |
| Emerson Street WB | LTR | C | 28 | 169 | D | 39.3 | 202 | C | 33.8 | 164 |
| Lebanon Street NB | LTR | B | 10.5 | 207 | A | 6.9 | 109 | B | 12.1 | 213 |
| Lebanon Street SB | LTR | B | 10.4 | 226 | A | 8.7 | 218 | A | 9.5 | 136 |
| Overall | — | B | 14.9 | B | 16.1 | B | 17.5 | |||
| Upham Street and Lebanon Street | N/A | N/A | N/A | N/A | N/A | N/A | N/A | N/A | N/A | N/A |
| Upham Street EB | LTR | B | 15 | 92 | E | 59 | 184* | C | 21.1 | 110 |
| Upham Street WB | L | F | 145 | 660* | D | 39 | 258* | E | 75.3 | 299* |
| Upham Street WB (LTR in 2007) | TR | F | 145 | 660* | C | 34 | 306 | C | 29.8 | 234 |
| Lebanon Street NB | LTR | B | 18 | 304 | C | 24 | 490* | B | 14.9 | 247 |
| Lebanon Street SB | LTR | C | 24 | 365* | C | 26 | 504* | B | 13.3 | 159 |
| Overall | — | E | 65.6 | D | 35 | C | 30.4 | |||
| Foster Street and Lebanon Street | N/A | N/A | N/A | N/A | N/A | N/A | N/A | N/A | N/A | N/A |
| Foster Street EB | LTR | B | 16.8 | *71 | D | 35.7 | 111 | D | 38 | 101 |
| Foster Street WB | LTR | C | 20.3 | *97 | D | 41.5 | 146 | D | 43.5 | 100 |
| Lebanon Street NB | LTR | B | 13.2 | *357 | A | 8.5 | 229 | A | 7.7 | 208 |
| Lebanon Street SB | LTR | B | 13 | *468 | A | 7.9 | 508* | A | 7.7 | 258* |
| Overall | — | B | 14.2 | B | 17.3 | B | 14.2 | |||
| Grove Street and Lebanon Street | N/A | N/A | N/A | N/A | N/A | N/A | N/A | N/A | N/A | N/A |
| Grove Street EB | LTR | C | 20 | 67 | C | 34.8 | 89 | D | 40.2 | 103 |
| Grove Street WB | LTR | C | 26.3 | 161 | D | 50.9 | 224* | E | 60.2 | 174 |
| Lebanon Street NB | LTR | B | 10.7 | 236* | B | 11.1 | 326* | B | 14.4 | 294* |
| Lebanon Street SB | LTR | B | 13.3 | 389 | A | 9.7 | 624* | B | 11.6 | 296* |
| Overall | — | B | 15.1 | B | 18.9 | C | 22.8 |
1 2007 2 Projected in functional design report, 2027 3 2023 4 delay in seconds 5 95th percentile volume EB = eastbound. NB = northbound. LOS = level of service. SB = southbound. WB = westbound.
Table 12
Lebanon Street Corridor Intersection
PM Level of Service, Delay, and Queue Length
| N/A | 2007 Before1 | N/A | N/A | 2027 Projected2 | N/A | N/A | 2023 After3 | N/A | ||
| Intersection / Approach | Movement | LOS | Delay4 | 95% Q5 | LOS | Delay | 95% Q | LOS | Delay | 95% Q |
| Main Street at Green Street | N/A | N/A | N/A | N/A | N/A | N/A | N/A | N/A | N/A | N/A |
| Main Street NB | T | A | 8.3 | 227 | A | 9.7 | 369* | C | 22.5 | 331* |
| Main Street NB | R | A | 0.4 | 0 | A | 0.2 | 0 | A | 0 | 0 |
| Main Street SB | TR | A | 6.5 | 235 | B | 11.7 | 625* | A | 7 | 438 |
| Green Street WB | LR | D | 40.3 | 163 | E | 59.4 | 248 | D | 50.4 | 68 |
| Overall | — | A | 9.2 | B | 13.3 | B | 18.7 | |||
| Main Street and Lebanon Street | N/A | N/A | N/A | N/A | ||||||
| Main Street NB | TR | C | 29.4 | 335 | E | 74.5 | 710* | D | 43.3 | 545* |
| Main Street SB | T | A | 1.9 | 25 | A | 0.7 | 26 | B | 14.9 | 148 |
| Main Street SB | L | C | 29.1 | 254* | A | 2 | 85 | F | 129.1 | 453 |
| Lebanon Street NB | TR | C | 31.1 | 495* | D | 43.1 | 957* | E | 64.5 | 314 |
| Overall | — | C | 24 | C | 34.3 | E | 61.9 | |||
| Emerson Street and Lebanon Street | N/A | N/A | N/A | N/A | ||||||
| Emerson Street EB | LTR | C | 24.5 | 152 | C | 34.5 | 185 | C | 28.2 | 116 |
| Emerson Street WB | LTR | C | 22.2 | 96 | C | 30 | 115 | C | 25.5 | 75 |
| Lebanon Street NB | LTR | B | 11 | 304 | A | 5.2 | 120* | B | 10.5 | 172 |
| Lebanon Street SB | LTR | A | 8.9 | 188 | A | 9.2 | 233 | A | 8.8 | 125 |
| Overall | — | B | 13.9 | B | 14 | B | 15 | |||
| Upham Street and Lebanon Street | N/A | N/A | N/A | N/A | ||||||
| Upham Street EB | LTR | B | 17.1 | 136 | E | 65.6 | 250* | C | 23.2 | 126 |
| Upham Street WB | L | F | 156 | 615* | D | 38.4 | 198* | D | 37.9 | 146 |
| Upham Street WB (LTR in 2007) | TR | F | 156 | 615* | C | 33.2 | 307* | C | 23.4 | 133 |
| Lebanon Street NB | LTR | C | 25.5 | 515* | B | 16.5 | 678* | B | 14.5 | 284* |
| Lebanon Street SB | LTR | C | 30.9 | 365* | D | 45.8 | 497* | B | 16.7 | 236 |
| Overall | — | E | 66.2 | D | 35 | C | 20.3 | |||
| Foster Street and Lebanon Street | N/A | N/A | N/A | N/A | ||||||
| Foster Street EB | LTR | B | 19.2 | 109 | D | 41.1 | 169 | D | 46.5 | 144 |
| Foster Street WB | LTR | B | 16.5 | 34 | C | 28.7 | 49 | C | 26.2 | 31 |
| Lebanon Street NB | LTR | B | 16.1 | 558* | B | 13.1 | 698* | A | 9.5 | 244 |
| Lebanon Street SB | LTR | B | 11.2 | 332* | B | 13 | 434* | A | 7.4 | 193 |
| Overall | — | B | 14.7 | B | 17.3 | B | 14.3 | |||
| Grove Street and Lebanon Street | N/A | N/A | N/A | N/A | ||||||
| Grove Street EB | LTR | C | 22.7 | 141 | D | 40.4 | 200* | F | 94.4 | 211* |
| Grove Street WB | LTR | C | 20.9 | 100 | C | 32.6 | 130 | C | 31.8 | 96 |
| Lebanon Street NB | LTR | B | 14.5 | 438* | B | 14.9 | 661* | B | 13.1 | 268* |
| Lebanon Street SB | LTR | B | 12 | 318 | A | 7.5 | 155 | B | 10.4 | 233* |
| Overall | — | B | 15.1 | B | 16.6 | C | 29.6 |
1 2007 2 Projected in functional design report, 2027 3 2023 4 delay in seconds 5 95th percentile volume EB = eastbound. NB = northbound. LOS = level of service. SB = southbound. WB = westbound.
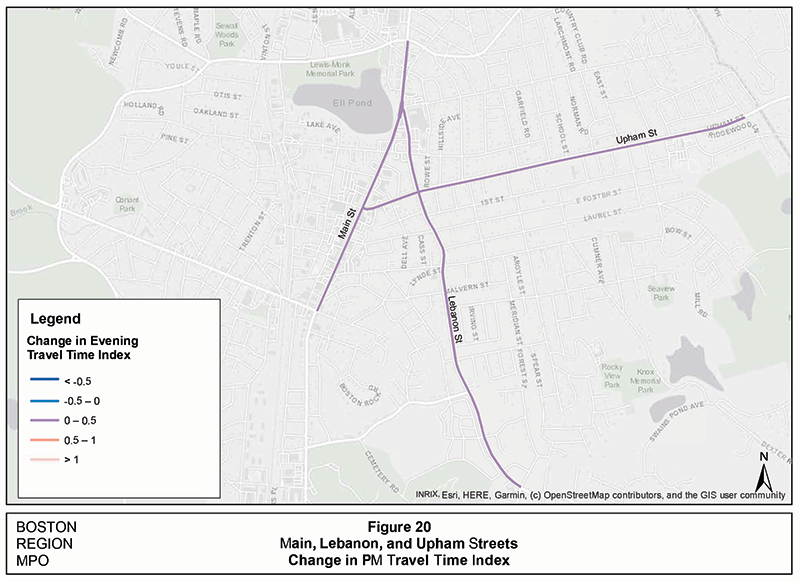
Table 13 shows the change in INRIX performance metrics for both the AM and PM peak periods between 2012 and 2019 for Lebanon Street, Main Street, and Upham Street. Additionally, Figures 19 and 20 display the change in travel time index for both the AM and PM peak periods, respectively. Maps displaying the change in LOTTR, speed, speed index, and congested time are in Appendix A.
Table 13
Change in AM and PM INRIX Performance Metrics—2012 to 2019
Lebanon Street Corridor
Roadway |
Corridor |
Direction |
LOTTR |
Speed |
Travel Time Index |
Speed Index |
Congestion Time |
Main Street |
Wyoming Avenue to Lynn Fells Parkway |
Northbound |
0.02 (0.04) |
-3.7 (-5.8) |
0.07 (0.36) |
-0.15 (-0.23) |
1.9 (0.5) |
Main Street |
Lynn Fells Parkway to Wyoming Avenue |
Southbound |
0.07 (0.14) |
-4.8 (-4.6) |
0.32 (0.31) |
-0.19 (-0.19) |
7.5 (3.5) |
Lebanon Street |
Forest Street to Main Street |
Northbound |
0.08 (0.09) |
-6.1 (-6.9) |
0.14 (0.22) |
-0.24 (-0.27) |
27.1 (43.6) |
Lebanon Street |
Main Street to Forest Street |
Southbound |
0.13 (0.07) |
-4.7 (-4.5) |
0.04 (0.03) |
-0.19 (-0.18) |
19.4 (26.3) |
Upham Street |
Main Street to Wildwood Road |
Eastbound |
0.05 (0.05) |
-2.6 (-3.9) |
0.04 (0.11) |
-0.1 (-0.16) |
0.9 (0.5) |
Upham Street |
Wildwood Road to Main Street |
Westbound |
0.1 (0.09) |
-3.5 (-3.0) |
0.04 (0.01) |
-0.14 (-0.12) |
3.5 (0.6) |
Note: Parentheses () denote PM.
LOTTR = Level of Travel Time Reliability.
Source: INRIX.
The findings are as follows:
Travel time index: TTI increased in every location in both the AM and PM peak periods. However, it only increased significantly on Main Street northbound (PM), southbound (both peak periods), and Lebanon Street northbound (PM).
Speed index: The speed index decreased in every location for both the AM and PM peak periods. However, it only decreased significantly at Main Street northbound (PM) and Lebanon Street (both peak periods).
Congestion time: Congested time increased at every location for both the AM and PM peak periods. However, congested time only increased significantly on Lebanon Street in both directions (both peak periods), specifically with an increase of 43.6 minutes in the northbound direction during the PM peak period.
Level of travel time reliability: LOTTR increased in every location in every peak period. However, there was no significant increase at any location between 2012 and 2019.
Summary: The changes made to the Lebanon Street and Main Street corridor likely did not have a significant impact on the congestion issues that appear in 2019. Minor changes were made to the roadway, most of which consisted of tightening intersections and delineating lanes and crossings. Any signal-timing changes, in addition to a growing population, likely led to the increase in congested conditions on Lebanon Street in Melrose.
Figure 19
Main, Lebanon, and Upham Streets Change in AM Travel Time Index
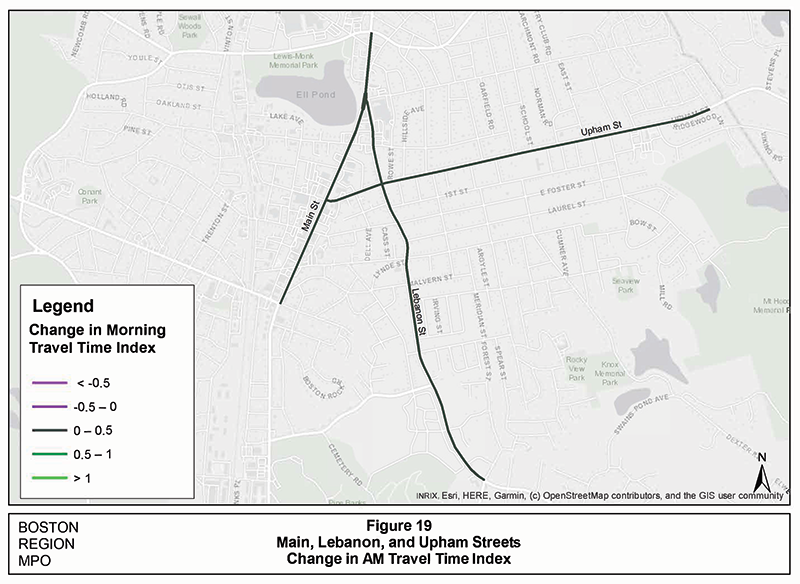
Figure 20
Main, Lebanon, and Upham Streets Change in PM Travel Time Index
The project corridor is mostly residential in character. The project improvements were implemented with only minimal land takings, preserving this residential character.
In addition to refurbishing the physical elements of the roadway, the improvements within the existing ROW addressed two issues:
Lebanon Street is an important travel corridor that connects Melrose with Route 60 in east Malden. Despite gradual long-term growth in regional traffic, only the intersection with Upham Street was unacceptably congested. The availability of a larger ROW on Upham Street allowed the addition of a left-turn lane by only adding a few feet of pavement width on one Upham Street approach.
The widening of Upham Street was the only expansion of the paved surface in the project area. At other locations, notably Lynde Street at the South and Main Street at the north, the pavement area was reduced. The purpose of these pavement reductions was to improve roadway delineation in oddly configured intersections. These changes also had the effect of reinforcing the residential character of the corridor.
Improvement of the roadway surface, replacement of any drainage grates that can catch bicycle wheels, and the application of stripes that clearly delineate the edge of the vehicle travel lanes are basic improvements that recognize and facilitate use of bicycles on roadways. These improvements were implemented throughout the project area and, together with reconstruction of the sidewalk system, have enhanced the residential nature of the project area. Outside of the paved area, the sidewalk system was rebuilt to modern standards and some land takings were required for the sidewalk improvements.
Chapter 4— Broadway Reconstruction, East Somerville
Regional travel demand and traffic have gradually increased in line with demographic and economic growth and increased average commute distances. Accommodating this growth on the region’s transit systems and roadways is an ongoing challenge to planners and public authorities. In certain parts of the transportation system, however, critical corridors are effectively bypassed by newer system elements offering more capacity and better connectivity. This allows consideration of repurposing the older facility to better address contemporary planning challenges.
Prior to the 1950s, Broadway was the only practical route between Somerville and Boston. The 100-foot-wide ROW in the project area reflected its importance, allowing ample space for streetcars, parking, freight loading and unloading, and the level of regional traffic at the time.
When it became apparent that even major municipal arteries such as Broadway would not be able to accommodate regional traffic growth, the then Metropolitan District Commission was charged with building a system of improved roadway corridors throughout the region. The Fellsway and McGrath Highway in Somerville, and O’Brien Highway in Cambridge, completed in the 1950s, were part of this regional system.
After Interstate 93 was connected to the Central Artery in 1973, the section of Broadway between McGrath Highway and Sullivan Square was no longer the path of choice for a significant amount regional traffic. The Broadway Reconstruction project responded to this new condition by significantly reducing the pavement area, widening the sidewalks, and adding streetscape enhancements. The intended result was a thriving urban promenade with a freshly conceived design that provides both amenities and transportation to support local businesses and residents.
This project received its notice to proceed in June 2012 and construction was completed in autumn of 2015. The initial cost estimate in the MassDOT project information database was $6,921,906 and the bid price was $7,917,176.
Every project can have unique complexities and implications for planning and design. In describing and evaluating the reconstruction of this part of Broadway, three planning considerations seemed especially relevant:
Unlike adding capacity, which can be expensive and technically and administratively challenging, reducing capacity is easy to physically implement. Care had to be exercised so that the vehicle flow necessary for the urban activities being encouraged was appropriately facilitated. Possible unforeseen impacts on nearby roadway locations must also be estimated and planned for, if necessary.
Parking is a critical subsystem of every transportation mode. In the most limited transportation sense, parking is the beginning and end of the vehicle link of a person trip, goods movement, or service call. This project envisioned the new Broadway as a catalyst for a vibrant urban lifestyle. This was an ambitious goal that the parking subsystem was expected to fully complement.
Well planned and built transportation infrastructure can reduce costs and increase the convenience of travel and goods movement in its vicinity. However, the influence that infrastructure has on the amount and type of economic and social activity that ensues is limited. The new urban ambiance uses the reconstructed Broadway, but is also formed by the actions of many groups and individuals.
Figures 21 and 22 are aerial photos of the project corridor as it appeared in June 2010 and June 2019 respectively. Even at this scale the wider reconstructed sidewalks and comprehensive crosswalk system in 2019 are distinctly visible. In the earlier photo some trees are visible in the median segments, but in the later photo trees are throughout the corridor. The intersection of Broadway and McGrath Highway, shown at the upper left of these figures, was not within the project area. It is, however, a key location for evaluating project-related traffic impacts.
Figure 21
Broadway Reconstruction
Project Area
June 2010
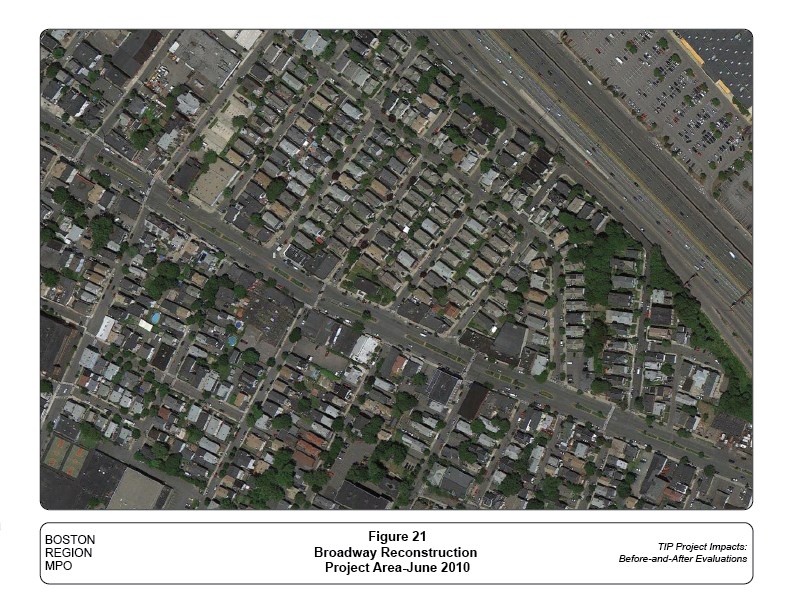
Figure 22
Broadway Reconstruction
Project Area
June 2019
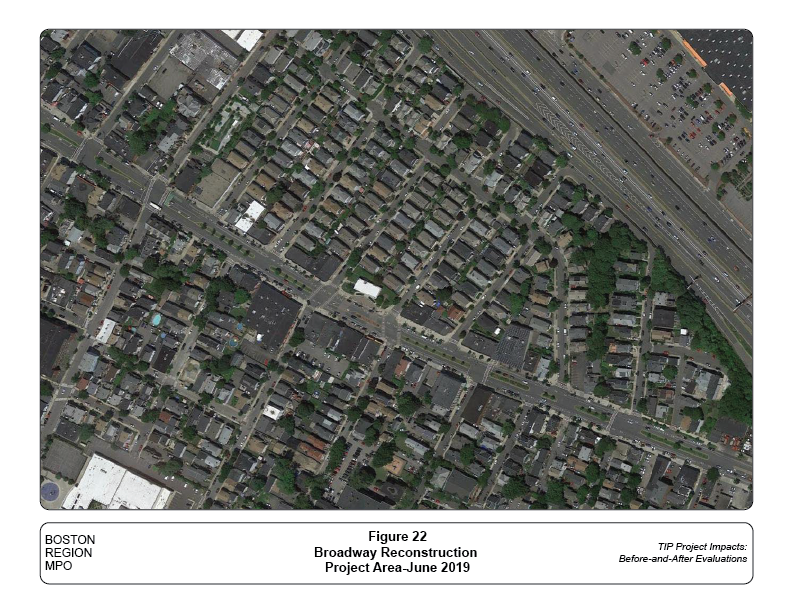
The traffic analysis performed for the FDR indicated that at current and anticipated levels of traffic, four travel lanes would be required only at the western end of the project corridor between McGrath Highway and Cross Street. East of Cross Street the corridor could be reconstructed with only two vehicular travel lanes. Traffic LOS would remain acceptable throughout the rebuilt corridor, and coordination of adjacent signals and other traffic control improvements would largely compensate for the loss of travel lanes. The LOS impacts are discussed more fully in the following section.
Reducing the number of travel lanes to two allowed a complete redesign of much of the project corridor. Figure 23 shows the streetscape in front of the East Somerville Branch Library as it was in 2010 and Figure 24 shows the same location in 2019. The prominent paved circle has no traffic importance and is discussed later as an urban design element.
The FDR summarized the allocation of the 100-foot ROW at this location in 2007 as having two nine-foot sidewalks and a roadway width of 82 feet. The median with its protected left-turn sections was 14-feet wide, and the remaining 68 feet of paved surface was divided into 34-foot northbound and southbound barrels. Each of these 34-foot barrels allowed for two travel lanes and a parking lane. A few pavement markings in the 2010 aerial photo (Figure 23) define this expansive lane system.
The FDR recommended that sidewalk widths be increased by an average of seven feet. This would increase the total width allocated to sidewalks from 18 to 32 feet and reduce the roadway width from 82 feet to 68 feet, 34 feet for each direction. The sidewalks, including adjacent brick treatments, were widened throughout the project area, and spot checks on aerial photos suggest that the sum of the sidewalk widths on the two sides of Broadway sum to at least 32 feet even if the sidewalk widths are not uniform on the two sides of Broadway.
The FDR recommended that the 34 feet of roadway in each direction be allocated to an eight-foot parking lane, 5.5-foot bicycle lane, 12-foot vehicle travel lane, and 1.5-foot offset from the reconstructed median. This would be a total of 27 feet of pavement between the sidewalk and the median and would allow for a 14-foot median.
The competed project departed from this allocation throughout the corridor in one key respect. The lane system described in the FDR would have had the edge of the vehicle lane 13.5 feet away from the curb, the sum of the eight-foot parking lane and 5.5-foot bicycle lane. In the lane system shown in Figure 24, the outer edge of each bicycle lane is about 15.5 feet away from the curb and a pair of solid white stripes define two-foot-wide buffers between each bicycle lane and the parked cars. The extra two feet required for the buffers were obtained by reducing the width of the travel lanes to 11 feet and reducing the width of the median.
On-street parking was recognized as a critical transportation subsystem necessary to successfully transform the streetscape from an obsolete thoroughfare to a center of neighborhood activity. Roughly the same amount of curb space was made available for parking after reconstruction as before, though the rules governing stretches of on-street parking were modified somewhat.
The key challenge presented by the new parking system was that there was no longer an abundance of underutilized pavement available for unauthorized double parking. When there were commercial loading zones, trucks might speed up their delivery by stopping on Broadway in front of the business. Double parking by private autos in the expansive roadway to drop someone off, pick someone up, or make a quick purchase was routine. Double parking in the new streetscape would totally block the bicycle lane and impinge on the one vehicular lane.
The modifications to the curbside parking system were made to severely curtail the practice of double parking. Before the improvements there had been 19 totally unrestricted parking spaces that were mostly used for long-term parking. Unrestricted spaces might be occupied by an employee of a local business but are not likely to be used by customers unless they are making a purchase at the beginning or end of the time the car is parked. After reconstruction, parking duration was generally limited to two hours between 8:00 AM and 8:00 PM Monday through Saturday. The 94 parking meters charge 25 cents per 12 minutes, or $2.50 for two hours. There are 16 unmetered spaces, but they also have the two-hour time limit.
The new loading zone design is shown in Figure 25. The loading zone is about two car-lengths of curb space delimited by a pair of signs. The loading zone is at the front of a block, so the driver will have additional space to maneuver the truck out of the single travel lane. The signs in Figure 26 show that use is restricted to loading between 8:00 AM and 6:00 PM on weekdays and 8:00 AM and 1:00 PM on Saturdays. Vehicles with commercial plates are allowed 20 minutes and vehicles with passenger plates are allowed five minutes. There are now eight loading zones, most of this configuration, with four on each side of Broadway.
Figure 23
Streetscape in Front of East Somerville Branch Library
June 2010
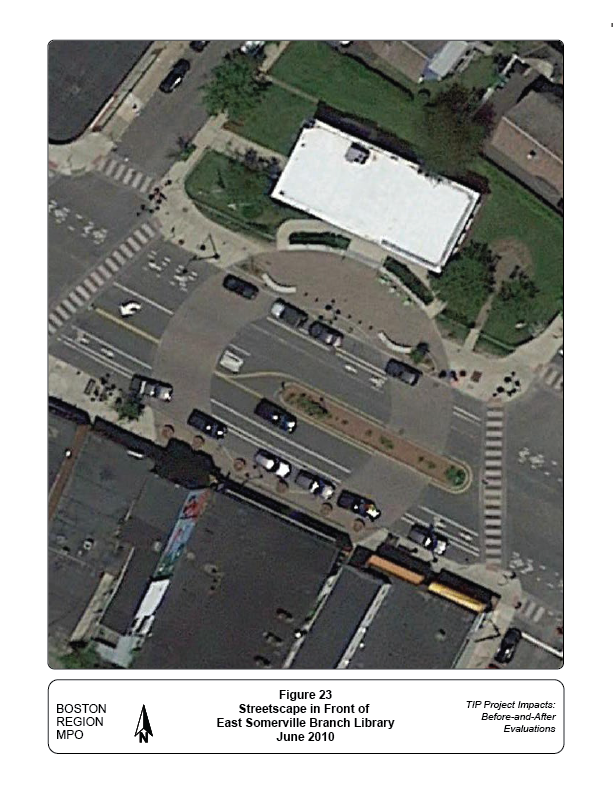
Figure 24
Streetscape in Front of East Somerville Branch Library
June 2019
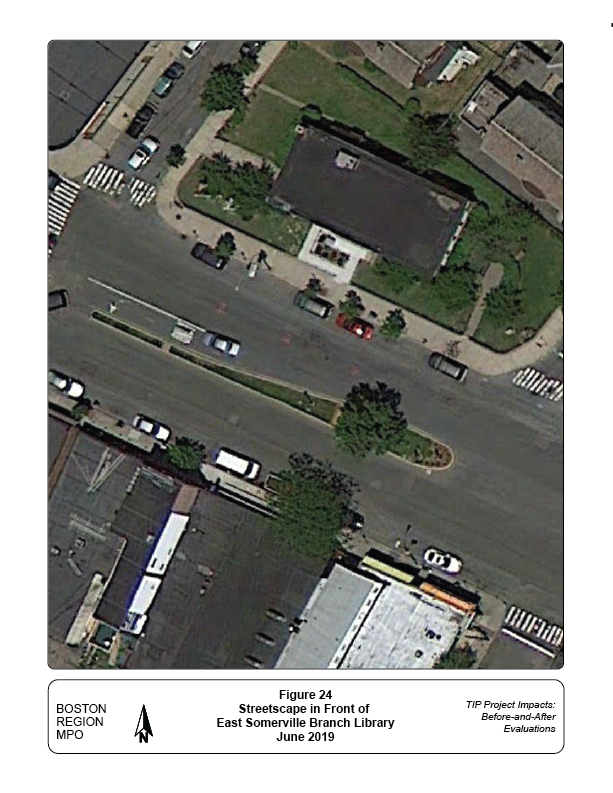
Figure 25
Loading Zone, August 2020
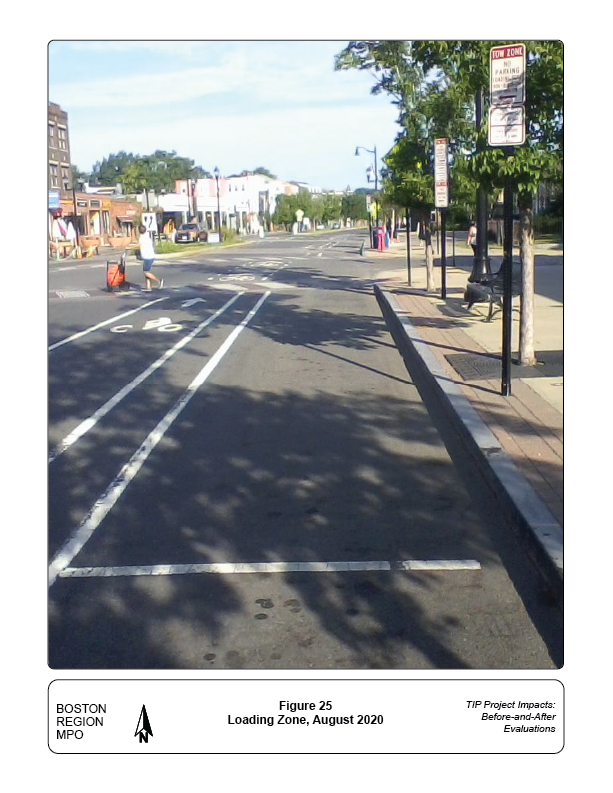
Figure 26
Loading Zone Sign, August 2020

The improvements observed in the project area follow closely the recommendations presented in the FDR. This section estimates how successful the project has been at meeting its transportation goals. More broadly, this section also considers qualitatively how the project has influenced its immediate vicinity. There were three aspects of the evaluation:
Crash statistics for the project area and the important nearby intersection of Broadway and McGrath Highway are shown in Table 14. The reconstruction of Broadway reduced vehicle capacity somewhat, and a potential result might have been an increase in turning movements at the Broadway and McGrath intersection. For this reason, crash statistics of the two roadway sections are considered together.
The project received its notice to proceed in June 2012 and work was completed in autumn 2015. The crash statistics in the “before” column of Table 14 are for the three years preceding construction, 2009–11, and the statistics in the “after” column are for the three years following completion, 2016–18. The 2018 crash reports were preliminary at the time of the analysis but agreed with data from the local police.
The project area saw a significant reduction in total crashes over this period, from 55 to 31. The reduction in crashes with injuries was especially significant, from 16 to seven. There were no fatalities in either period.
Crashes at the intersection of Broadway and McGrath Highway changed little, from 27 crashes before to 26 afterwards. Traffic analyses by local developers shortly before and after the project showed that about 100 more eastbound vehicles on Broadway made a left turn during both the AM and PM peak hours, but the overall total of turning movements at the intersection did not change meaningfully.
The FDR reported that there were 50 crashes in the project area during the three years between July 2004 and June 2007. The project appears to have significantly improved safety in the project area without causing any adverse safety impacts in nearby areas.
| Project Area | Broadway and McGrath | |||||
| Crash Variable | Before | After | Before | After | ||
| Crash Severity | ||||||
| Fatal injury | ||||||
| Nonfatal injury | 16 | 7 | 12 | 8 | ||
| Property damage only (none injured) | 31 | 22 | 13 | 18 | ||
| Not reported | 8 | 2 | 2 | |||
| Manner of Collision | ||||||
| Rear-end | 12 | 9 | 12 | 12 | ||
| Angle | 21 | 6 | 7 | 6 | ||
| Head-on | 2 | 2 | 1 | |||
| Sideswipe: same direction | 5 | 9 | 1 | 1 | ||
| Sideswipe: opposite direction | 2 | 1 | ||||
| Single-vehicle crash | 5 | 5 | 5 | 5 | ||
| Not reported | 8 | 2 | ||||
| Road Surface Conditions | ||||||
| Dry | 42 | 25 | 20 | 21 | ||
| Wet | 7 | 5 | 4 | |||
| Snow/ice | 3 | 1 | ||||
| Not reported | 3 | 7 | 1 | |||
| Ambient Light Conditions | ||||||
| Daylight | 35 | 19 | 24 | 12 | ||
| Dark: lighted roadway | 13 | 8 | 3 | 13 | ||
| Dusk | 4 | 3 | 1 | |||
| Dawn | 1 | |||||
| Dark: roadwy not lighted | ||||||
| Not reported | 3 | |||||
| Crashes by Roadway Users | ||||||
| Vehicle-only | 50 | 27 | 24 | 23 | ||
| Vehicle-pedestrian | 2 | 1 | 2 | 3 | ||
| Vehicle-bicycle | 3 | 3 | 1 | |||
| Bicycle-pedestrian | ||||||
| Crash Location | ||||||
| Intersection | 30 | 17 | 27 | 26 | ||
| Segment | 25 | 14 | ||||
| Total Crashes | 55 | 31 | 27 | 26 | ||
| Notes: Before period: CY 2009-2011 (June 2012 notice to proceed), | ||||||
| After period: CY 2016-2018 (constructuion completed autumn 2015) | ||||||
| Source: Central Transportation Planning Staff | ||||||
Since this section of Broadway was no longer important as a through route, the new corridor design reduced capacity accordingly. Reducing the capacity of a roadway can be expected to have two distinct traffic impacts:
An analysis of project impacts measured these impacts and assessed whether these normally negative impacts are significant. This study also measured a third traffic impact: the general reduction of traffic resulting from public health-related closures of business and civic venues. The public health-related traffic impacts were unrelated to the project evaluated but complicated the process of identifying and assessing the impacts that the project itself had on local and regional traffic flow.
First, current project-area traffic counts were analyzed and compared with counts performed in 2007. The public health-related traffic impacts were very clear. Some of the project-related changes to traffic patterns were also identified, but their significance cannot be reliably estimated because of the overall reduction in traffic.
The section concludes with capacity analyses of the intersections present on the Broadway corridor. New analyses were built on the analysis of 2007 volumes in the original FDR, but were based on the estimated 2028 volumes assumed in the FDR and the actual 2023 volumes. The McGrath Highway and Broadway intersection was not modified as part of the project and continues to function as an important nexus of the regional roadway system.
Traffic volumes for this corridor were collected on Thursday, March 23, 2023, a typical workday while school was in session. The data were collected from 6:00 AM to 6:00 PM, with the AM peak hour being 7:30 AM to 8:30 AM and the PM peak hour being 5:00 PM to 6:00 PM. See Appendix D for traffic count summaries Tables 15 and 16 display the traffic volumes for the AM and PM peak periods for the following scenarios:
Tables 15 and 16 summarize traffic volumes at each of the Broadway intersections in the project corridor observed in 2007 (before), estimated in the original FDR for 2028 (projected) and observed 2023 (after). As such, the dramatic decrease in traffic volumes in 2020 from those observed in 2007 can be attributed entirely to the relatively slow recovery of business and civic activity from the COVID-19 pandemic. In contrast, in 2008 the prediction in the FDR suggested that there would be significant traffic growth by 2018. Unfortunately, no traffic counts were performed during that period and the volume of pre-pandemic traffic is not known.
The traffic volumes in Tables 15 and 16 are summarized by approach direction. These data, further subdivided by turning movements, were the inputs for an intersection capacity analysis, and the more detailed data are included in the Appendix D.
Every intersection experienced a significant decrease in traffic volumes from 2007 to 2023 for both the AM and PM peak periods, as each intersection experienced a decrease in traffic of at least 18 percent per peak period. Broadway and Franklin Street experienced the most significant decrease, 44 percent and 38 percent respectively.
To better understand the impact of the reconstruction of Broadway east of this intersection it is more useful to look at the total amount of traffic using the four intersecting roadway legs, as shown in Tables 15 and 16 Total traffic in 2023 was 18 percent less than 2007 traffic during the AM peak hour and 24 percent less than during the PM peak at McGrath Highway and Broadway.
There was a decrease of 1,550 vehicles of through traffic on Broadway in the AM peak period between 2007 and 2023, which represents a 40 percent decrease. The AM decrease in side street traffic from 1,360 to 1,200 was a 12 percent decrease. The PM decrease in through traffic was 1,835 vehicles, or 41 percent of the 2007 total. The PM decrease in side street traffic from 1,741 to 1,464 represented a 16 percent decrease on Broadway during the PM peak. This implies that the reduction on Broadway was more pronounced for through traffic.
Table 15
Broadway Corridor Intersection Approach
AM Peak Hour Traffic Volumes
| Broadway (EB/WB) and Garfield Street (NB/SB) | |||||
| Scenario | EB | WB | NB | SB | Total |
| Before (2007) | 685 | 515 | 0 | 155 | 1355 |
| Projected (2028) | 893 | 604 | 0 | 163 | 1660 |
| After (2023) | 376 | 424 | 10 | 153 | 963 |
| Before/After Difference | -309 | -91 | 10 | -2 | -392 |
| Change (percentage) | -45% | -18% | N/A | -1% | -29% |
| Broadway (EB/WB) and Cross Street (NB/SB) | |||||
| Scenario | EB | WB | NB | SB | Total |
| Before (2007) | 790 | 475 | 185 | 20 | 1470 |
| Projected (2028) | 1003 | 562 | 194 | 21 | 1780 |
| After (2023) | 460 | 336 | 157 | 8 | 961 |
| Before/After Difference | -330 | -139 | -28 | -12 | -509 |
| Change (percentage) | -42% | -29% | -15% | -60% | -35% |
| Broadway (EB/WB) and Franklin Street (NB/SB) | |||||
| Scenario | EB | WB | NB | SB | Total |
| Before (2007) | 545 | 360 | 210 | 0 | 1115 |
| Projected (2028) | 746 | 436 | 220 | 0 | 1402 |
| After (2023) | 216 | 238 | 173 | 0 | 627 |
| Before/After Difference | -329 | -122 | -37 | 0 | -488 |
| Change (percentage) | -60% | -34% | -18% | N/A | -44% |
| Broadway (EB/WB) and Lombardi Street (NB/SB) | |||||
| Scenario | EB | WB | NB | SB | Total |
| Before (2007) | 465 | 0 | 180 | 610 | 1255 |
| Projected (2028) | 641 | 0 | 237 | 746 | 1624 |
| After (2023) | 235 | 0 | 152 | 547 | 934 |
| Before/After Difference | -230 | 0 | -28 | -63 | -321 |
| Change (percentage) | -49% | N/A | -16% | -10% | -26% |
| Broadway (EB/WB) and McGrath Highway (NB/SB) | |||||
| Scenario | EB | WB | NB | SB | Total |
| Before (2007) | 1265 | 130 | 1225 | 2265 | 4885 |
| Projected (2028) | 1697 | 609 | 1649 | 2983 | 6938 |
| After (2023) | 967 | 379 | 851 | 1833 | 4030 |
| Before/After Difference | -298 | 249 | -374 | -432 | -855 |
| Change (percentage) | -24% | 192% | -31% | -19% | -18% |
EB = eastbound. N/A = not applicable. NB = northbound. SB = southbound. WB = westbound.
Table 16
Broadway Corridor Intersection Approach
PM Peak Hour Traffic Volumes
| Broadway (EB/WB) and Garfield Street (NB/SB) | |||||
| Scenario | EB | WB | NB | SB | Total |
| Before (2007) | 600 | 830 | 0 | 140 | 1570 |
| Projected (2028) | 772 | 1061 | 0 | 147 | 1980 |
| After (2023) | 302 | 568 | 6 | 143 | 1019 |
| Before/After Difference | -298 | -262 | 6 | 3 | -551 |
| Change (percentage) | -50% | -32% | N/A | 2% | -35% |
| Broadway (EB/WB) and Cross Street (NB/SB) | |||||
| Scenario | EB | WB | NB | SB | Total |
| Before (2007) | 680 | 745 | 235 | 11 | 1671 |
| Projected (2028) | 857 | 972 | 247 | 11 | 2087 |
| After (2023) | 372 | 456 | 203 | 15 | 1046 |
| Before/After Difference | -308 | -289 | -32 | 4 | -625 |
| Change (percentage) | -45% | -39% | -14% | 36% | -37% |
| Broadway (EB/WB) and Franklin Street (NB/SB) | |||||
| Scenario | EB | WB | NB | SB | Total |
| Before (2007) | 550 | 605 | 180 | 0 | 1335 |
| Projected (2028) | 709 | 814 | 190 | 0 | 1713 |
| After (2023) | 314 | 356 | 152 | 0 | 822 |
| Before/After Difference | -236 | -249 | -28 | 0 | -513 |
| Change (percentage) | -43% | -41% | -16% | N/A | -38% |
| Broadway (EB/WB) and Lombardi Street (NB/SB) | |||||
| Scenario | EB | WB | NB | SB | Total |
| Before (2007) | 490 | 0 | 370 | 805 | 1665 |
| Projected (2028) | 646 | 0 | 463 | 1129 | 2238 |
| After (2023) | 297 | 0 | 277 | 668 | 1242 |
| Before/After Difference | -193 | 0 | -93 | -137 | -423 |
| Change (percentage) | -39% | N/A | -25% | -17% | -25% |
| Broadway (EB/WB) and McGrath Highway (NB/SB) | |||||
| Scenario | EB | WB | NB | SB | Total |
| Before (2007) | 965 | 810 | 2355 | 1555 | 5685 |
| Projected (2028) | 1349 | 1040 | 3157 | 2558 | 8104 |
| After (2023) | 789 | 457 | 1654 | 1423 | 4323 |
| Before/After Difference | -176 | -353 | -701 | -132 | -1362 |
| Change (percentage) | -18% | -44% | -30% | -8% | -24% |
EB = eastbound. N/A = not applicable. NB = northbound. SB = southbound. WB = westbound.
Following construction, the LOS of Broadway and Franklin Street declined from a C to a D in both the AM and PM peak period, even though the LOS was projected to remain a C. The Broadway and Lombardi intersection improved from a C to a B in both the AM and PM peak period. Broadway and McGrath Highway improved from a F to a E in the AM peak period and from a F to a D in the PM peak period.
Other notable findings with respect to LOS at this intersection includes the following:
The relative decrease in traffic on Broadway in the project area reflects a goal of the project. The question remains as to whether diversion of traffic to other routes meaningfully impacted LOS at other locations. Left-turn activity at an intersection can disproportionately consume intersection capacity and lower LOS. A capacity analysis of the intersection might indicate whether this level of change meaningfully impacts the intersection’s performance.
For this analysis, the left-turn eastbound and left-turn northbound approaches were analyzed at this intersection. The proportion of left turns on Broadway eastbound increased from 40 percent to 41 percent in the AM peak period and from 48 percent to 49 percent in the PM peak period. The proportion of left turns on McGrath Highway northbound increased from 10 percent to 13 percent in the AM peak period and decreased from 11 percent to 10 percent in the PM peak period. This indicates that that there were not significant diversions away from Broadway between McGrath Highway and Lombardi Street.
Table 17
Broadway Corridor Intersection
AM Level of Service, Delay, and Queue Length
| N/A | Before1 | N/A | N/A | 2028 Projected2 | N/A | N/A | After3 | N/A | ||
| Intersection / Approach | Movement | LOS | Delay4 | 95% Q5 | LOS | Delay | 95% Q | LOS | Delay | 95% Q |
| Broadway and Garfield | N/A | N/A | N/A | N/A | N/A | N/A | N/A | N/A | N/A | N/A |
| Broadway EB | L | B | 15.9 | 19 | B | 16.1 | 21 | A | 9.8 | 29 |
| Broadway EB | T | C | 22 | 216* | C | 24.5 | 334 | B | 10 | 80 |
| Broadway WB | TR | B | 19 | 155 | A | 7.5 | 81 | B | 12.2 | 99 |
| Garfield SB | LR | C | 30.3 | 120 | C | 33.7 | 136 | F | 82.2 | 152 |
| Overall | — | C | 21.8 | B | 19.1 | C | 20.1 | |||
| Broadway and Cross | N/A | N/A | N/A | N/A | N/A | N/A | N/A | N/A | N/A | N/A |
| Broadway EB | L | B | 16 | 17 | A | 5.2 | 0 | B | 10.5 | 16 |
| Broadway EB | TR | C | 22.8 | 230* | A | 7.3 | 94* | B | 15 | 118 |
| Broadway WB | L | D | 41.3 | 111* | F | 101.5 | 163* | B | 14.8 | 46* |
| Broadway WB | TR | B | 17.8 | 101 | B | 17.9 | 141 | B | 16 | 116 |
| Cross St NB | LTR | D | 42 | 173* | D | 44.6 | 167 | D | 48.7 | 197* |
| Cross St SB | LTR | C | 25.8 | 20 | C | 29.6 | 22 | D | 36.8 | 20 |
| Overall | — | C | 25 | B | 19.2 | C | 20 | |||
| Broadway and Franklin | N/A | N/A | N/A | N/A | N/A | N/A | N/A | N/A | N/A | N/A |
| Broadway EB | T | C | 20.9 | 164* | B | 19.9 | 681* | B | 17.1 | 127 |
| Broadway WB | T | B | 19.5 | 189* | B | 12.6 | 282 | E | 61.1 | 267 |
| Franklin St NB | LR | D | 38.6 | 143 | D | 44 | 191 | E | 57.6 | 197 |
| Overall | — | C | 23.8 | C | 21.4 | D | 45 | |||
| Broadway and Lombardi | N/A | N/A | N/A | N/A | N/A | N/A | N/A | N/A | N/A | N/A |
| Broadway EB | LT | B | 16.7 | 141 | C | 33.4 | 594* | B | 10.4 | 36 |
| Mt. Vernon NB | LT | D | 44.9 | 364* | C | 31.3 | 224* | B | 14.7 | 85 |
| Lombardi SB | L | C | 29.8 | 170 | C | 31.8 | 324* | C | 21.4 | 200* |
| Lombardi SB | R | A | 1.4 | 0 | A | 2.4 | 27 | B | 12.7 | 0 |
| Overall | — | C | 20 | C | 24 | B | 12.6 | |||
| Broadway and McGrath Highway | N/A | N/A | N/A | N/A | N/A | N/A | N/A | N/A | N/A | N/A |
| Broadway EB | L | F | 100.9 | 419* | F | 1407.5 | 665* | E | 65.5 | 337 |
| Broadway EB | T | E | 59.7 | 308 | F | 549.8 | 439* | D | 53.6 | 203 |
| Broadway EB | R | D | 43 | 79 | F | 113.1 | 93 | F | 124.9 | 596* |
| Broadway WB | L | F | 93.1 | 158 | E | 72.4 | 162 | E | 71.1 | 136 |
| Broadway WB | T | D | 46.9 | 157 | D | 44.3 | 163 | E | 66.4 | 120 |
| Broadway WB | R | D | 46 | 0 | C | 32.8 | 0 | A | 0.1 | 0 |
| McGrath NB | L | F | 710.2 | 261* | D | 38.8 | 271* | E | 78.4 | 259* |
| McGrath NB | TR | D | 36.9 | 365 | F | 164.4 | 780* | C | 33.3 | 290 |
| McGrath SB | L | F | 599 | 273* | C | 20.9 | 282* | F | 84.5 | 172 |
| McGrath SB | TR | F | 208 | 1035* | F | 121.4 | 1420* | D | 54.6 | 851* |
| Overall | — | F | 143.5 | F | 117.4 | E | 57.2 | |||
| McGrath Highway projected is in 2018 not 2028 | ||||||||||
| Queues for McGrath Highway are from 2015 (2022 projected) | ||||||||||
1 2007 2 Projected in functional design report, 2028 3 2023 4 delay in seconds 5 95th percentile volume EB = eastbound. NB = northbound. LOS = level of service. SB = southbound. WB = westbound.
Broadway Corridor Intersection
PM Level of Service, Delay, and Queue Length
| N/A | Before1 | N/A | N/A | 2028 Projected2 | N/A | N/A | After3 | N/A | ||
| Intersection / Approach | Movement | LOS | Delay4 | 95% Q5 | LOS | Delay | 95% Q | LOS | Delay | 95% Q |
| Broadway and Garfield | N/A | N/A | N/A | N/A | N/A | N/A | N/A | N/A | N/A | N/A |
| Broadway EB | L | B | 19.7 | 27 | C | 28.5 | 33 | B | 10.1 | 30 |
| Broadway EB | T | C | 20.1 | 179 | C | 28.1 | 273 | A | 9.7 | 63 |
| Broadway WB | TR | C | 23.3 | 264 | B | 16.8 | 431* | B | 14.8 | 135 |
| Garfield SB | LR | C | 29.3 | 106 | C | 28.1 | 130 | E | 67.3 | 134 |
| Overall | — | C | 22.6 | C | 22 | B | 18.3 | |||
| Broadway and Cross | N/A | N/A | N/A | N/A | ||||||
| Broadway EB | L | B | 17.5 | 19 | A | 6.6 | 3 | B | 10.9 | 24 |
| Broadway EB | TR | C | 22.1 | 193 | A | 7.1 | 42 | B | 13.4 | 91 |
| Broadway WB | L | C | 26.8 | 69* | E | 66.6 | 124* | B | 14.2 | 34* |
| Broadway WB | TR | C | 21.3 | 183 | C | 27.8 | 293 | B | 17.9 | 185* |
| Cross St NB | LTR | E | 62.2 | 248 | D | 44.1 | 248* | E | 57.9 | 256* |
| Cross St SB | LTR | C | 25.8 | 16 | C | 25.5 | 18 | D | 37 | 29 |
| Overall | — | C | 27.8 | B | 22.4 | C | 22.5 | |||
| Broadway and Franklin | N/A | N/A | N/A | N/A | ||||||
| Broadway EB | T | C | 21.3 | 164 | C | 25.8 | 623* | C | 21.2 | 195 |
| Broadway WB | T | C | 22.8 | 189 | D | 37.3 | 773* | E | 68.7 | 446* |
| Franklin St NB | LR | D | 35.1 | 143 | D | 41.4 | 165 | D | 52.7 | 171 |
| Overall | — | C | 23.8 | C | 33 | D | 47.6 | |||
| Broadway and Lombardi | N/A | N/A | N/A | N/A | ||||||
| Broadway EB | LT | B | 16.7 | 141 | C | 23.9 | 599* | B | 11 | 59 |
| Mt. Vernon NB | LT | D | 44.9 | 364 | D | 53.2 | 542* | B | 19.2 | 156 |
| Lombardi SB | L | C | 29.8 | 170 | D | 39.7 | 402* | D | 49.2 | 248* |
| Lombardi SB | R | A | 1.4 | 0 | D | 40.1 | 31 | C | 22.5 | 310 |
| Overall | — | C | 20 | C | 29.2 | B | 19.1 | |||
| Broadway and McGrath Highway | N/A | N/A | N/A | N/A | ||||||
| Broadway EB | L | F | 82.1 | 412* | F | 1119.1 | 606* | E | 75.8 | 327 |
| Broadway EB | T | D | 49 | 253 | F | 274.1 | 344* | E | 57.6 | 195 |
| Broadway EB | R | D | 40.3 | 34 | D | 38.5 | 38 | E | 68.3 | 255 |
| Broadway WB | L | F | 137.7 | 205 | E | 64.3 | 210 | E | 72.4 | 170 |
| Broadway WB | T | D | 47.9 | 246 | D | 40.2 | 259 | E | 67.9 | 159 |
| Broadway WB | R | E | 60 | 0 | C | 32.9 | 0 | A | 0.1 | 0 |
| McGrath NB | L | F | 1755.6 | 535* | D | 49.5 | *555 | E | 66 | 423* |
| McGrath NB | TR | F | 196.8 | 1008* | F | 805.1 | *1432 | D | 42.2 | 741* |
| McGrath SB | L | F | 876.8 | 342* | F | 140.6 | *353 | F | 87.4 | 220* |
| McGrath SB | TR | D | 45.4 | 531* | D | 54.9 | *1228 | D | 52.9 | 523 |
| Overall | — | F | 244.6 | F | 403 | D | 51.4 | |||
| McGrath Highway projected is in 2018 not 2028 | ||||||||||
| Queues for McGrath Highway are from 2015 (2022 projected) | ||||||||||
1 2007 2 Projected in functional design report, 2028 3 2023 4 delay in seconds 5 95th percentile volume EB = eastbound. NB = northbound. LOS = level of service. SB = southbound. WB = westbound.
Table 19 shows the change in performance metrics for both the AM and PM periods between 2012 and 2019. Additionally, Figures 20 and 21 show the change in travel time index in both AM and PM peak periods, respectively. Maps displaying the change in LOTTR, speed, speed index and congested time are in Appendix A.
Table 19
Broadway Corridor
Change in AM and PM INRIX Performance Metrics – 2012 to 2019
Roadway |
Corridor |
Direction |
LOTTR |
Speed |
Travel Time Index |
Speed Index |
Congestion Time |
McGrath Highway |
Somerville Avenue to I-93 |
Northbound |
0.12 (0.14) |
-5.9 (-8.5) |
0.07 (0.51) |
-0.17 (-0.24) |
10.6 (45.1) |
McGrath Highway |
I-93 to Somerville Avenue |
Southbound |
-0.04 (0.15) |
-7.6 (-4.9) |
0.71 (0.01) |
-0.22 (-0.14) |
21.1 (15.5) |
Broadway East |
McGrath Highway to Lombardi Street |
Eastbound |
0.11 (0.12) |
-3.2 (-5.0) |
-0.71 (-0.48) |
-0.11 (-0.17) |
4.4 (17.2) |
Broadway East |
Lombardi Street to McGrath Highway |
Westbound |
0.28 (0.17) |
-3.4 (-5.0) |
-0.24 (0.08) |
-0.11 (-0.17) |
32.1 (45.7) |
Broadway West |
Medford Street to McGrath Highway |
Eastbound |
0.3 0(0.20) |
-8.1 (-8.9) |
0.22 (0.32) |
-0.27 (-0.30) |
51.5 (56.2) |
Broadway West |
McGrath Highway to Medford Street |
Westbound |
0.18 (0.18) |
-4.9 (-4.4) |
0.48 (0.43) |
-0.16 (-0.15) |
46.7 (43.5) |
Note: Parentheses () denote PM.
LOTTR = Level of Travel Time Reliability.
Source: INRIX.
The findings are as follows:
Travel time index: TTI increased in all analyzed roadways except Broadway east of McGrath Highway in both directions. TTI increased significantly in the AM peak period at McGrath Highway southbound, which had the highest increase, and Broadway west of McGrath Highway in both directions. In the PM peak period, TTI increased on McGrath Highway northbound and Broadway west of McGrath Highway in both directions. Broadway east of McGrath Highway eastbound saw a decrease in TTI. Decreasing values indicate that there may be less congestion eastbound in the morning and evening on Broadway.
Speed index: The speed index decreased for all analyzed roadways during both the AM and PM peak period. The speed index decreased significantly on McGrath Highway southbound in the AM peak period, McGrath northbound in the PM peak period, and Broadway west of McGrath Highway eastbound in both peak periods, with the PM peak periods experiencing the most significant decrease.
Congested time: Congested time increased on every analyzed roadway in the project area. There was a significant increase for every roadway except Broadway east of McGrath Highway eastbound during the AM peak period.
Level of travel time reliability: LOTTR increased for every analyzed roadway except for McGrath Highway southbound. The most significant increase occurred on Broadway west of McGrath Highway eastbound in the AM peak period.
Summary: The performance measures indicate that, for the most part, congestion increased on Broadway after the project was completed. There might be less congestion for drivers travelling eastbound during both the morning and evening peak periods, but the only measure that supports this assumption is the time travel index. However, the goal of the Broadway redesign was not to ease congestion, but rather to create safer conditions for roadway users. Crossings were realigned and made more visible, bike lanes were installed, and traffic-calming measures were put in place to reduce speeds.
Figure 27
Change in AM Travel Time Index
Broadway and McGrath Highway
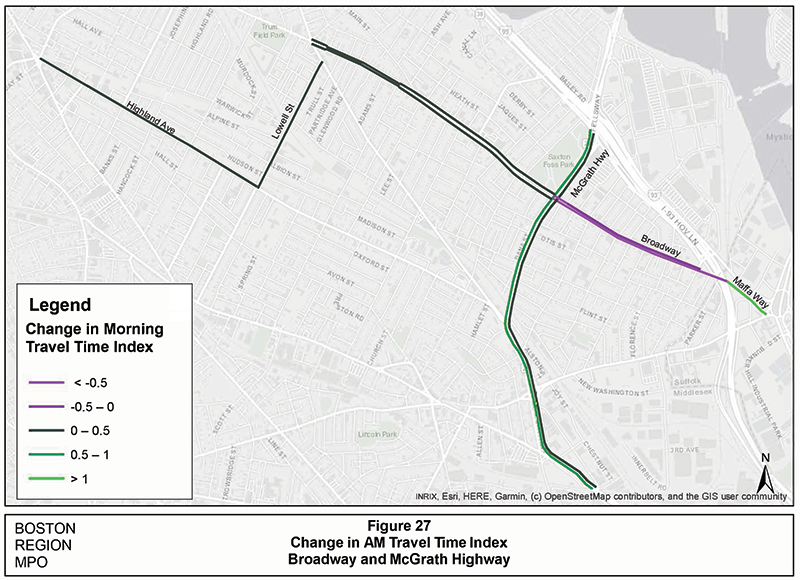
Figure 28
Change in PM Travel Time Index
Broadway and McGrath Highway
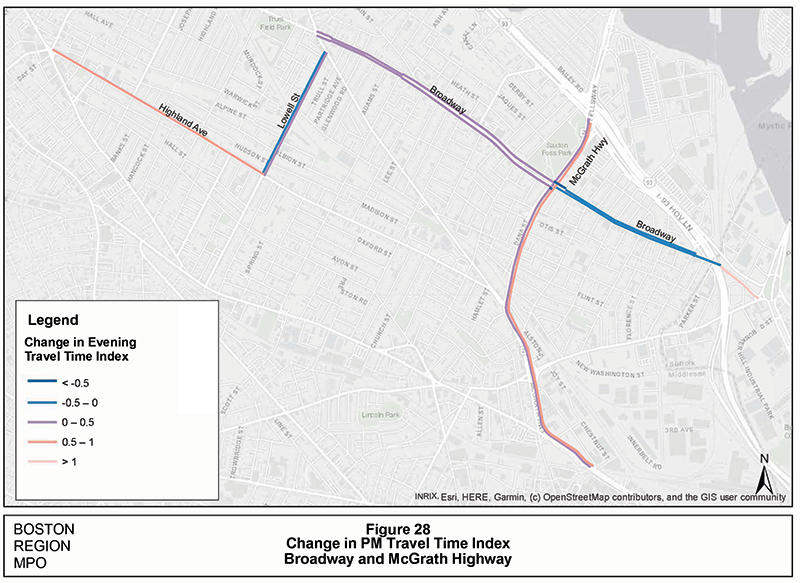
The FDR framed this project primarily as addressing a roadway design problem. The traffic requirements within the project corridor had fundamentally changed for the foreseeable future, and this presented an opportunity to improve and add facilities for nonmotorized users, improve safety for people in motor vehicles, people riding bicycles, and pedestrians, and accomplish these multimodal improvements without reducing travel LOS for motor vehicles.
However, from the perspective of the City of Somerville and the local community, the goal of the project was to change the nature of this part of Broadway. The FDR outlined a “recommended plan that promotes a vibrant, and more attractive urban environment.” One characteristic of the plan was that it “considers other amenities for desired activities such as planters, shrubs, benches, barrels, and so on.”
Other than these references, the FDR presented a traffic management and roadway design problem. Ultimately, the project reduced vehicle lanes, added bicycle lanes, widened sidewalks, reduced crashes, organized loading zones, and provided streetscape amenities similar to those suggested in the FDR.
The question remains, did the project change the urban nature of this part of Broadway aside from the physical improvements? This question is related to the concept of placemaking. One indication that the project may have an impact is the circle prominently visible in Figure 24 that was created as part of this project using paving materials. It highlights the streetscape in front of the branch library as a central location for neighborhood life.
Assessing changes and trends in urban activity is difficult even in ideal circumstances and was nearly impossible under the public health restrictions in place in 2020–21 at the time of this study. However, a neighborhood nexus such as the project area can evolve over time. The transformation of Centre Street in Jamaica Plain is often cited as an example of streetscape improvements facilitating a renaissance of urban life. The transformation in Jamaica Plain happened gradually over a period if many years and the relative influences of the new streetscape and other factors is impossible to determine. Likewise, the urban form of this part of Broadway will gradually develop as the years pass.
Chapter 5— Community Path Extension, Somerville
The Community Path Extension is a quarter-mile extension of the Somerville Community Path. The Somerville Community Path is a shared-use path that extends from the Alewife Red Line station to the newly rebuilt Lechmere Green Line station. Shared-use paths, often referred to simply as bike paths, are designed to accommodate nonmotorized travelers, notably pedestrians and bicyclists, as well as wheelchair users.
This Community Path is an element of a path subsystem that evolved with the restructuring and modernization of the regional rail system. West of the path extension project the path extended to the Alewife Red Line station where it connected with the Minuteman Commuter Bikeway, also a shared-use path. The section of the path between Davis Square and Alewife Station was built in conjunction with the Red Line extension project in the 1980s.
The Minuteman path was built in the ROW of an underutilized commuter rail branch. The Red Line extension between Davis Square and Alewife, the Community Path east of Davis Square, and a recently completed path west of Alewife were built on the ROW of an abandoned freight rail branch. The new path west of Alewife is envisioned as part of an eventual 104-mile Central Massachusetts Rail Trail to be constructed in an abandoned rail ROW.
This extension project received its notice to proceed in July 2014 and construction was completed in spring of 2016. The initial cost estimate in the MassDOT project information database was $3,891,350 and the bid price was $4,579,476.
Figure 30 is an aerial photo showing the project area between Cedar and Lowell Streets and the pavement markings indicating the path. Figure 31 shows the abandoned rail bed near Cedar Street. Figure 32 is a recent photo of the completed path showing the intersection with Cedar Street.
Figure 32 shows a standard octagonal stop sign facing eastbound path users, and less clearly visible is the back of a stop sign on the opposite side of the street for westbound path users. Vehicles on Cedar Street approaching this point are alerted by yellow diamond “Trail Xing” signs, two signs for each approach direction. Also visible in Figure 32 is a “state law yield to pedestrians within crosswalk” warning stanchion affixed to the pavement at the center line.
East of Cedar Street the ROW has been configured for nonmotorized travel and offers seating and rest locations, and small play locations. An example of the latter is a small, paved slope visible near the stop sign east of Cedar Street. The gentle slope rises about two feet and is appropriate to challenge young skateboarders and bicycle riders.
The extended path provided a connection with Lowell Street, a quarter mile east of Cedar Street. As shown in Figure 33, Lowell Street crossed the rail bed on a truss structure that had wooden slats for a roadway surface. In 2006, this bridge was replaced with the modern concrete structure shown in Figure 34.
Path users can connect with either of Lowell Street’s two sidewalks. West of Lowell Street and north of the Community Path is Maxwell’s Green housing complex. This complex, which appears on the left side of Figure 34, has several direct connections with the Community Path and path users are directed by signage to use Maxwell’s Green Road and sidewalk circulation system to reach Lowell Street. The Community Path currently ends east of the Lowell Street underpass where an ADA-compliant ramp and steps bring path users to Lowell Street. These connection elements are visible in Figure 30.
Many bicycle riders were observed travelling between the Community Path and Lowell Street via the Maxwell’s Green circulation system. Consequently, the path and nearby amenities visible in Figure 34 are popular for supervised play by pre-school children.
Figure 29
Somerville Community Path Extension Project Area

Figure 30
Rail Right-of-Way East of Cedar Street, 2001
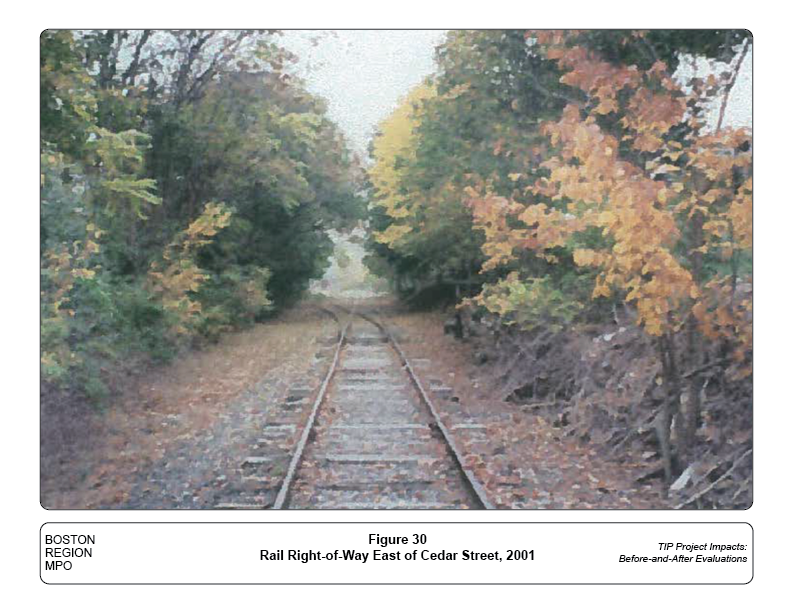
Source: Somerville Community Path Feasibility Study.
Figure 31
Community Path at Cedar Street, 2020
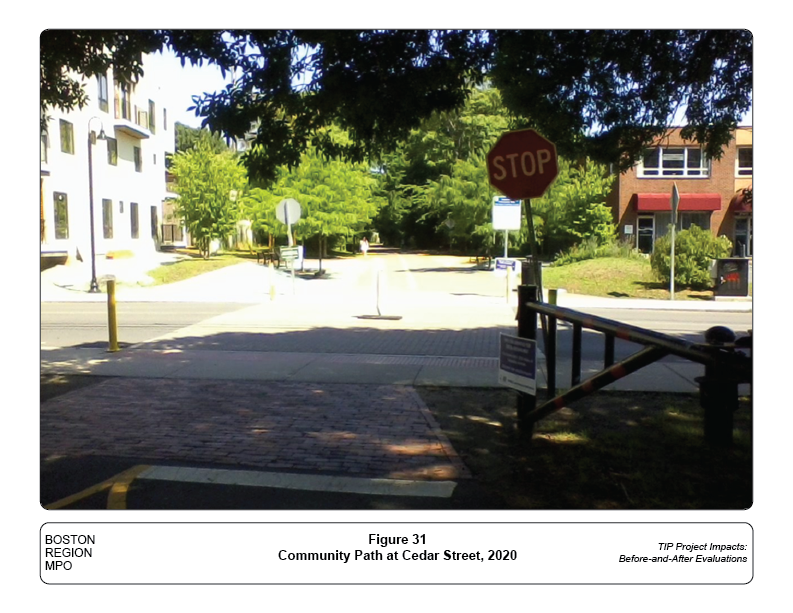
Source: Central Transportation Planning Staff.
Figure 32
Rail Right-of-Way at Lowell Street, 2001
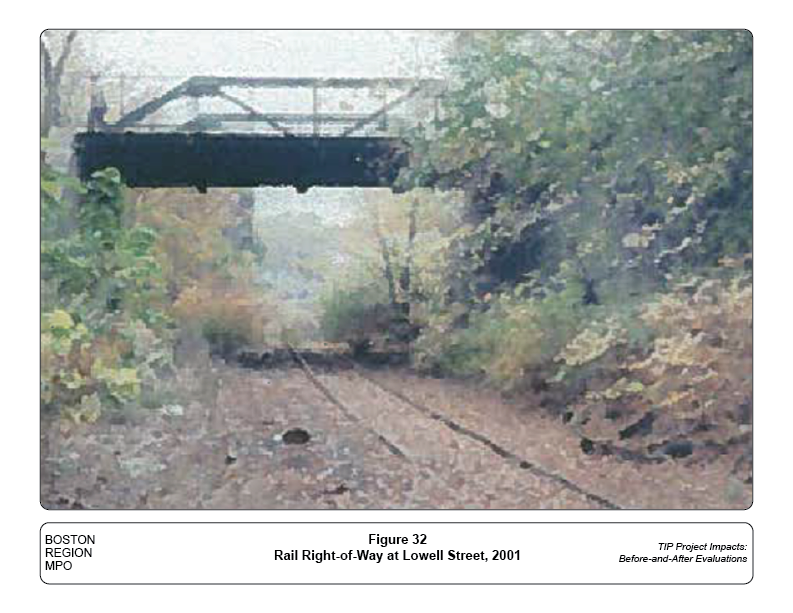
Source: Somerville Community Path Feasibility Study.
Figure 33
Community Path at Lowell Street, 2020
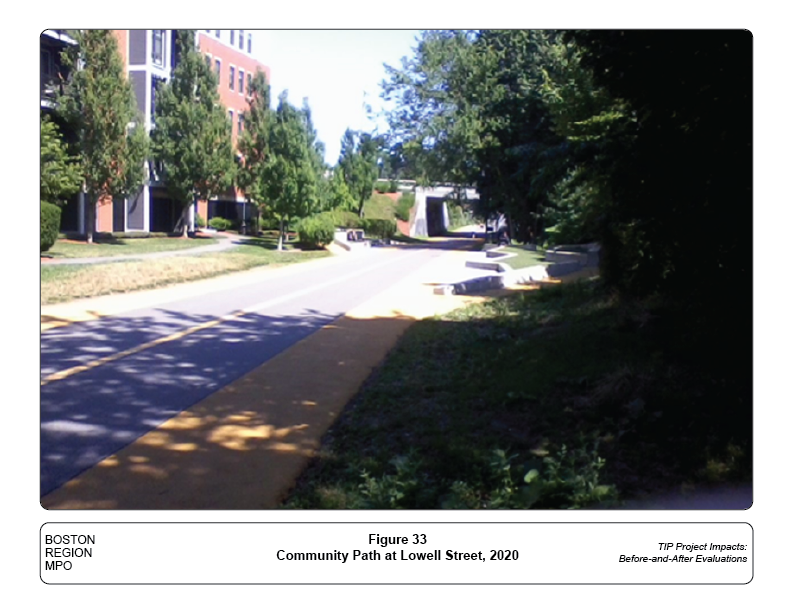
Source: Central Transportation Planning Staff.
The evaluation process for the Community Path Extension project is much simpler than that used for the projects that addressed roadway systems. The 2001 feasibility study that envisioned the Community Path was very preliminary and what was eventually built in this short segment is consistent with the facilities the feasibility study recommended.
In 2003, this segment, together with a further quarter-mile extension to Central Street, was evaluated as a candidate project for Congestion Mitigation and Air Quality (CMAQ) funding. The CMAQ analysis estimated potential use of the extended path and air quality improvements. The analysis in this report applies the approach used for the CMAQ submission to develop use estimates for the shorter segment that was eventually built. The resulting projections were then compared with recently performed counts of path users.
The analysis also considered how construction of this one segment of the Community Path relates to and influences its immediate area. Possible influences of the path extension outside its immediate environs were also considered.
The CMAQ analysis assumed that people living within one mile of a new path facility were potential users. Multiplying the length of the proposed extension by two miles gave the total land area of the two one-mile buffers adjacent to the alignment.
This new bicycle-pedestrian market area was assumed to have the same population density, average household size and workers per household, and journey-to-work mode share as the entire city of Somerville. US Census data at the time suggested that 12 percent of workers in this area commuted to work by either bicycle or walking. The CMAQ analysis assumed that these commuters would make an average of 2.7 nonmotorized trips a day.
The average of 2.7 trips is consistent with other studies that used different data sources.6 Workers do not go to their primary workplace every day, and the 2.7 trips might be thought of as 0.85 trips to work, 0.85 trips home, and 1.0 additional daily trips to other locations on average. Stopping at an intermediate destination on the way to or from work counted as a separate trip. The 2.7 trip figure was the estimate of nonmotorized trips. On average there would be additional trips by transit or private vehicle.
The total number of trips that was estimated in 2003 for the proposed 0.53-mile extension to Central Street was 3,720. Applying the same demographic and use factors to the shorter 0.25-mile extension to Lowell Street provided an estimate of 1,755 daily users of the extended path.
During spring of 2023, MassDOT staff conducted counts in the project area throughout the day. The counts were collected between 6:00 AM and 6:00 PM on March 23, 2023. Pedestrians, bicyclists, and motor vehicles were counted and their turns, if any, recorded at the at-grade intersection of Cedar Street and the Community Path. Selected 12-hour summary statistics from these counts are shown in Table 20.
Table 20
12-Hour Use Summary
March 23, 2023
6:00 AM to 6:00 PM
Corridor |
Pedestrians |
Bicycles |
Motor Vehicles |
|||
Path extension (two-way) |
1,145 |
156 |
NA |
|||
Path west of Cedar Street (two-way) |
1,028 |
208 |
NA |
|||
Cedar Street (approaching path) |
987 |
106 |
3,947 |
|||
Path users going straight (two-way) |
1,219 |
163 |
NA |
|||
Cedar Street users going straight (two-way) |
100 |
60 |
3,947 |
|||
NA = Not applicable.
Source: Central Transportation Planning Staff.
The project’s 2003 projected use was 1,755 daily users. Our counts from 2023, 20 years later, show 1,301 users in a 12 hour period. There are aspects of how the estimates were generated and the composition of the recently observed user community that merit some discussion. However, one can conclude that the amount of use meets the project’s initial expectations.
The CMAQ analysis developed an estimate of the number of people already walking or bicycling to work who would now be within a mile of the new facility. Of course, many of these commuters would be going to workplaces in a direction away from the new path. However, many users of the preexisting path would choose to incorporate the new path extension into their route. The simple CMAQ calculation implicitly assumes a balance between these two aspects of the potential travel demand.
The CMAQ estimates were for focused on utilitarian trips. These are trips that the traveler makes to get from the location of one activity to another, such as homes, workplaces, or stores. Walking, running, or bicycle riding just to get exercise or walk one’s dog are travel activities the CMAQ formulas were not explicitly estimating. It was apparent during the recent counts that many people were using the path for purely recreational purposes.
Table 20 also includes counts of the preexisting Community Path section, counts on Cedar Street, and counts of users traveling straight on both the path and Cedar Street. Of the pedestrians and bicyclists approaching the path on Cedar Street, about 85 percent would be turning onto the path and the other 15 percent continuing straight on Cedar Street. The bicyclists and pedestrians staying on Cedar Street would probably be traveling to a specific destination rather than using the path for recreation. Those turning to or from the path may use it as a route to their destination or for getting exercise.
A review of MassDOT crash reports showed that there were eight crashes between 2009 and 2018 in the one block of Cedar Street between Morrison Avenue north of the Community Path and Alpine Street south of the path. Four of these crashes involved injuries: a motorcyclist in 2009, a bicyclist in 2011, a pedestrian in 2014, and a vehicle occupant in 2016.
The other four crash reports indicated that there were no injuries. There were two crashes involving vehicles in 2014. In 2017 a vehicle hit a stationary object, and in 2018 a bicycle and a vehicle collided with no injury. One two-vehicle crash was a rear-end collision and its location was reported as being at the bicycle path.
The vehicle traffic on Cedar Street does not have pronounced AM and PM peaks. Much of the midday traffic was light commercial vehicles driven by people in the building trades.
The Somerville Community Path has always been envisioned as a travel corridor, allowing bicycles to cover long distances for commuting and other purposes. Constructed to modern shared-use path standards, there would also be ample capacity for pedestrians traveling shorter distances. With rest and recreation amenities incorporated into the path design and convenient connections to adjacent parks, the path system would also serve as a place of rest and relaxation for users not specifically traveling.
Users of the Community Path traveling to or from major activity centers in Somerville or Cambridge probably enter or leave the path at some point west of the project segment. The roadway system at both Cedar and Lowell Streets does not present path users with convenient routes to continue travel towards the east. Many residential streets are short, often one-way segments. The railroad surveyors in the 1800s identified the most level routes through hilly Somerville, leaving the later residential developers to run their city streets up and down the nearby hills.
The completion of the Community Path to Lechmere solved both the connectivity and grade problems. Path uses before the completion, at the time of the analysis, were predominately pedestrian and recreational. Now that the path is completed, these uses are expected to increase as more residents are brought into the travel market area. In addition to more recreational use, a major increase in longer-distance bicycle travel is expected as people travel to reach the dense activity centers of east Cambridge and Boston.
A positive aspect of the urban design is the close integration of the improved path segment with Maxwell’s Green development. Creating a strong connection between the two projects was made easier because the development was entirely new rather than an adaptive reuse of existing structures.
Chapter 6—Recommendations and Conclusions
Chapter 7—Conclusions and Next Steps
The review of these four projects has provided MPO staff with some insight into how well TIP funded projects meet their stated goals. In addition, these projects have shown that safety and mobility can be improved without necessarily expanding roadways. MPO staff recommend considering the following strategies for projects before turning to roadway expansion:
Implementation of these strategies are often lower cost and can improve roadway safety and reduce congestion without encouraging latent demand on roadways. The transportation improvements made to each of the project corridors included in this study were effective in managing traffic flow without necessitating roadway expansion. However, there may be instances where, after due diligence in implementing the strategies listed above, allowing for an increase in capacity, such as by adding turning lanes or travel lanes, may become necessary.
In addition to conducting before-and-after studies on a rolling basis, the MPO staff has identified other avenues to gauge the success of MPO-funded projects. These activities are detailed below.
The Federal Highway Administration (FHWA) recommended that a follow-up study be conducted for regionally significant projects, which are generally higher in cost. Additionally, the FHWA recommended analyzing non-roadway projects, such as major transit projects or active transportation projects, as well. Other auxiliary projects, such as regulated parking projects or intelligent transportation systems (ITS) projects, can also be analyzed.
Criteria will need to be developed for evaluating the expected benefits of future TIP projects by incorporating the findings of the before-and-after studies. Based on improvements in terms of congestion, mobility, and safety resulting from an implemented project, assumptions can be made about the impacts of implementing similar projects in the future. For example, it can be determined if implementing signal-timing changes will result in a qualitative improvement in congestion at an intersection.
While not all projects warrant a detailed study such as this one, MPO staff anticipate moving toward a process of tracking benefits and challenges resulting from all TIP-funded projects. This will allow the MPO board to understand the impact of their investment decisions and help stakeholders in the region understand how the outcomes of projects compare to their projected benefits determined through the TIP scoring criteria.
1 Travel time index directly compares peak-period travel time conditions with free-flow travel time conditions. Travel time index indicates how much contingency time should be considered to ensure an on-time arrival during the peak period versus optimum travel times.
2 Speed index is equal to the average speed divided by the posted speed limit of a Traffic Message Channel (TMC). Speed index indicates congestion more accurately than travel speeds alone because low travel speeds may be a result of low-speed limits on certain facilities.
3 Congested time (per peak-period hour) is the average number of minutes that drivers experience congested conditions during the peak period. Congestion is considered to persist on an arterial roadway when the average speed is less than 19 miles per hour. Congested time is measured in minutes per peak-period hour.
4 LOTTR is a performance measure that measures the day-to-day variation of travel times of a roadway segment. This performance measure is federally mandated.
5 Boston Region Metropolitan Planning Organization, “The Safe Routes to School Program: Progress and Opportunities” (February 2018). https://www.bostonmpo.org/srts-progress-and-opportunities.
6 Boston Region Metropolitan Organization, “Exploring the 2011 Massachusetts Travel Survey: Focus on Journeys to Work” (April 2014). https://www.bostonmpo.org/exploring_2011_survey.