This document is draft and has not gone through the internal editorial review process.
Vision Zero Action Plan
Table of Contents
What is the Vision Zero Action Plan?
Safe Streets and Roads for All (SS4A)
Relation to Other Safety Plans
Key Crash Trends and Emphasis Areas
High-Injury and High-Risk Networks
4. Public and Stakeholder Engagement
5. Strategies, Policies, Countermeasures, and Plan Implementation
Proven Safety Countermeasures and Best Practices
Policies that Require Legislative Changes
Vision Zero Action Plan Strategies
Other Strategies for the Boston Region
Boston Region MPO’s Role in Improving Transportation Safety
Appendix A: Terms and Acronyms
Appendix B: Existing Conditions
Appendix C: High-Injury Network and Demographic Analysis
Appendix E: Municipality Profiles
Appendix F: Public and Stakeholder Engagement Summary
Appendix G: Policy and Process Analysis
Appendix H: Plan Strategies and Countermeasures
Appendix I: Progress Reporting
Appendix J: Safe Streets and Roads for All Checklist
List of Tables
Table 2.1 | Relation to Other Strategic Safety Plans
Table 3.2 | Crash Scores by Severity
Table 3.3 | Network Screening Elements
Table 3.4 | High-Scoring Locations in the ICC Subregion
Table 3.5 | High-Scoring Locations in the MAGIC Subregion
Table 3.6 | High-Scoring Locations in the MetroWest Subregion
Table 3.7 | High-Scoring Locations in the NSPC Subregion
Table 3.8 | High-Scoring Locations in the NSTF Subregion
Table 3.9 | High-Scoring Locations in the SSC Subregion
Table 3.10 | High-Scoring Locations in the SWAP Subregion
Table 3.11 | High-Scoring Locations in the TRIC Subregion
Table 4.1 | Vision Zero Task Force Members
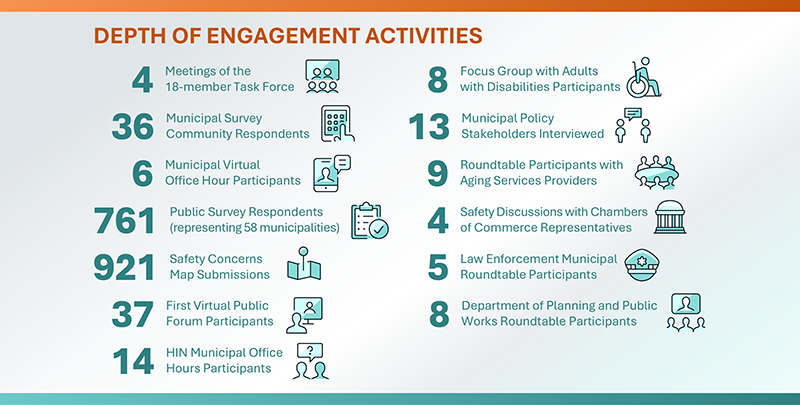
Table 4.2 | Vision Zero Action Plan Engagement Activities
Table 5.1 | Innovative Countermeasures and Strategies
Table 6.1 | Vision Zero Action Plan Performance Metrics (All Roads)
List of Figures
Figure 1.1 | Safe System Approach Principles and Elements
Figure 2.1 | Vision Zero Action Plan Development Process
Figure 3.1 | Total Fatal and Serious Injury Crashes by Mode, 2018–2022
Figure 3.2 | All Fatal and Serious Injury Crashes by Roadway Type, 2018–2022
Figure 3.3 | All Fatal and Serious Injury Crashes by Road Ownership, 2018–2022
Figure 3.4 | Fatal and Serious Injury Crashes by Collision Type, 2018–2022
Figure 3.5 | Regional High-Injury Network
Figure 3.6 | Regional High-Injury Network and Priority Transportation Investment Areas
Figure 3.7 | Prioritized Regional High-Injury Network
Figure 3.8 | Prioritized HIN in the ICC Subregion
Figure 3.9 | Prioritized HIN in the MAGIC Subregion
Figure 3.10 | Prioritized HIN in the MetroWest Subregion
Figure 3.11 | Prioritized HIN in the NSPC Subregion
Figure 3.12 | Prioritized HIN in the NSTF Subregion
Figure 3.13 | Prioritized HIN in the SSC Subregion
Figure 3.14 | Prioritized HIN in the SWAP Subregion
Figure 3.15 | Prioritized HIN in the TRIC Subregion
Figure 3.16 | High-Risk Network Example—Lane Departure Crashes
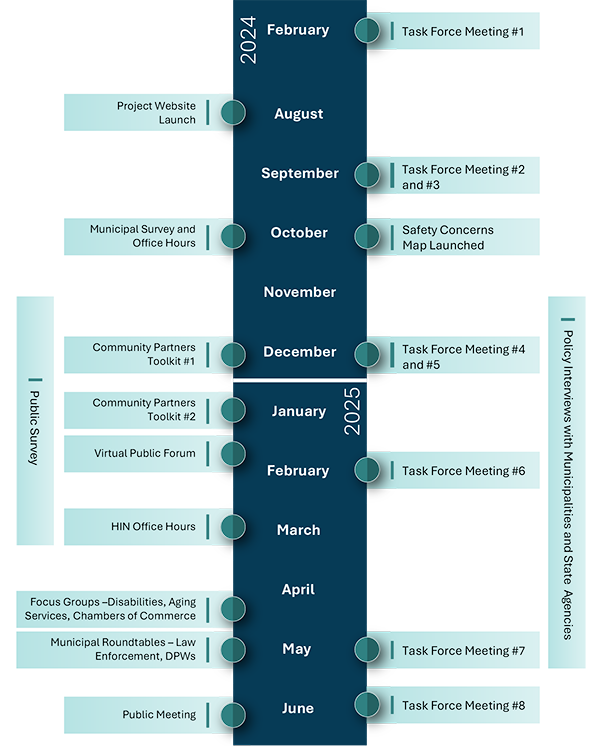
Figure 4.1 | Engagement Timeline
About the Plan
Boston Region Vision Zero Action Plan
JUNE 26, 2025
This plan was funded in part through grants from the U.S. Department of Transportation (U.S. DOT). Its contents do not necessarily reflect the official views or policies of the U.S. DOT.
About the Boston MPO
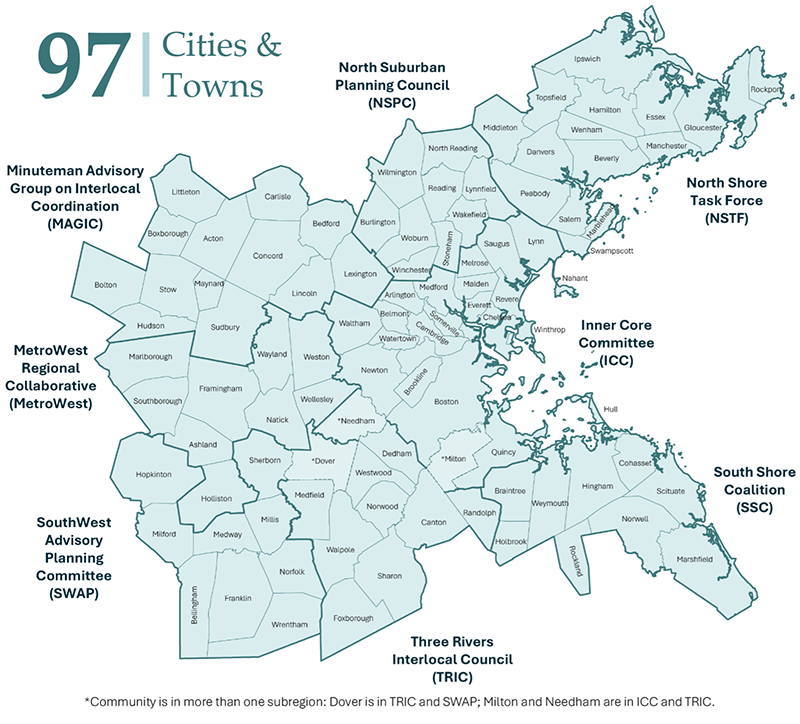
The Boston Region Metropolitan Planning Organization (MPO) is responsible for conducting the federally required metropolitan transportation planning process for the Boston metropolitan area. The MPO encompasses 97 cities and towns, covering approximately 1,360 square miles and stretching from Boston to Ipswich in the north, Marshfield in the south, and to approximately Interstate 495 in the west. Cooperatively selecting transportation programs and projects for funding is a role of the MPO’s 23 voting members, which includes state agencies, regional entities, and municipalities. The work of the MPO is performed by the Central Transportation Planning Staff under the direction of the MPO Board. The MPO is composed of:
Permanent Members
Elected Members
Nonvoting Members
Acknowledgements
[MPO TO DRAFT TEXT TO INSERT]
Notice of Nondiscrimination Rights and Protections
The Boston Region Metropolitan Planning Organization (MPO) operates its programs, services, and activities in compliance with federal nondiscrimination laws including Title VI of the Civil Rights Act of 1964 (Title VI), the Civil Rights Restoration Act of 1987, and related statutes and regulations. Title VI prohibits discrimination in federally assisted programs and requires that no person in the United States of America shall, on the grounds of race, color, or national origin (including limited English proficiency), be excluded from participation in, denied the benefits of, or be otherwise subjected to discrimination under any program or activity that receives federal assistance. Related federal nondiscrimination laws administered by the Federal Highway Administration, Federal Transit Administration, or both, prohibit discrimination on the basis of age, sex, and disability. The Boston Region MPO considers these protected populations in its Title VI Programs, consistent with federal interpretation and administration.
The Boston Region MPO also complies with the Massachusetts Public Accommodation Law, M.G.L. c 272 sections 92a, 98, 98a, which prohibits making any distinction, discrimination, or restriction in admission to, or treatment in a place of public accommodation based on race, color, religious creed, national origin, sex, sexual orientation, disability, or ancestry. Likewise, the Boston Region MPO complies with the Governor’s Executive Order 526, section 4, which requires that all programs, activities, and services provided, performed, licensed, chartered, funded, regulated, or contracted for by the state shall be conducted without unlawful discrimination based on race, color, age, gender, ethnicity, sexual orientation, gender identity or expression, religion, creed, ancestry, national origin, disability, veteran’s status (including Vietnam-era veterans), or background.
A complaint form and additional information can be obtained by contacting the MPO or at http://www.bostonmpo.org/mpo_non_discrimination. To request this information in a different language or in an accessible format, please contact:
TITLE VI SPECIALIST
Boston Region MPO 10 Park Plaza, Suite 2150 Boston, MA 02116
|
BY TELEPHONE: 857.702.3700 (voice)
For people with hearing or speaking difficulties, connect through the state MassRelay service:
Relay Using TTY or Hearing Carry-over: 800.439.2370 Relay Using Voice Carry-over: 866.887.6619 Relay Using Text to Speech: 866.645.9870
For more information, including numbers for Spanish speakers, visit https://www.mass.gov/massrelay
|
Message from the Executive Director
1 Introduction
In 2024, close to 40,000 people were killed in traffic crashes in the United States and hundreds of thousands more were seriously injured. This national roadway safety problem affects us in the Boston Region as well, where traffic crashes continue to kill or seriously injure over 1,000 people per year.
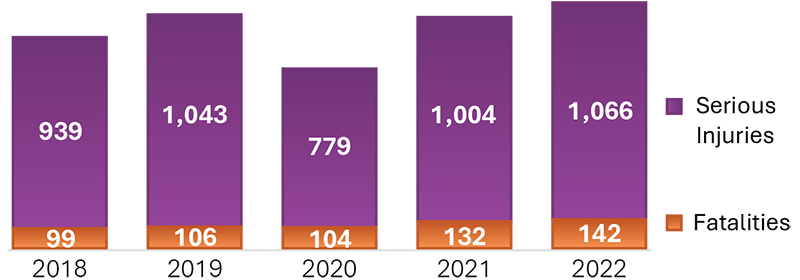
The Boston Region Metropolitan Planning Organization (MPO) believes that even one death on our roads is too many, that’s why we’re committed to Vision Zero. Vision Zero is an approach to roadway safety that’s based on the assumption that serious traffic crashes are preventable. Together, we can change how we design, operate, and maintain our streets in order to make the region safe for all road users—whether you walk, roll, bike, ride transit, or drive.
The MPO’s Long Range Transportation Plan (LRTP), Destination 2050, sets a goal to achieve zero transportation-related fatalities and serious injuries and improve safety for all users of the transportation system:
The Boston Region Vision Zero Action Plan reflects the MPO’s commitment to saving lives. This Action Plan builds on transportation planning and safety initiatives already undertaken in the region. This effort will help the MPO and its 97 municipalities navigate the future of roadway safety and communicate clearly with residents about how we can implement safety improvements necessary to achieve Vision Zero.
The traditional approach to roadway safety views traffic deaths and serious injuries as “inevitable side effects of modern life” (Vision Zero Network) and refers to these serious crashes as “accidents.” Vision Zero asks us to realize that we can, in fact, prevent serious crashes by proactively prioritizing traffic safety.
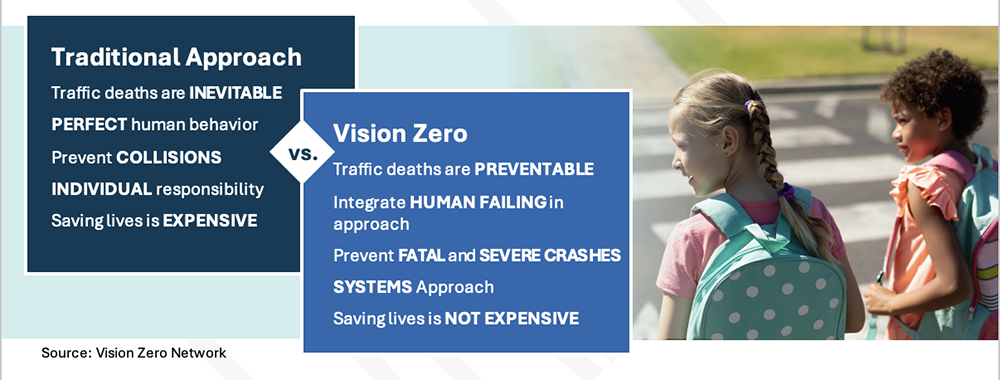
Vision Zero recognizes that people will not act perfectly on our streets, and calls on elected officials, policy makers, engineers, planners, first responders, public health professionals, and others to integrate human mistakes into our safety work.
Vision Zero calls on us to work together, across disciplines, to improve roadway safety. There are many complex factors that contribute to roadway safety and safe mobility, including street design, vehicle speeds, roadway user behaviors, and vehicle technology. However, we can design roads, update policies, and implement new programs to lessen the severity of crashes. Reaching zero fatalities and serious injuries requires us to set goals and work on actions to implement change in all of these areas.
Figure 1.1 | Safe System Approach Principles and Elements
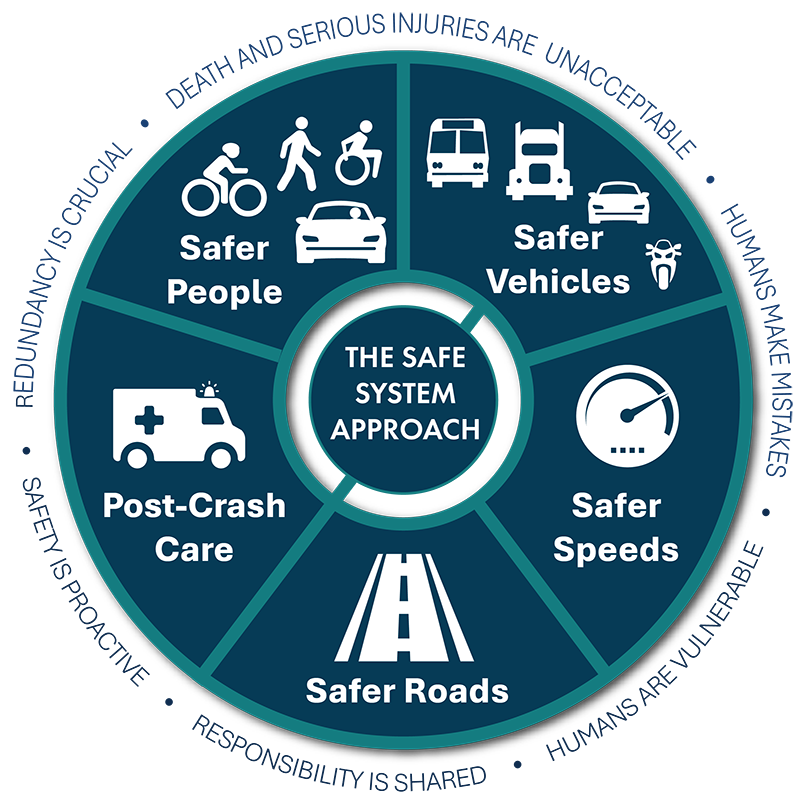
While Vision Zero establishes the goal of zero deaths and serious injuries on our streets, the Safe System Approach, illustrated in Figure 1.1, provides a more detailed framework for how we reach that goal. The Safe System Approach aims to address and mitigate the risks inherent in the transportation system by building and reinforcing multiple layers of protection to both prevent crashes from happening in the first place and minimize the harm caused to those involved when crashes do occur.
This holistic and comprehensive strategy focuses both on human mistakes and vulnerability and promotes a system designed with many redundancies in place to protect all road users. The Safe System Approach also embraces all types of roadway safety countermeasures and acknowledges that a multi-disciplinary approach is required to address the full range of possible safety risks. Figure 1.1 shows how the five Safe System elements—safe road users, safe vehicles, safe speeds, safe roads, and post-crash care—work together to create shared responsibility for the safety of all road users.
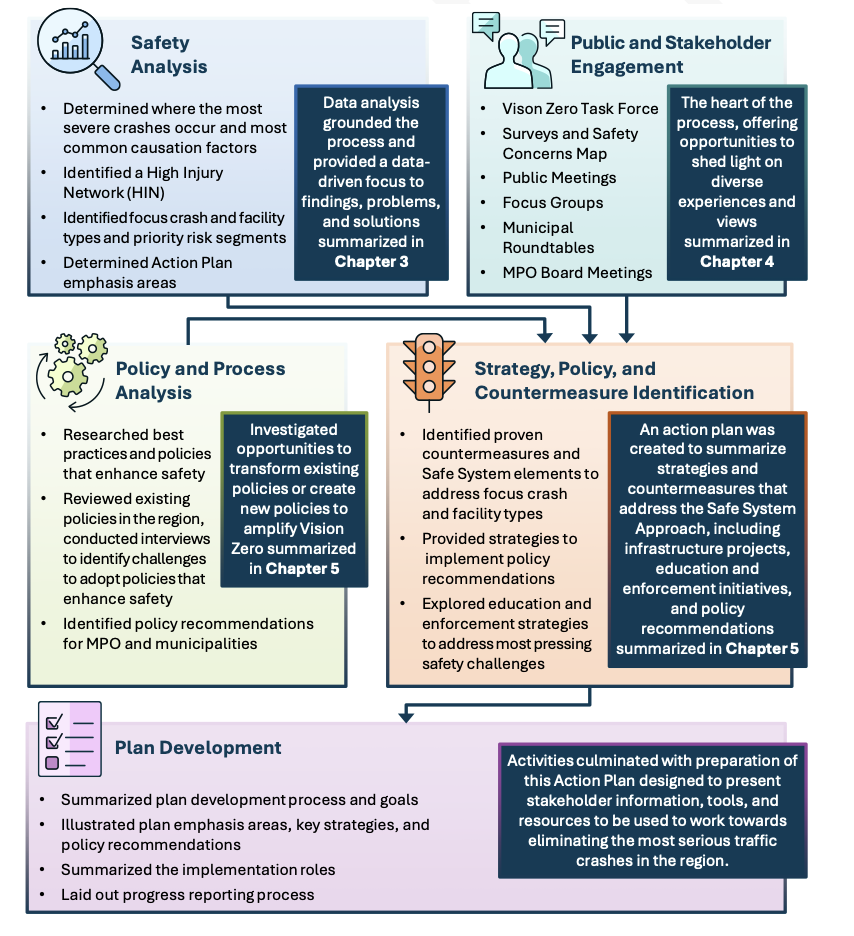
2 How the Plan was Developed
Table 2.1 | Relation to Other Strategic Safety Plans
Several other transportation and safety plans were referenced during the creation of this Vision Zero Action Plan, as noted in Table 2.1.
Table 2.1 | Relation to Other Strategic Safety Plans
Resource |
|
This Action Plan will address safety needs documented in the MPO’s LRTP. The LRTP also sets a goal of achieving zero crash fatalities in the region by 2050. |
|
This Action Plan is aligned with MAPC’s 2021 regional land use and policy plan, which sets the goals of having safe transportation and healthy and safe neighborhoods. |
|
This Action Plan suggests priority corridors that could develop into projects funded through the MPO’s capital plan. |
|
This Action Plan aligns with the needs and actions identified in Massachusetts’ 2050 Transportation Plan. |
|
This Action Plan’s safety analysis, emphasis areas, and proposed strategies and countermeasures are consistent with the goals of MassDOT’s SHSP. |
|
This Action Plan lists many infrastructure safety projects that may be eligible for support from MassDOT’s HSIP. |
|
Vision Zero Plans and Safety Studies by the region’s cities and towns |
Several MPO members have developed their own Vision Zero Plans, many of which were consulted. This Action Plan provides additional projects and countermeasures that these cities and towns can adopt:
Other municipalities are in the process of developing plans or demonstration projects, including Chelsea, Needham, Peabody, Qunicy, and Watertown. |
3 Safety Analysis
An in-depth safety analysis, provided as Appendix B, forms a critical foundation for this Vision Zero Action Plan. This analysis identified where and why crashes are occurring across the Boston region, helped the MPO to assess current safety performance, supported data-driven decision-making by stakeholders and the Vision Zero Task Force, and guided the development of targeted safety strategies.
To better understand current crash patterns and the contributing factors associated with the most common and overrepresented crash types, the most recent five-year crash data were analyzed to help identify key factors that may contribute to future crashes.0F1
Data Sources
1. Historical data (1980–2022) from the U.S. DOT Fatality Analysis Reporting System (FARS)
2. Most recent five years (2018–2022) of available data from the MassDOT Open Data Portal and the MassDOT IMPACT tool
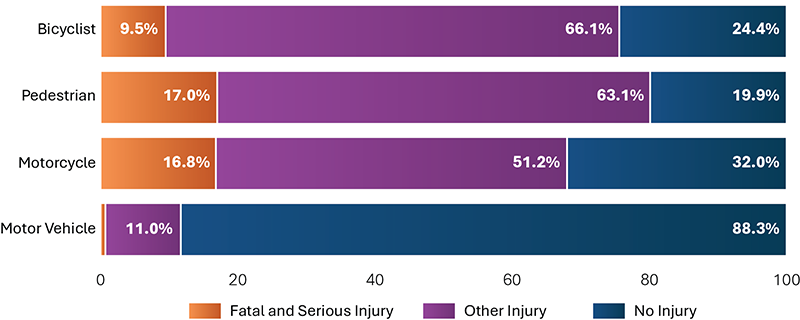
As described in Chapter 1, nearly 1,000 people are killed or seriously injured in crashes in the region every year. Figure 3.1 shows the breakdown of fatal and serious injury crashes by mode from 2018 through 2022. Bicyclists, pedestrians, and motorcyclists are at significant risk for serious injury or death when involved in crashes with motor vehicles.
Figure 3.1 | Total Fatal and Serious Injury Crashes by Mode, 2018–2022
Crashes create costs that are born not just by victims and survivors but by our entire community in the form of insurance premiums, taxes, congestion-related costs, and workplace losses. From 2018 through 2022 in the Boston Region alone, crashes incurred an estimated total cost of $26.5 billion, averaging around $5.3 billion per year. Of that total, $12.2 billion (or 46 percent) came from fatal and serious injury crashes.
By pinpointing where and how fatal and serious injury crashes happen, we can better understand the underlying causes of crashes.
Figure 3.3 shows that principle and minor arterials have the highest proportion of fatal and serious injury crashes. Crashes involving people walking, rolling, and bicycling are also more prevalent on principal and minor arterials—where fast vehicles and non-motorized traffic mix, often in a dangerous way.
Most roads are managed, or owned, by either a municipality, MassDOT, or the Department of Conservation and Recreation (DCR) . Figure 3.4 shows that most fatal and serious injuries occur on locally owned roads. This suggests a significant proportion of improvements to advance safety are actionable by municipalities in the region.
Figure 3.2 | All Fatal and Serious Injury Crashes by Roadway Type, 2018–2022
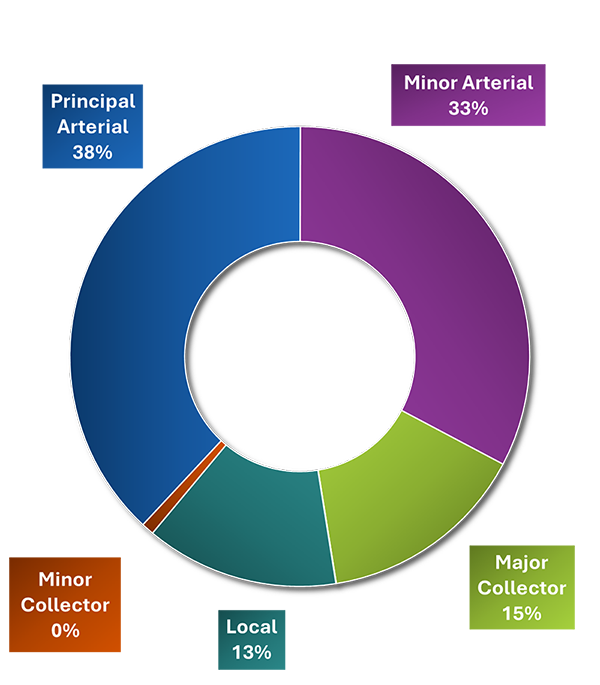
Figure 3.3 | All Fatal and Serious Injury Crashes by Road Ownership, 2018–2022
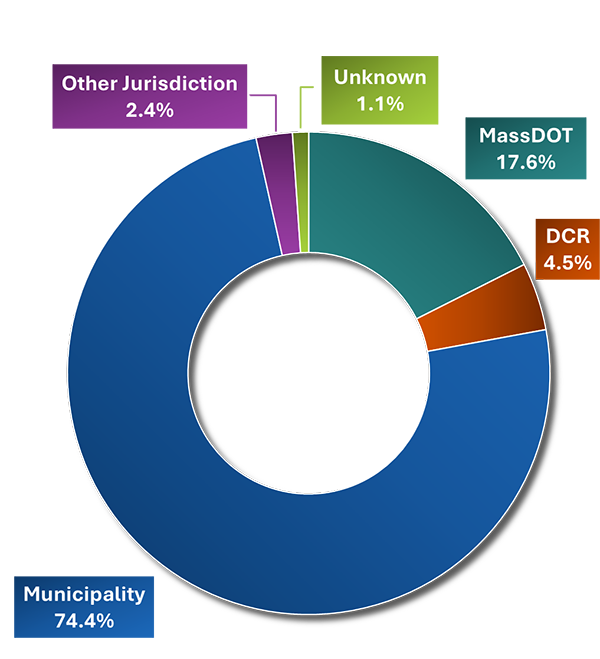
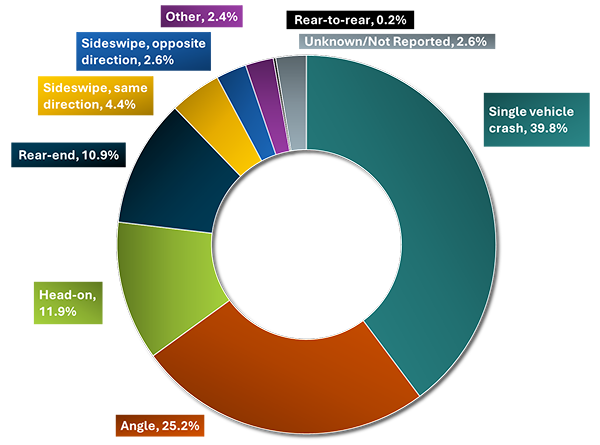
Figure 3.4 illustrates that nearly 60 percent fatal and serious injury crashes involved two or more vehicles and approximately 40 percent were single vehicle crashes. Among single vehicle crashes resulting in a fatality or serious injury, the most common first harmful events were collisions with pedestrians at 35 percent.
Figure 3.4 | Fatal and Serious Injury Crashes by Collision Type, 2018–2022
The data also shows us that crashes that happen at night are disproportionately more likely to result in fatalities or serious injuries, often due to increased impaired driving and speeding.
To further determine the major crash types this Action Plan should focus on, the MPO examined emphasis areas for the Commonwealth identified by the Massachusetts Highway Safety Improvement Program (HSIP), which offer a helpful framework for identifying common crash issues, analyzing contributing factors, and linking them with a set of targeted countermeasures and strategies.1F2
In Table 3.1, emphasis areas that are more prevalent in the region compared to the Commonwealth are highlighted in bold. Data in this table do not include crashes along Interstates, expressways, other fully access-controlled roadways, or ramps.
Table 3.1 | Emphasis Areas
| Massachusetts HSIP Emphasis Area |
Boston Region |
Massachusetts |
|||
|---|---|---|---|---|---|
| Number of Fatal and Serious Injury Crashes |
% of Total Fatal and Serious Injury Crashes |
Percent Change from 2018 to 2022 |
% of Total Fatal and Serious Injury Crashes |
Percent Change from 2018 to 2022 |
|
Intersections |
1,756 |
44.1% |
7.0% |
39.7% |
15.6% |
Lane Departure |
842 |
21.1% |
42.8% |
25.9% |
37.7% |
Older Drivers |
837 |
21.0% |
23.5% |
20.0% |
18.5% |
Pedestrians |
781 |
19.6% |
-3.9% |
14.9% |
11.0% |
Younger Drivers |
449 |
11.3% |
53.7% |
12.7% |
52.2% |
Motorcyclists |
424 |
10.6% |
62.9% |
14.5% |
58.6% |
Distracted Driving |
314 |
7.9% |
36.5% |
8.9% |
23.4% |
Bicyclists |
300 |
7.5% |
92.3% |
5.1% |
60.9% |
Impaired Driving |
277 |
6.9% |
23.9% |
8.3% |
48.0% |
Large Vehicles |
215 |
5.4% |
20.0% |
5.3% |
27.2% |
Speeding |
205 |
5.1% |
90.6% |
6.6% |
84.8% |
Occupant Protection |
182 |
4.6% |
37.5% |
4.8% |
15.0% |
Source: Data Query and Visualization from MassDOT IMPACT Portal.
Note: Percentages bolded are greater than the corresponding percentage in the entire Commonwealth of Massachusetts. Data in Table 3.1 does not include crashes along Interstates, expressways, other fully access-controlled roadways, or ramps.
Based on the prevalence and overrepresentation in the region’s fatal and serious injury crashes, the increasing rates of crashes observed over the past five years, and stakeholder input, Intersections, Lane Departure, Vulnerable Road Users, Older Drivers, Speeding, and Large Vehicles emerged as key Emphasis Areas (EA) for this Plan. These areas guide the focus of strategies and actions outlined below.
Intersection-Related Crashes: Intersection-related crashes were the most common type of fatal and serious injury crashes from 2018 to 2022, contributing to 44 percent of the region’s total. Particularly, crashes at four-way intersections and T-intersections accounted for the majority (94 percent) of fatal and serious injury intersection crashes.
Vulnerable Road User-Involved Crashes: From 2018 to 2022, while these crashes accounted for only 5 percent of total roadway crashes, they made up 27 percent of fatal and serious injury crashes within the region. Compared to other road users, Vulnerable Road Users were eight times more likely to be killed or seriously injured in a crash. The inclusion of this EA is further supported by the Vision Zero emphasis on these road users.
Lane Departure Crashes: Lane departure fatal and serious injury crashes increased steadily from 138 in 2018 to 197 in 2022, representing a 43 percent rise over five years. These crashes were often correlated with instances of impaired driving and speeding, emphasizing the importance of context-sensitive roadway design and awareness efforts targeting these high-risk behaviors.
Older Driver-Involved Crashes: Key risk factors associated with older drivers are age-related declines in physical and cognitive function, underlying medical conditions, individual driving habits, and limitations in roadway design and vehicle features. The older driver EA has one of the largest shares (21 percent) of all fatal and serious injury crashes between 2018 and 2022. Older drivers crashes are also overrepresented in the region compared to the rest of the Commonwealth.
Speeding-Related Crashes: The region experienced a substantial increase of 91 percent in speeding-related fatal and serious injury crashes from 2018 to 2022, one of the fastest growing areas of concern. Speeding is a key issue identified by many stakeholders.
Large Vehicle-Involved Crashes: Those involved in crashes involving large vehicles faced a particularly high risk of fatal or serious injury when not wearing seatbelts or those traveling at night. Other potential contributing coincidental factors included a lack of lane separation, high posted speed limits, and inadequate roadway lighting. Many stakeholders identified large vehicle safety as a key issue.
The MPO carried out a network screening to identify and classify sites with road safety risks using a two-part approach. By addressing both specific and systemic safety needs, we build a Safe System through identification of a High Injury Network (HIN) and High-Risk Network (HRN
High-Injury Network (HIN)
A crash data-based approach that identifies locations with the highest concentrations of past fatal and serious injury crashes based on historical crash data. This method targets locations with the greatest potential for safety improvement and supports site-specific safety issue diagnosis and countermeasure development.
High-Risk (Systemic) Network (HRN)
A proactive approach that focuses on sites with the highest risk of future fatal and serious injury crashes based on the presence of contributing risk factors from a systemwide perspective. This method enables the implementation of low-cost proven countermeasures across the network to prevent future severe crashes.
The development of an HIN is a critical component of Vision Zero planning. An HIN is a data-driven tool to identify the small proportion of roads that result in the greatest number of serious injury and fatal injury crashes. This HIN uses data for 2018-2022 from the Registry of Motor Vehicles (RMV) and takes into account the following considerations:
To account for the differences in crash severity, crashes were weighted if they were more severe or if they involved vulnerable road users. Table 3.2 shows how each crash was scored along a corridor to develop the HIN.
Table 3.2 | Crash Scores by Severity
| KABCO Severity Category |
Non-VRU Crash Score |
VRU Crash Score |
|---|---|---|
Fatal Injury (K) |
15 |
22.5 |
Suspected Serious Injury (A) |
15 |
22.5 |
Suspected Minor Injury (B) |
2 |
3 |
Possible Injury (C) |
1 |
1.5 |
More details on how the HIN was developed are in Appendix C.
This network crash analysis resulted in two levels of severity of high-injury roads in the region:
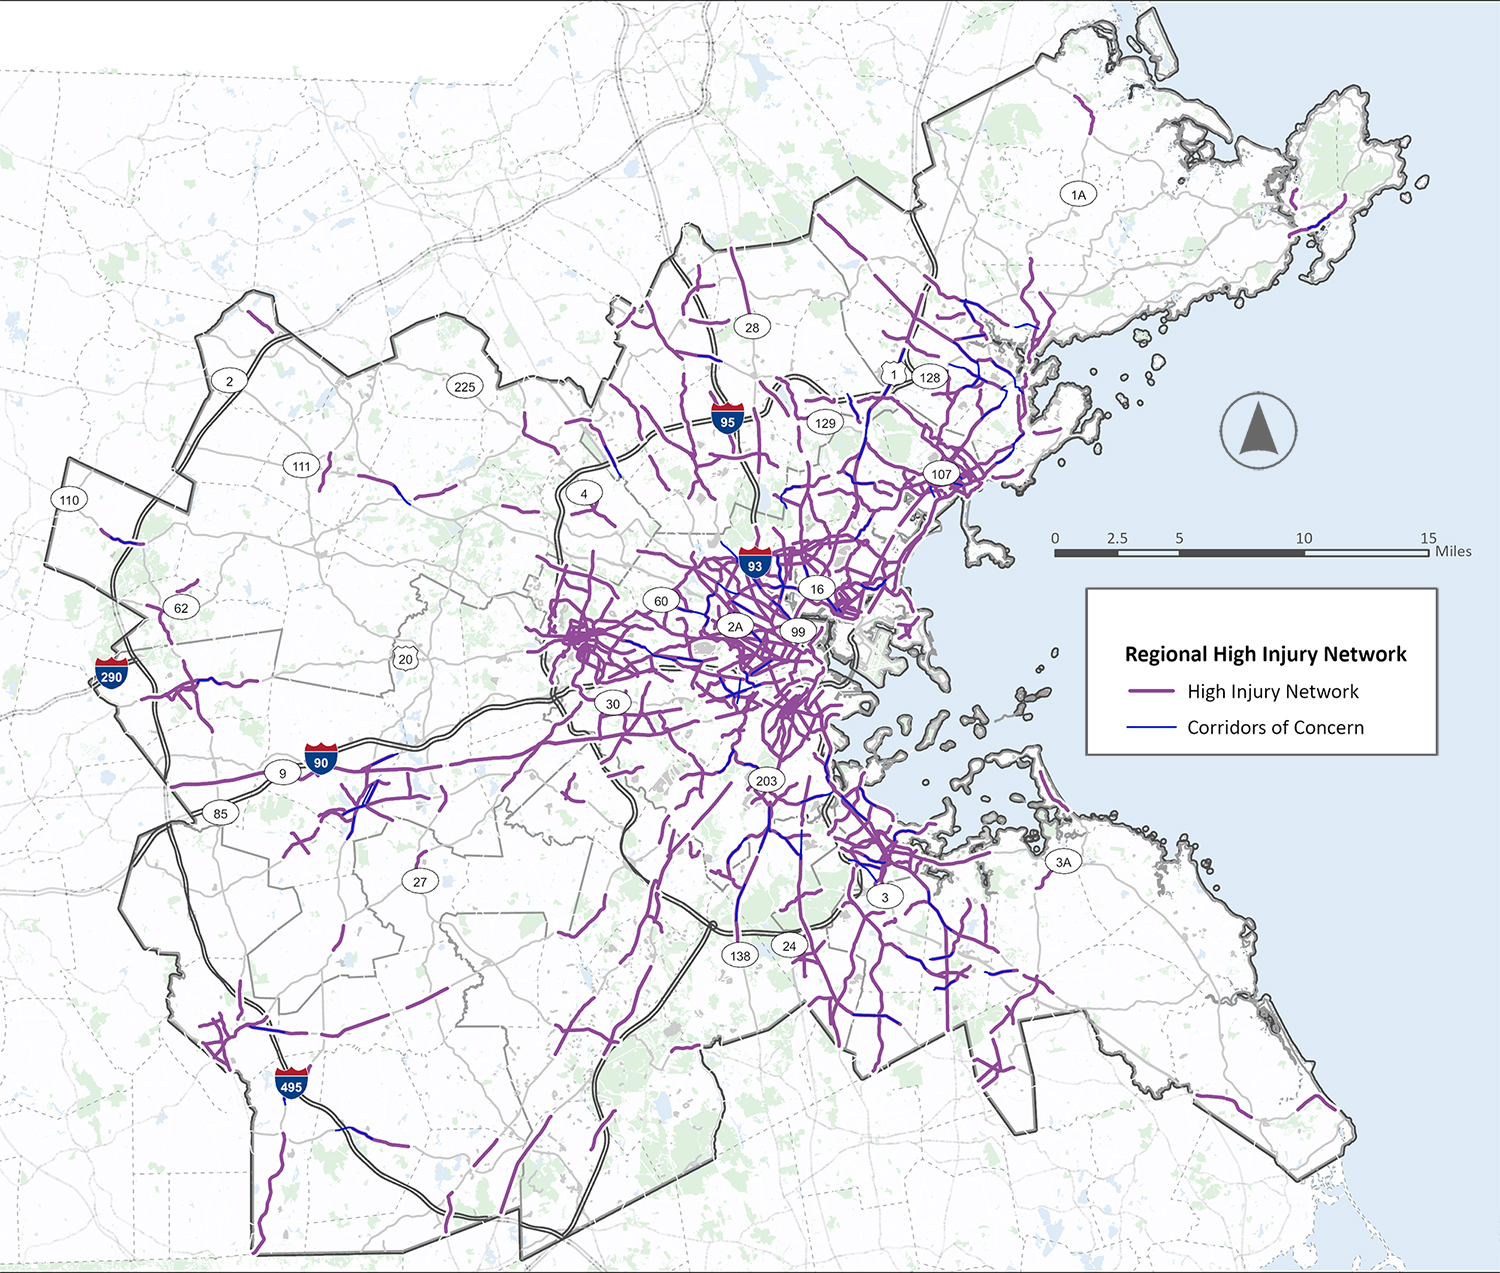
The HIN provides valuable insight into how severe crashes are distributed across the roadway network. Regionally, HIN corridors make up just 7 percent of the roadway network by mileage, yet they account for approximately 65 percent of fatal and serious injury crashes between 2018 and 2022.
As shown in Figure 3.5, the regional HIN is heavily concentrated in and around the Inner Core Committee (ICC) subregion. This pattern is likely influenced by higher traffic volumes and increased levels of pedestrian and bicycle activity in the area, which lead to more frequent interactions among roadway users and a greater potential for conflicts.
To provide a more context-sensitive understanding of corridors with severe crash concerns, subregional and municipal HINs were also developed. These finer-scale networks can support local municipalities in prioritizing safety improvements based on localized crash patterns. Municipalities can also partner with neighboring communities to implement coordinated safety projects along corridors that span municipal boundaries. To review the HINs in more detail, please visit https://www.bostonmpo.org/visionzero.
Figure 3.5 | Regional High-Injury Network
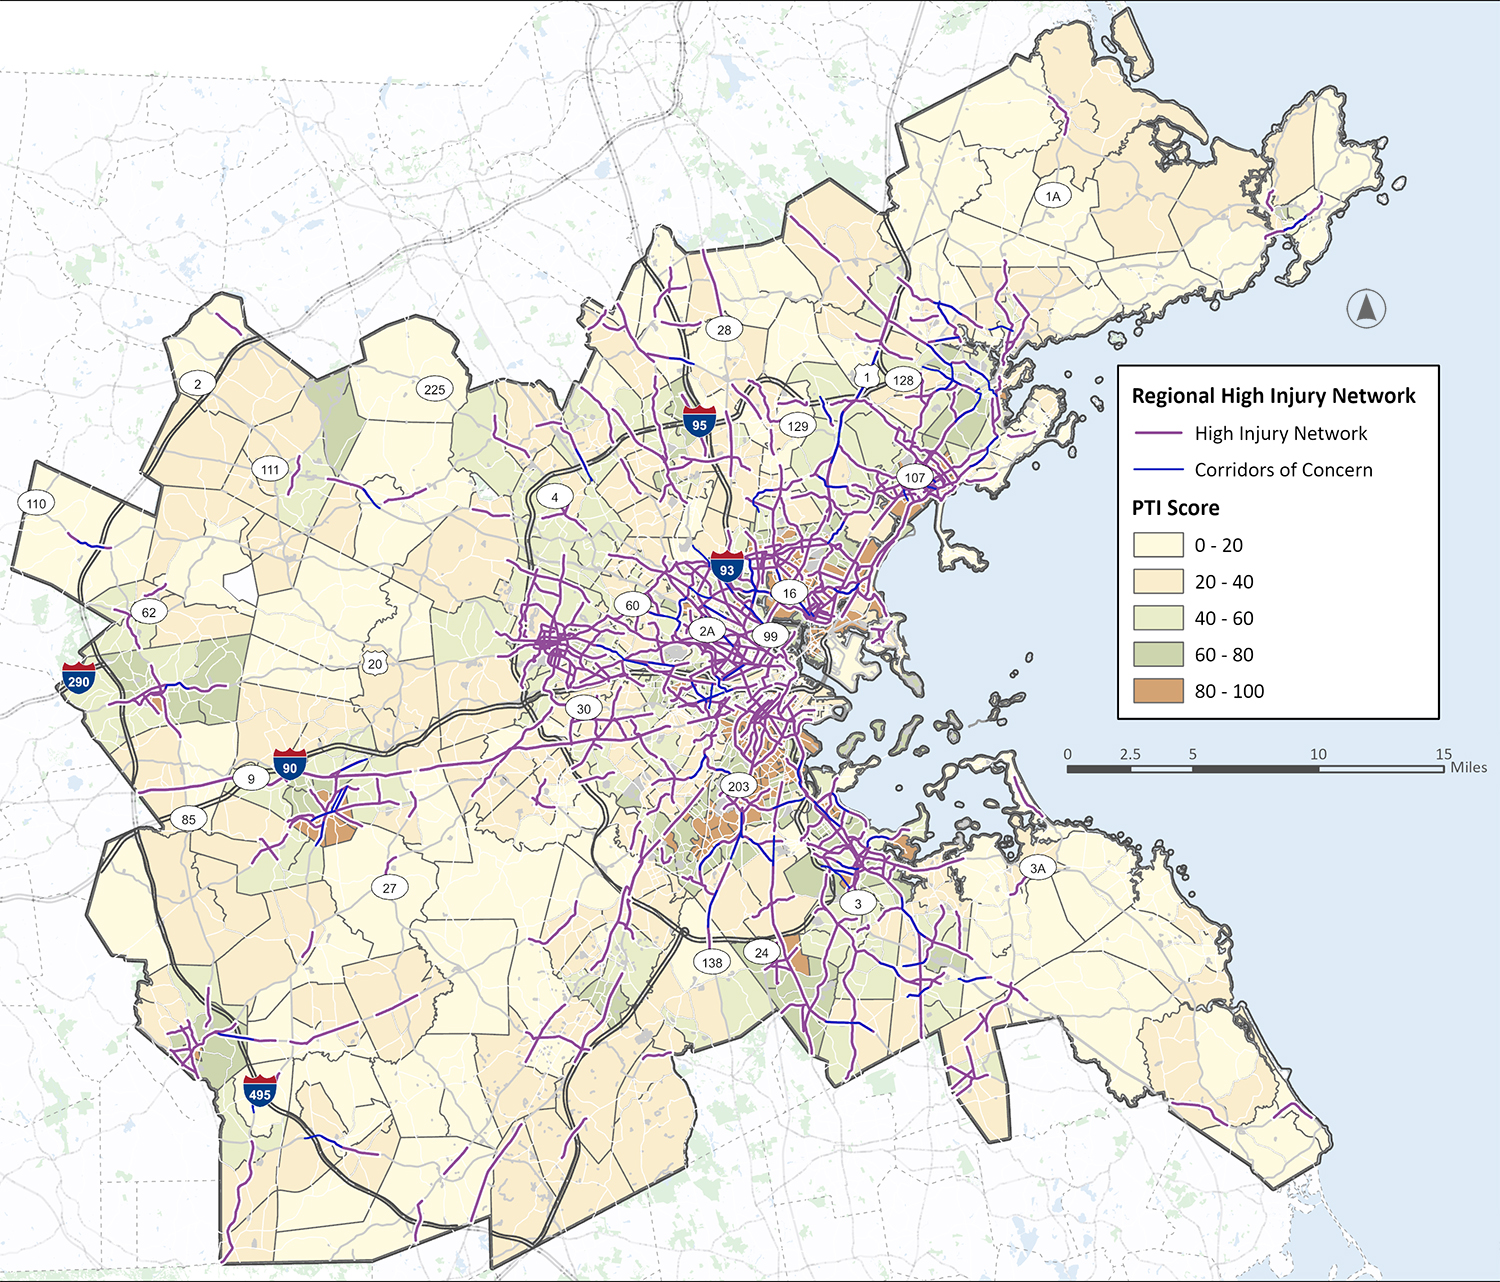
To identify communities and neighborhoods that are disproportionally exposed to unsafe infrastructure, the geographic distribution of Priority Transportation Investment (PTI) populations was overlaid with the regional HIN to assess whether a greater share of HIN corridors falls within areas with high concentrations of PTI populations. PTI populations were defined based on the share of low-income, minority, and limited English proficiency residents in each Census tract. Figure 3.6 shows this overlay. Appendix C includes more detail on the methodology, analysis and findings to identify PTI areas.
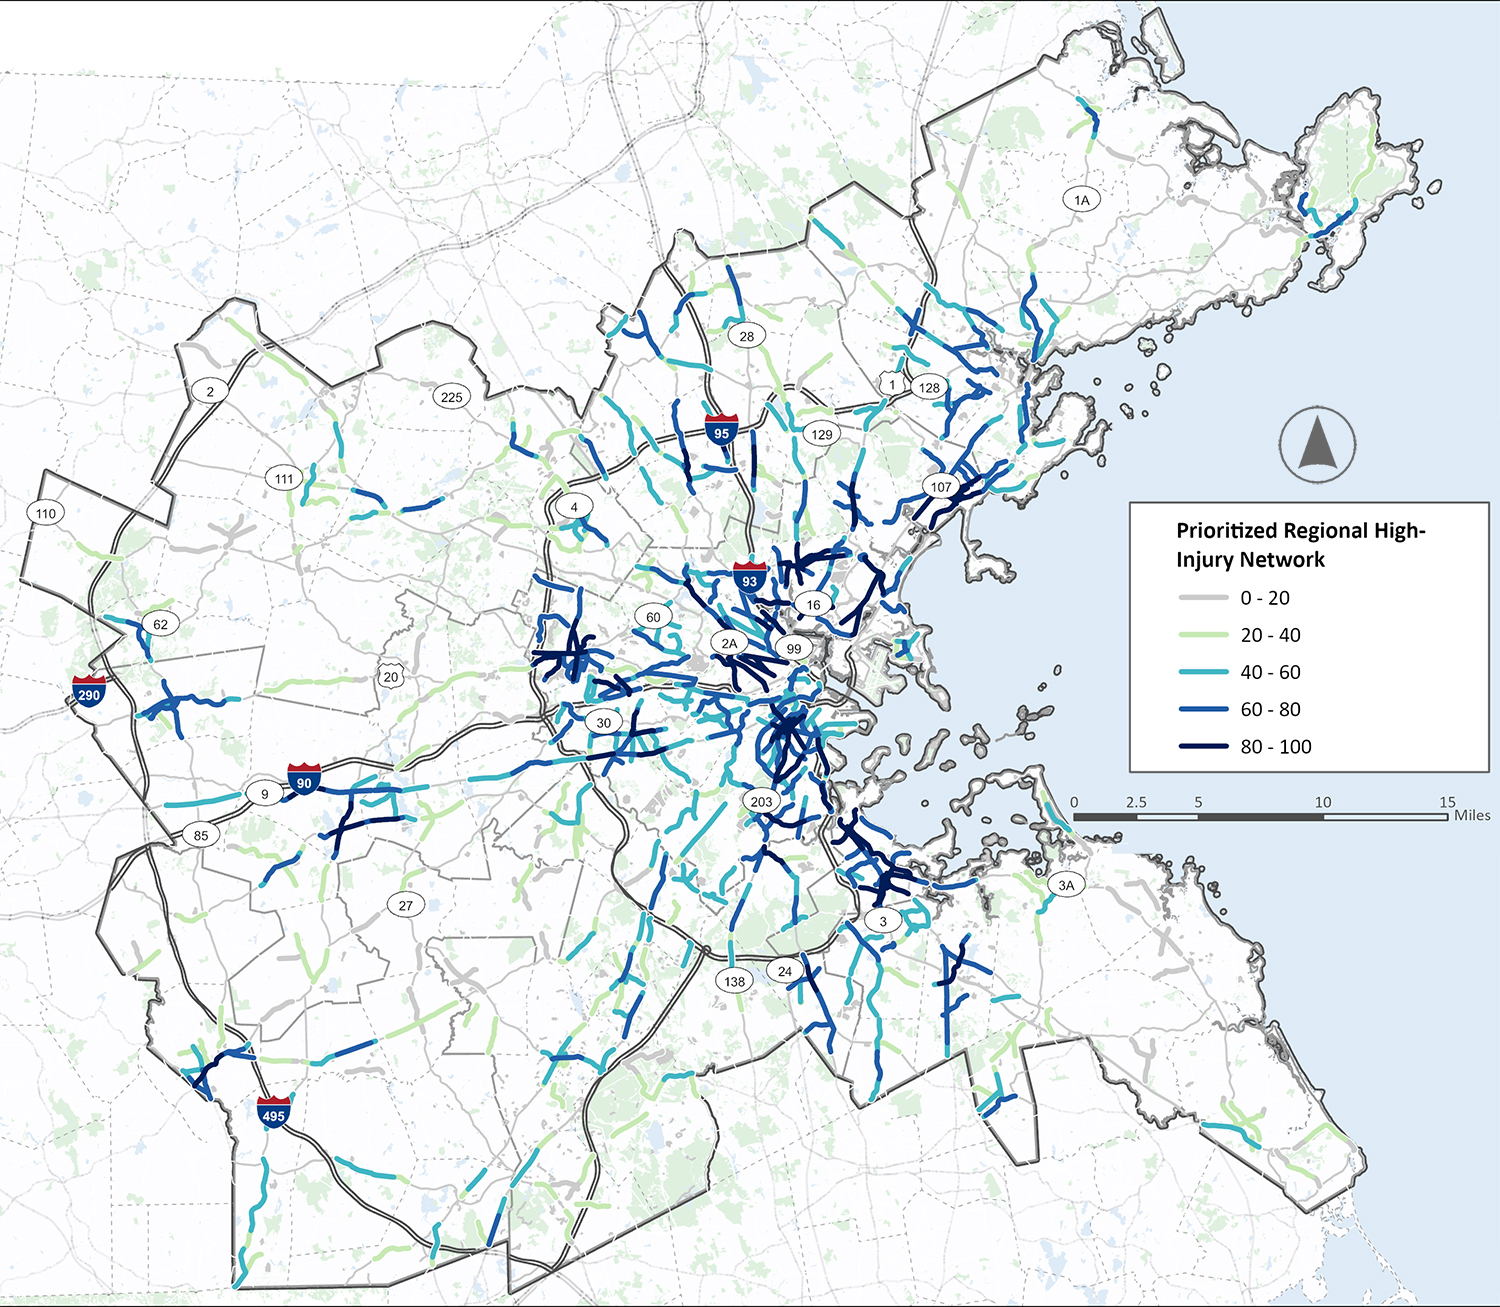
The priority network combines the HIN with other key criteria related to how people reach important destinations—whether the location is within a PTI community, has high rates of Vulnerable Road User travel, or is near transit stops, schools, hospitals, or other points of interest. The Prioritized HIN was developed at the regional, subregional, and municipal levels.
The networks were prioritized and scored from 0 to 100 using the screening elements and weights shown in Table 3.3, then normalized so that in each region, each subregion, or each municipality (depending on the network level), the highest score was 100 and the lowest score was 0. This final, normalized score is known as the priority score. The final regional prioritized network is shown in Figure 3.7.
Table 3.3 | Network Screening Elements
Network Screening Elements |
Weight |
Crash Score |
50 |
Priority Transportation Investment Communities |
20 |
Total Trip Activity |
5 |
Vulnerable Road User Trip Activity |
5 |
Presence of a Healthcare Facility |
5 |
Presence of an Education Facility |
5 |
Presence of a Transit Stop |
5 |
Presence of Other Points of Interest |
5 |
Maximum Total Score |
100 |
Building on this analysis, a series of Municipal Safety Profiles were created, included as Appendix E. These profiles describe common infrastructure, behavioral, operational, and modal safety challenges specific to each municipality. They also integrate findings from the existing conditions analysis, the HIN, community outreach, and other components of the plan to provide a comprehensive, context-sensitive understanding of local safety issues.
Figure 3.7 | Prioritized Regional High-Injury Network
The following maps and tables identify some of the highest-scoring corridors within each of the eight subregions. The identification of these top scoring corridors in each subregion helps illustrate how the MPO can use the prioritized HIN to start to focus in on the highest crash corridors that are in proximity to other mobility factors that the MPO prioritizes, such as transit, schools, and PTI areas. Next steps for what the MPO and municipalities can do to address safety concerns in these locations are detailed in the list of actions in Chapter 5.2F3
Figure 3.8 | Prioritized HIN in the ICC Subregion
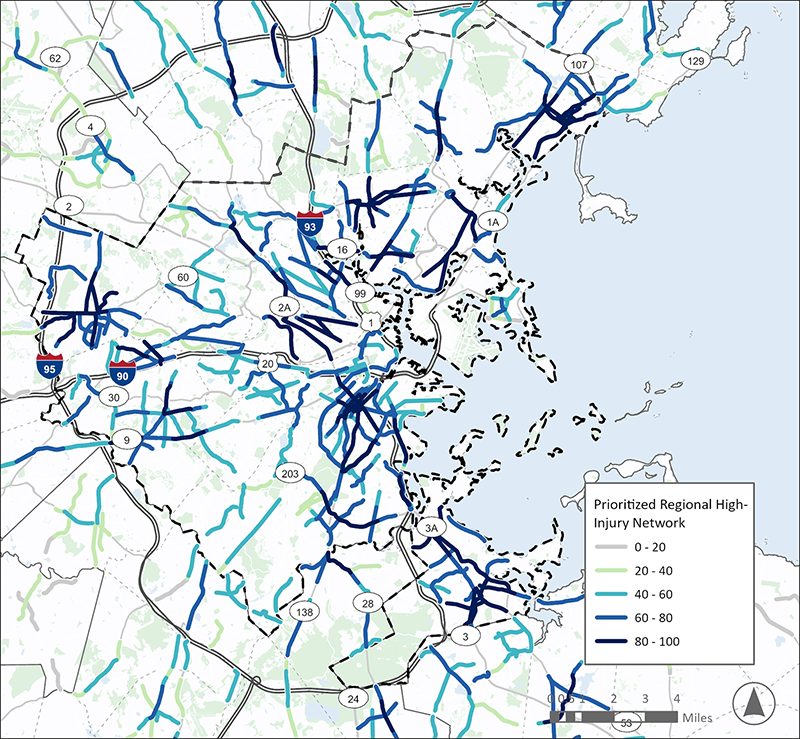
Table 3.4 | High-Scoring Locations in the ICC Subregion
Road |
From |
To |
Ownership |
Municipality |
Washington St |
Western Ave |
Broad St |
Local |
Lynn |
Liberty St |
Market St |
Baldwin St |
Local |
Lynn |
Squantum St |
Montclair Ave |
Billings St |
Local |
Quincy |
Hampshire St |
Amory St |
Broadway |
Local |
Cambridge |
Massachusetts Ave |
Columbus Ave |
Pompeli St |
Local |
Boston |
Figure 3.9 | Prioritized HIN in the MAGIC Subregion
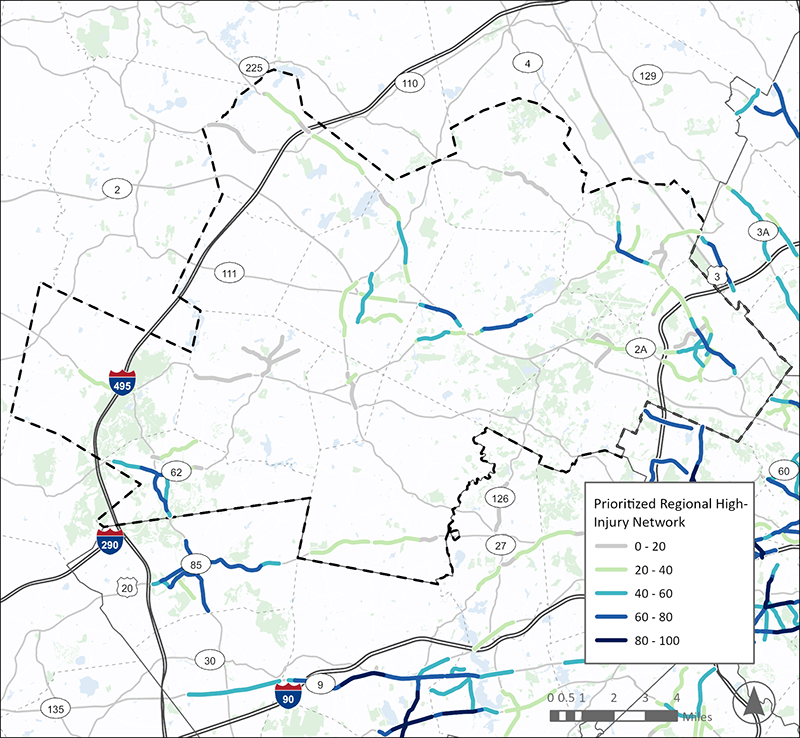
Table 3.5 | High-Scoring Locations in the MAGIC Subregion
Road |
From |
To |
Ownership |
Municipality |
Massachusetts Ave / Bedford St |
Percy Rd |
Hill St |
Local |
Lexington |
Central St / Main St |
Coolidge St |
High St |
Local |
Hudson |
Union Tpke |
School St |
Baker Ave Ext. |
State |
Concord |
Washington St |
Main St |
Hudson St |
Local |
Hudson |
Great Rd |
Loomis St |
North Rd |
Local |
Bedford |
Figure 3.10 | Prioritized HIN in the MetroWest Subregion
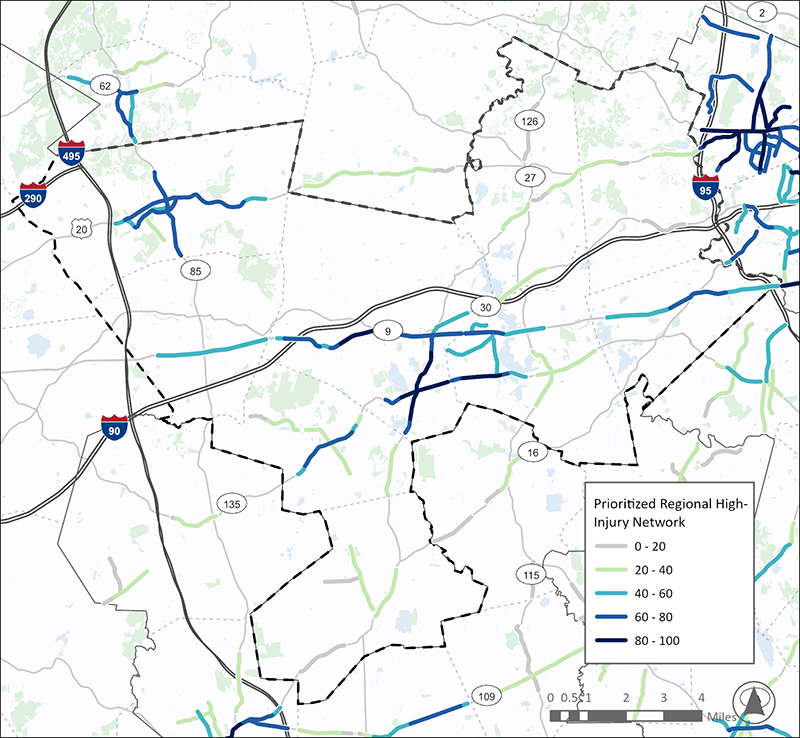
Table 3.6 | High-Scoring Locations in the MetroWest Subregion
Road |
From |
To |
Ownership |
Municipality |
Concord St / |
Normandy Rd |
Andrew St |
Local |
Framingham |
Waverly St |
Fountain St |
2nd St |
Local |
Framingham |
W Central St |
Kendall Ln |
Speen St |
Local |
Natick |
Bolton St |
Union St |
South St |
Local |
Marlborough |
Union St |
Chestnut St |
Indian Spring Rd |
Local |
Ashland |
Figure 3.11 | Prioritized HIN in the NSPC Subregion
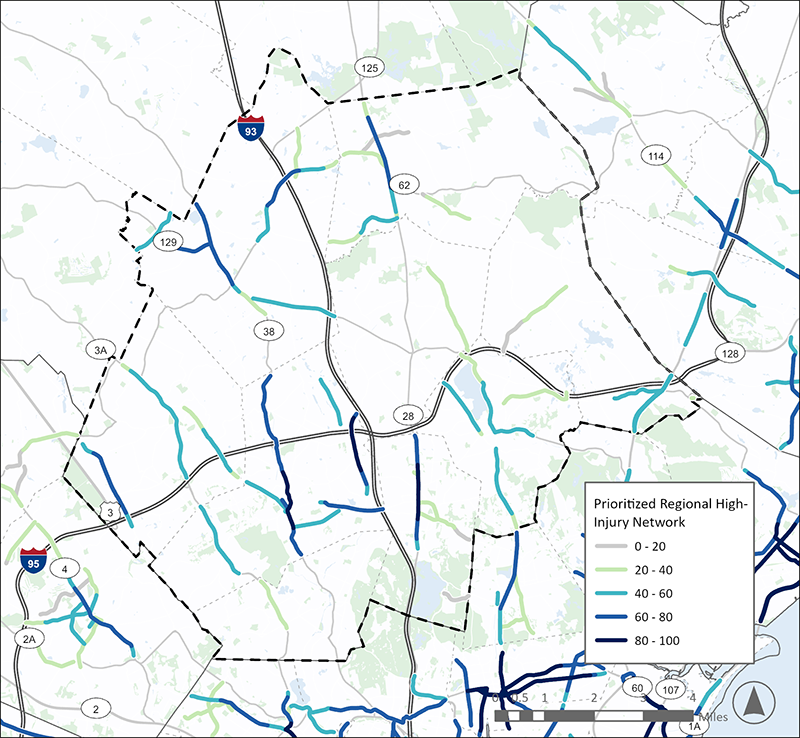
Table 3.7 | High-Scoring Locations in the NSPC Subregion
Road |
From |
To |
Ownership |
Municipality |
Main St |
Green St |
Clinton St |
Local |
Woburn |
Main St / Rt 28 |
Broadway |
William St |
State |
Stoneham |
Main St / Rt 28 |
William St |
Middle St |
Local |
Stoneham |
Washington St |
Dragon Ct |
Salem St |
State |
Woburn |
Middlesex Tpke |
I-95 |
Terrace Hall Ave |
Local |
Burlington |
Figure 3.12 | Prioritized HIN in the NSTF Subregion
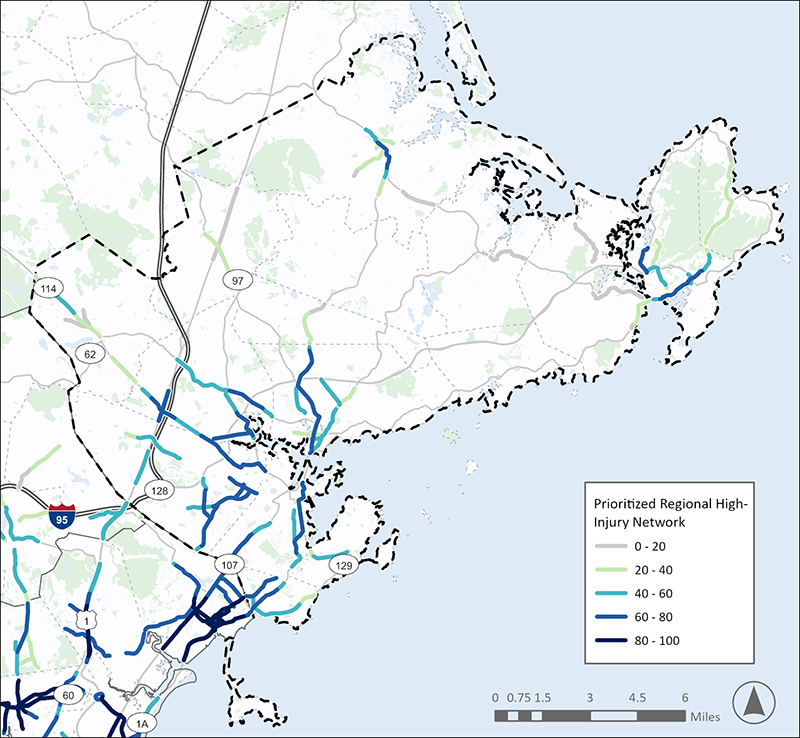
Table 3.8 | High-Scoring Locations in the NSTF Subregion
Road |
From |
To |
Ownership |
Municipality |
Rantoul St |
Swan St |
Pleasant St |
Local |
Beverly |
Hawthorn Blvd / Winter St |
Bridge St |
Derby St |
Local |
Salem |
Essex St |
Beach Ave |
Ryan Pl |
Local |
Swampscott |
Lafayette St |
New Derby St |
Hancock St |
Local |
Salem |
Main St |
Endicott St |
Howley St |
Local |
Peabody |
Figure 3.13 | Prioritized HIN in the SSC Subregion
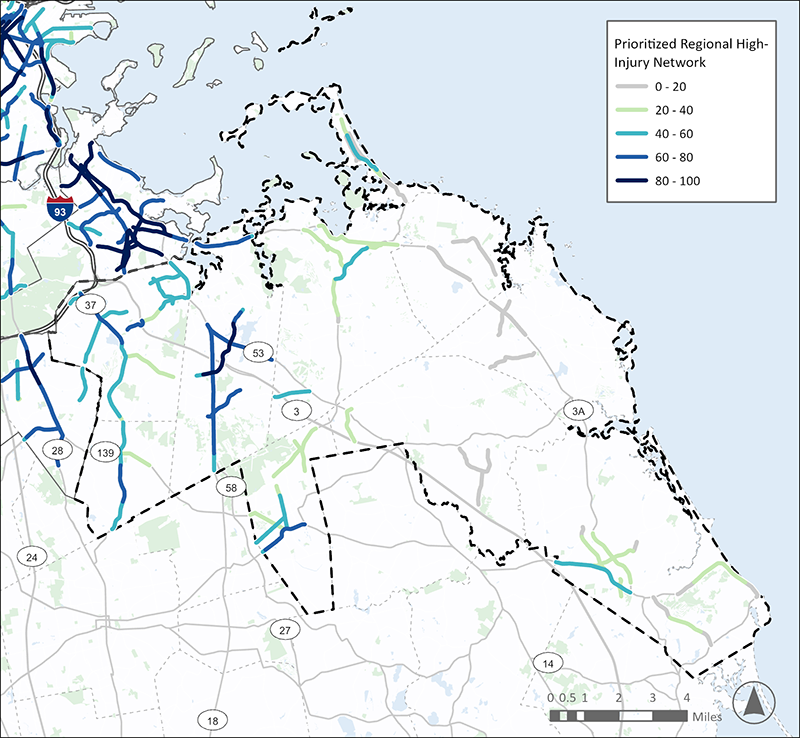
Table 3.9 | High-Scoring Locations in the SSC Subregion
Road |
From |
To |
Ownership |
Municipality |
Middle St |
Main St |
Essex St |
Local |
Weymouth |
Pleasant St |
Main St |
Park Ave |
Local |
Weymouth |
Granite St / Franklin St |
I-93 |
Washington St |
State |
Braintree |
Union St |
Washington St |
Pilgrims Hwy |
Local |
Braintree |
Center Ave / Market St |
Central St |
Liberty St |
State |
Rockland |
Figure 3.14 | Prioritized HIN in the SWAP Subregion
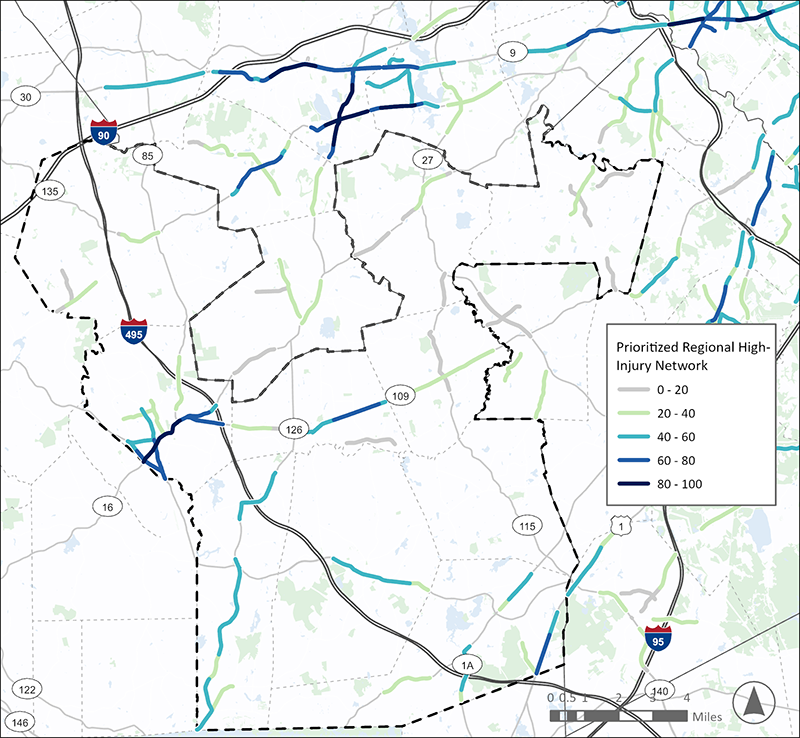
Table 3.10 | High-Scoring Locations in the SWAP Subregion
Road |
From |
To |
Ownership |
Municipality |
Main St / E Main St |
Prospect St |
Fortune Blvd |
Local |
Milford |
Medway St |
E Main St |
I-495 |
Local |
Milford |
US1 / Washington St |
Thurston St |
Madison St |
State |
Wrentham |
Main St |
Coffee St |
Pond St |
Local |
Medway |
Pulaski Blvd |
S Main St |
Bellingham St |
Local |
Bellingham |
Figure 3.15 | Prioritized HIN in the TRIC Subregion
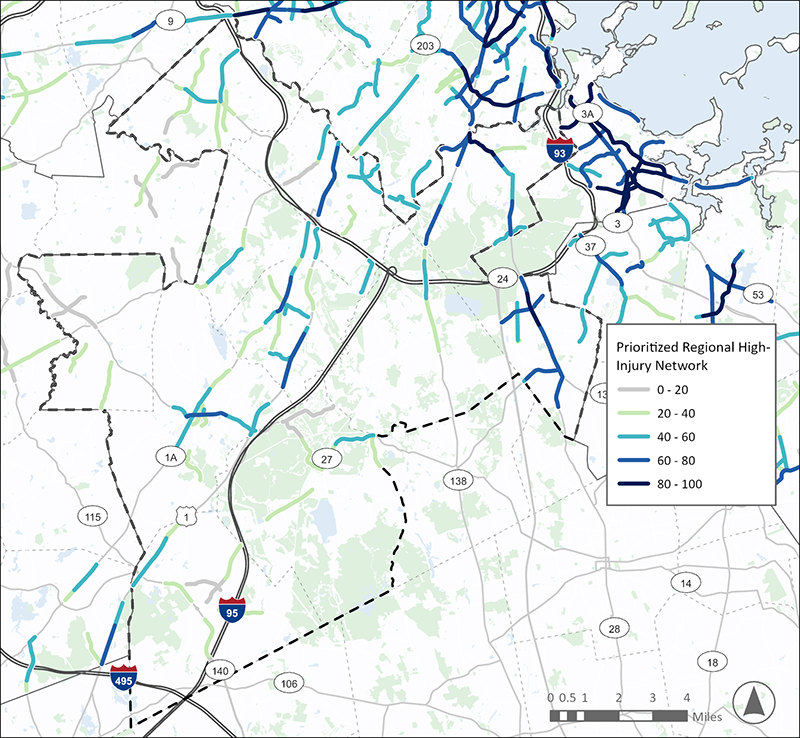
Table 3.11 | High-Scoring Locations in the TRIC Subregion
Road |
From |
To |
Ownership |
Municipality |
Brook Rd |
Blue Hills Pkwy |
Reedsdale Rd |
Local |
Milton |
Rt 28 / N Main St |
I-93 |
Union St |
State |
Randolph |
Pond St / Reed St |
Rt 28 / N Main St |
High St |
Local |
Randolph |
Blue Hills Ave |
Blue Hills Pkwy |
Valentine Rd |
State |
Milton |
Providence Hwy |
Washington St |
Elm St |
State |
Dedham |
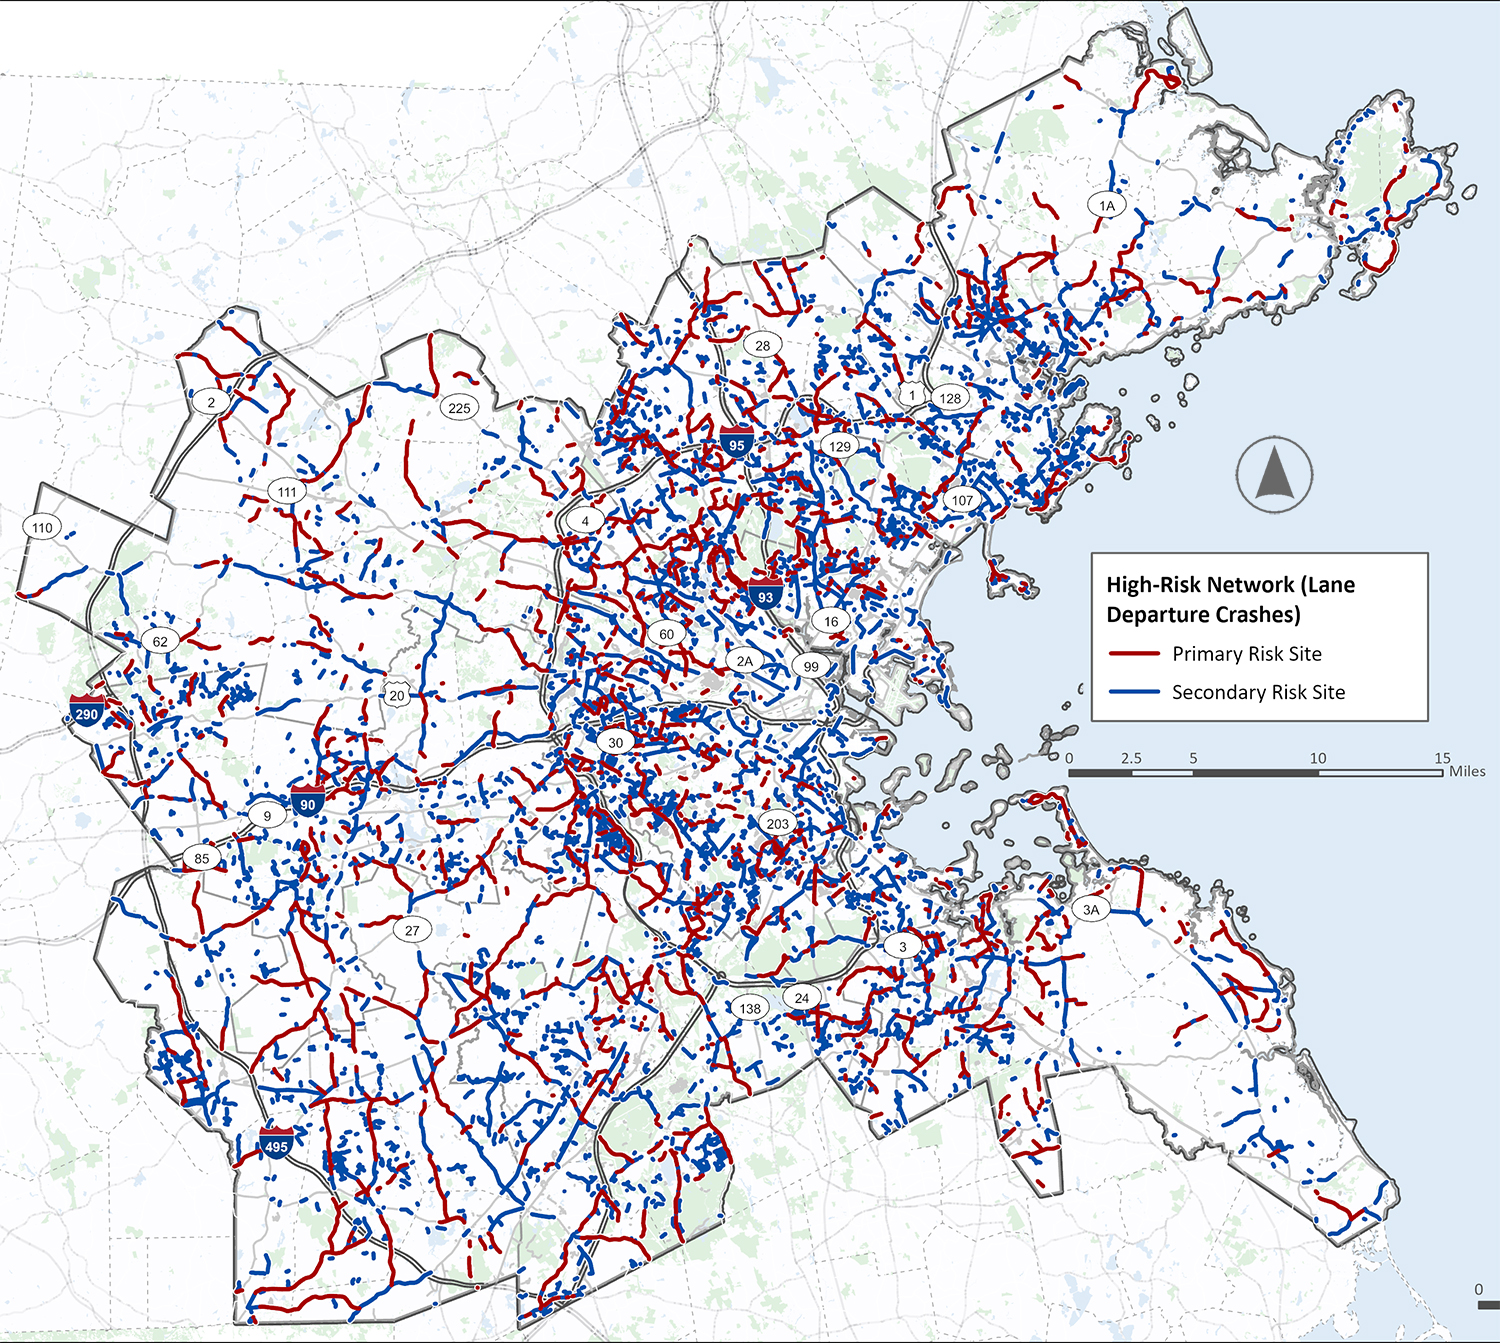
While the HIN identifies locations with a high concentration of crashes, the risk-based (or systemic) analysis and high-risk network (HRN) focuses on locations with a high risk of severe crashes, regardless of crash history. The HRN uses roadway features tied to the region’s most severe crash types to identify corridors and intersections that shar e these features. Corridors and intersections that have many features in common with areas where severe crashes have already occurred are deemed to have the highest risk for future severe crashes. This proactive approach enables road owners to prioritize higher-risk locations for preventative safety improvements before a significant number of severe crashes take place.
The process to develop a HRN follows the process recommended by the Federal Highway Administration (FHWA) in its Systemic Safety User Guide. The process identifies facility types where the crashes are most likely to occur, then calculates a risk score where locations with higher risk scores are more likely to have crashes of a specific type. The risk score is then used to categorize either intersections, segments, or municipalities into the following types:
Six of these networks were developed, one for each of the region’s key emphasis areas. Figure 3.16 shows an example of the HRN for lane departure crashes. The full list of focus facility types and risk factors identified for each regional emphasis area is provided in Appendix D, along with a summary of sites by jurisdiction, risk category, a detailed methodology, and all underlying data.
The focus crash types considered in the HRN are consistent with the Massachusetts SHSP Emphasis Areas and the supporting countermeasures are in alignment with MassDOT and FHWA guidance.
Figure 3.16 | High-Risk Network Example—Lane Departure Crashes
As described above, the Boston Region Vision Zero Action Plan uses two key tools: the prioritized HIN and the HRN. The HIN can help roadway owners and stakeholders pinpoint locations that have already proven to be dangerous, guiding a deeper look into why those crashes occurred. The HRN, on the other hand, takes a proactive approach by identifying locations with characteristics known to contribute to crashes, even if they haven't had a high number of reported incidents yet. Both networks serve as a starting point for more detailed investigations into safety concerns at specific locations. Both networks can be further explored using an online interactive map on our website https://www.bostonmpo.org/visionzero. This tool will allow stakeholders to understand what these networks mean for their communities. The countermeasures and strategies in Chapter 5 will also guide how the region can address the roadway safety and risk challenges identified in this plan.
4 Public and Stakeholder Engagement
Engagement is crucial to develop a successful Vision Zero Action Plan that directly addresses the region’s transportation safety challenges. By engaging a wide variety of stakeholders, the MPO was able to collect meaningful insight into the region’s biggest safety concerns and identify where the Action Plan should focus its efforts. Engagement activities also identified potential and preferred solutions that can make the Boston region’s streets safer for all people who walk, roll, bike, ride transit, and drive.
Vision Zero Action Plan Engagement Goals
As communities in the Boston region range from relatively rural towns (such as Dover) to larger urban centers (e.g., Boston and Cambridge), the MPO developed an engagement strategy to ensure input was collected from the wide array of diverse perspectives within the MPO’s jurisdiction.
The MPO also leveraged a diverse range of communication tools to share updates about the project, collect input, and invite stakeholders to participate in plan development:
Community Partners Toolkit
The MPO shared this with 75 CBOs in the region to help spread awareness of the Action Plan development among various audiences. The toolkit includes a variety of messages and tools in “ready to share” format.
Community Partners Toolkit
The MPO shared this with 75 CBOs in the region to help spread awareness of the Action Plan development among various audiences. The toolkit includes a variety of messages and tools in “ready to share” format.
The engagement timeline is shown in Figure 4.1.
Appendix F describes the purpose of each individual engagement activity or communication tool and provides an overview of participants for each engagement activity, as well as the intended audience or type of attendee.
Vision Zero Task Force input is key to shaping an action plan that shifts the region away from the status quo. Task Force members brought perspectives from municipalities; school systems; pedestrian, bike, accessibility, and public health organizations; and state and federal transportation agencies. In addition to the full Task Force, the MPO also designated three Subcommittees focused on safety analysis, engagement, and policy. The members of the Task Force are show in Table 4.1 .
Table 4.1 | Vision Zero Task Force Members
| Name |
Affiliation |
|---|---|
Daniel Albert |
Resident of Marblehead |
Ari Belathar |
Former Executive Director, Boston Cyclists Union |
Kristopher Carter |
Chief Possibility Officer, Massachusetts Department of Transportation |
Jacqueline DeWolfe |
Director of Mobility Policy and Program Development |
Alex Epstein |
Resident of Somerville |
Charlotte Fleetwood |
Senior Transportation Planner, Boston Transportation Department |
JR Frey |
Town Engineer, Town of Hingham |
James Fuccione |
Executive Director, Massachusetts Healthy Aging Collaborative |
Catherine Gleason |
Public Policy Manager, Liveable Streets Alliance |
Tina Hein |
Vice Chair Select Board, Town of Holliston; Massachusetts Safe Routes of School Outreach Coordinator |
Brendan Kearney |
Co-Executive Director, WalkMassachusetts |
Jeremy Marsette |
Town Administrator, Town of Sherborn |
Galen Mook |
Executive Director, MassBike |
Shavel’le Oliver |
Executive Director, Mattapan Food and Fitness Coalition |
Kathryn Quigley |
Deputy Director of Strategic Planning, MBTA Systemwide Accessibility |
Brad Rawson |
Director, Mobility Division, City of Somerville |
Katarina Torres Radisic |
Riders Transportation Access Group (RTAG) |
Ryan Williams |
Resident of Melrose |
Stephen Winslow |
City Councilor, City of Malden |
Task Force member participation informed several essential sections of the Action Plan’s development. The Task force guided public and stakeholder engagement, the safety analysis, policy and process review, and selection of strategies and countermeasures for implementation. Additionally, combined feedback from the Task Force and municipalities helped refine and finalize this project’s HIN.
Across all activities, participants included members of the general public, municipal planners and engineers, municipal law enforcement officers, other municipal staff, individuals with disabilities, Aging Service Access Point staff, Chambers of Commerce staff, and members of community-based and advocacy organizations. Table 4.2 lists all major engagement activities and who was involved.
Table 4.2 | Vision Zero Action Plan Engagement Activities
| Engagement Activity |
Dates Completed |
Purpose |
Number of Attendees/ |
Type of Attendee/Audience |
|---|---|---|---|---|
Task Force |
February 13, 2024 October 2, 2024 October 9, 2024 December 16, 2024 December 19, 2024 February 3, 2025 May 2, 2025 June 16, 2025 |
Provide input and guidance about the development of the Vision Zero Action Plan, including meetings with safety analysis, engagement, and policy subcommittees |
18 Task Force members |
Representation from multiple levels of municipal leadership; advocates for walking, biking, schools, and accessibility; and state and Federal partners |
Municipal Survey |
Opened: Closed: |
Collect input from municipal staff about transportation safety issues, challenges to improving safety, and priorities. Paired with municipal virtual office hours |
Submissions from 36 municipalities |
Planners, City Councilors, Public Works staff, Town Engineers, Housing and Economic Development Staff |
Municipal Virtual Office Hours |
September 25, 2024, 11:00 AM |
Collect input from municipal staff about transportation safety issues, challenges to improving safety, and priorities. Paired with municipal survey |
6 attendees |
Planners, City Councilors, DPW directors, Town Engineers, Transportation Planners, Housing and Economic Development Staff |
Public Survey |
Opened: Closed: |
Collect input from members of the general public about perceived transportation safety concerns and desired solutions |
761 submissions from people who live across 58 municipalities within region |
General public |
Safety Concerns Comment Map |
Opened: Closed: |
Collect input from members of the public about perceived transportation safety concerns and desired solutions at specific locations throughout the region |
921 submissions identifying 3,952 safety concerns across 55 municipalities within region |
General public |
Virtual Public Forum |
January 29, 2025, 6:00 PM |
Present overview and purpose of Vision Zero Action Plan and region’s safety data; learn about public’s perspectives on safety challenges, concerns, and solutions |
37 attendees |
General public |
High Injury Network Municipal Virtual Office Hours |
March 3, 2025 March 6, 2025 |
Discuss the draft HIN and HRN methodology and maps |
14 attendees on March 3 8 attendees on March 6 |
Municipal Planners, Public Works Directors, Town Engineers, Law Enforcement |
Policy Interviews |
November 2024 through May 2025 |
Identify policies and processes that might be missing, that inhibit safety, or need additional resources to implement successfully |
13 interviews |
Municipal Planners, Public Works Directors, Town Engineers; Massachusetts Department of Conservation and Recreation; Massachusetts Executive Office of Public Safety and Security Office of Grants and Research |
Focus Group—Adults with Disabilities |
April 14, 2025, 5:30 PM |
Understand how stakeholders with disabilities that impact their mobility travel and maneuver safely around the region |
8 attendees |
Adults with Disabilities in the Boston region |
Aging Services Access Point Providers Roundtable and follow-up Older Adults Survey |
April 16, 2025, 2:00 PM |
Understand how older adults travel and their perceptions about traffic safety challenges and needs in the region |
7 attendees (Discussion) 2 submissions (Survey) |
ASAP Directors and Staff |
Discussion on Roadway Safety—Chambers of Commerce |
April 17, 2025, 2:00 PM |
Understand the business community’s perceptions of safety challenges and efforts to improve safety |
3 attendees; 1 follow-up conversation |
Chambers of Commerce Staff |
Municipal Roundtable—Law Enforcement |
May 8, 2025, 10:00 AM |
Discuss potential solutions and strategies to address identified safety issues, from an enforcement perspective |
5 attendees |
Municipal Law Enforcement |
Municipal Roundtable—Departments of Public Works and Planning |
May 9, 2025, 10:00 AM |
Discuss potential solutions and strategies to address identified safety issues, from a municipal perspective |
7 attendees; 1 follow-up conversation |
Municipal Planners and DPW Staff |
Across all engagement efforts, several key takeaways emerged about dangerous driver behaviors, roadway design and maintenance needs, policies influencing roadway safety, and funding gaps.
TOP REPORTED DRIVER BEHAVIOR CONCERNS:
Roadway design, geometry, and infrastructure conditions play key roles in people’s travel patterns and mode choices. Roadway designs that allow vehicles to travel at high speeds can inhibit awareness of pedestrians and bicyclists. When people feel unsafe biking or walking they are more likely to travel by vehicle. At the same time, some motor vehicle drivers feel unsafe while driving due to confusing roadway geometry, coupled with speeding and aggressive driving behaviors by others.
TOP REPORTED INFRASTRUCTURE CONCERNS:
Public policy and decision-making processes determine what safety priorities people and organizations will focus on, as well as how, when, and who can select, implement, and evaluate roadway safety solutions. While the Commonwealth and the region have many proactive and supportive safety policies and processes, stakeholders identified several policy areas where change is needed. Organizations that will lead and support policy changes include the MPO, municipalities, MassDOT, the Massachusetts General Court, and advocacy and non-profit organizations.
POLICY AND PROCESS SUGGESTIONS INCLUDE:
Many municipal stakeholders, including planners, public works staff, and law enforcement officers, identified lack of funding and funding inflexibility as critical challenges to undertaking more roadway safety improvements. This sentiment was expressed across many engagement activities, including the municipal survey, virtual office hours, interviews, and roundtables. Stakeholders want to address roadway safety in a holistic and comprehensive manner but have insufficient resources to do so. While quick-build, low-cost improvements can improve safety outcomes in some cases, many proven safety countermeasures are resource- and time-intensive. Staff capacity can also be a challenge, especially for smaller municipal departments with many shared responsibilities.
5 Strategies, Policies, Countermeasures, and Plan Implementation
This Vision Zero Action Plan offers a comprehensive set strategies, countermeasures, and implementation resources to address regional traffic safety challenges identified throughout the Action Plan development process.
Safety improvements in the region should be guided by the data analysis, prioritized HIN and HRN mapping (Chapter 3), and stakeholder engagement feedback (Chapter 4). The National Highway Traffic Safety Administration (NHTSA) and the FHWA provide guidance on the application and impact of Proven Safety Countermeasures to address speeding, pedestrian and bicyclist safety, roadway departure, intersections, and crosscutting safety improvements. These measures should be considered for widespread implementation to address unsafe infrastructure and dangerous driving in the region. More information and guidance on Proven Safety Countermeasures can be found in Appendix H.
Additional best practice resources include:
In addition to pursuing funding through the MPO’s TIP (see: https://www.bostonmpo.org/tip), other programs are available to provide funding to implement projects described in this Action Plan, as safety-focused projects, or as part of other, broader initiatives, depending on the countermeasure and project.
Some strategies require legislative changes in the Massachusetts General Court. As Action Plan implementation continues, the MPO will track roadway safety bills and help communicate the role and importance of these policies to stakeholders. These policies are explained in detail in Appendix G and summarized here:
A critical part of implementation of the regional Vision Zero Action Plan will be for the MPO to continue engagement with municipal partners to refine the prioritized HIN, understand more about the causes of crashes at high priority locations, and create communication and education materials to continue to spread awareness of Vision Zero and the Safe System Approach. The strategies below also identify the key actions that municipal partners should consider to address high priority crash and risk locations.
Action Plan strategies are organized by emphasis area (Intersections, Lane Departure, Vulnerable Road Users, Older Drivers, Speeding, and Large Vehicles) and include policies, process changes, education and engagement, enforcement, and infrastructure best practices. Each action identifies a lead agency and supporting partners. Actions are grouped by timeframe for implementation (short-term: 1–3 years; medium-term: 3–5 years; long-term: 5 or more years; and, ongoing: actions that will recur or happen annually). These actions are supported by input gathered during stakeholder engagement, as well as Vision Zero implementation best practices (refer to Appendix F for more detail).
Cross-cutting actions span across every emphasis area to reflect the MPO’s commitment to saving lives. Cross-cutting action items reinforce the guiding principles of the Safe System Approach: death and serious injuries are unacceptable, humans make mistakes, humans are vulnerable, responsibility is shared, safety is proactive, and redundancy is crucial.
| Action |
Lead |
Support |
Timeframe1 |
Type |
|---|---|---|---|---|
Develop engaging messaging and educational materials to raise awareness about key crash causes and best practice interventions (including street design changes). |
Boston Region MPO |
Short-term |
Process |
|
Transition the MPO's Regional Vision Zero Task Force to a Regional Action Plan Implementation Task Force. |
Boston Region MPO |
Short-term |
Process |
|
Work with municipalities, MassDOT, and public health stakeholders to involve public health professionals in roadway safety efforts including local public health staff and epidemiologists as well as staff from the Massachusetts Department of Public Health's Injury Prevention and Control Program. |
Boston Region MPO |
Municipalities/ MAPC Public Health Team |
Short-term |
Process |
Coordinate with municipalities to explore the need for roadway safety educational materials that can be used to facilitate communication with the business community. |
Boston Region MPO |
Municipalities |
Short-term |
Process |
Create a toolkit of engineering countermeasures, including typical dimensions and specifications or standard drawings, drawing from local best practices (Boston, Cambridge, Somerville guides), MassDOT, NACTO, FHWA, and AASHTO guides. |
Boston Region MPO |
MassDOT |
Medium-term |
Process |
Further analysis of the prioritized HIN and coordination with municipalities to understand key crash types, causes, and locations (intersection vs. corridor) to develop interventions (including quick-build solutions). |
Boston Region MPO |
Municipalities/MassDOT |
Medium-term |
Process |
Work to align MPO planning and programming with Vision Zero goals and Safe System principles. |
Boston Region MPO |
Medium-term |
Process |
|
Conduct a data gap analysis and explore public health datasets ((e.g., hospital records, EMS data, syndromic surveillance, trauma registries) to explore and analyze further the causes of injury. |
Boston Region MPO |
Medium-term |
Data |
|
Plan and host peer exchanges to share best practices and problem solving with municipal planners, Depts of Public Works, law enforcement, elected officials, school leaders, and first responders. |
Boston Region MPO |
Ongoing |
Process |
|
Provide annual progress reports on the Regional Vision Zero Action Plan implementation. |
Boston Region MPO |
Ongoing |
Process |
|
Track state legislative changes related to roadway safety and communicate priority bills and safety impacts to stakeholders. |
Boston Region MPO |
Vision Zero and safe streets advocates |
Ongoing |
Process |
Research the potential of new technology solutions and share information with municipal and state partners, including intelligent speed assist and intelligent transportation system technologies such as adaptive signal control and vehicle-to-infrastructure communication. |
Boston Region MPO |
Municipalities/ |
Ongoing |
Process |
Incorporate HIN and HRN data and analysis into corridor reconstruction and maintenance projects so that safety improvements and best practices can be integrated with every municipal project, as appropriate. |
Municipalities |
MassDOT |
Short-term |
Infrastructure |
Adopt a local Vision Zero policy and goal |
Municipalities |
Short-term |
Policy |
|
Consider locations where pilot or quick-build traffic calming projects would be appropriate. Collect before and after data to evaluate the project and communicate findings with stakeholders and residents. |
Municipalities |
Boston Region MPO |
Medium-term |
Process/Infrastructure |
Establish a municipal Vision Zero Task Force or Working Group to foster a collaborative, data-driven, and equitable approach to traffic safety within the municipality and to review serious crashes when they do occur. |
Municipalities |
Boston Region MPO |
Medium-term |
Process |
Implement a systemic program to assess and improve street lighting, with a priority on locations with documented nighttime crashes involving vulnerable road users (pedestrians, cyclists, transit riders). This includes evaluating existing lighting levels, identifying dark or poor contrast zones, and deploying modern, high-efficiency lighting solutions to create safer conditions. |
Municipalities |
Boston Region MPO |
Long-term |
Process/ |
Request MPO technical assistance for planning and design of intersection and corridor safety improvements. |
Municipalities |
Ongoing |
Process |
1 Timeframes: Short-term: 1–3 years; Medium-term: 3–5 years; Long-term: 5+ years
Intersection safety is a cornerstone of any effective Action plan, as intersections are frequently points of conflict and high-severity crashes. The goal is to design intersections that are forgiving of human error and minimize vehicle speed involved in potential collisions.
| Action |
Lead |
Support |
Timeframe1 |
Type |
|---|---|---|---|---|
Develop prioritized list of high-crash intersections and coordinate with municipalities to develop safety interventions. |
Boston Region MPO |
Municipalities/ |
Ongoing |
Process |
Develop and implement a traffic safety signal policy and prioritization framework that includes guidelines for municipal signal changes such as protected left turns, leading pedestrian intervals, pedestrian and cyclist detection and phasing, accessible pedestrian signals, signal timing optimization for safety, clearance intervals, and emergency vehicle pre-emption and transit signal priority. |
Municipalities |
Medium-term |
Policy |
|
Improve crosswalk visibility by installing high-visibility crosswalks or raised crosswalks at all high-volume intersection crossings with a focus on intersections near priority destinations (such as schools, senior centers, hospitals, and transit stops). |
Municipalities |
MassDOT |
Medium-term |
Infrastructure |
Install pavement markings and physical delineation near crosswalks and intersections to improve sightlines for people driving and walking or rolling (daylighting intersections). |
Municipalities |
MassDOT |
Medium-term |
Infrastructure |
Install 'no turn on red' signage at signalized intersections on the HIN and HRN. |
Municipalities |
MassDOT |
Medium-term |
Infrastructure |
Coordinate with the MBTA to improve safety at at-grade rail crossings along the HIN and HRN. |
Municipalities |
Boston Region MPO/MBTA |
Medium-term |
Infrastructure |
Adopt citywide 'No Turn on Red' policy. |
Municipalities |
MassDOT |
Medium-term |
Policy |
1 Timeframes: Short-term: 1–3 years; Medium-term: 3–5 years; Long-term: 5+ years
Roadway departure crashes, where a vehicle leaves the traveled way and often strikes a fixed object, overturns, or enters a ditch, are a significant contributor to fatalities and serious injuries. This Action Plan will implement a multi-faceted approach to prevent these crashes by recommending more forgiving roadsides, improved driver awareness, and steps to address common contributing factors.
Action |
Lead |
Support |
Timeframe1 |
Type |
Use HIN and HRN to develop list of top locations for roadway departure crashes and roadway departure crash risk. |
Boston Region MPO |
Short-term |
Process |
|
Complement infrastructure improvements with targeted educational campaigns to address behavioral factors contributing to roadway departures, including partnering with state agencies and advocacy groups to conduct public awareness campaigns on the dangers of distracted and drowsy driving; and, enhancing outreach and education about the MA hands-free law. |
Boston Region MPO |
Municipalities |
Medium-term |
Process |
Use context sensitive roadway departure best practices in areas where roadway departures are a common crash cause, including the installation of high friction pavement, shoulder or centerline rumble strips, wider pavement markings (6-inch edge and centerlines), and retroreflective pavement markings. |
Municipalities |
MassDOT |
Ongoing |
Infrastructure |
1 Timeframes: Short-term: 1–3 years; Medium-term: 3–5 years; Long-term: 5+ years
Vulnerable Road Users—including pedestrians, bicyclists, individuals using wheelchairs, and those on scooters—are disproportionately affected by traffic crashes, often sustaining severe or fatal injuries due to their lack of physical protection. The MPO, through this Action Plan, is committed to creating a transportation system that prioritizes the safety and comfort of all Vulnerable Road Users, making walking, biking, and rolling safe and accessible modes of travel for everyone.
| Action |
Lead |
Support |
Timeframe1 |
Type |
|---|---|---|---|---|
Using the Regional Active Transportation Plan, prioritize closing identified gaps in the bicycle and pedestrian network aligned with the HIN and HRN. Focus on prioritizing connections to transit, schools, hospitals, and commercial centers. |
Municipalities |
Boston Region MPO/ |
Short-term |
Infrastructure |
Develop a policy requiring traffic control guidance and design to improve safety for pedestrians and cyclists traveling through municipal-project work zones, ensuring temporary facilities are safe and clear. |
Municipalities |
Boston Region MPO |
Short-term |
Policy |
Participate in the MassDOT Safe Routes to School (SRTS) program and encourage community groups, committees, or the municipality to join the Massachusetts SRTS Alliance. |
Municipalities |
Short-term |
Process |
|
Improve the safety and visibility of mid-block crosswalks with the installation of signage, high-visibility pavement markings, rapid rectangular flashing beacons (RRFBs) or HAWK signals along high-speed corridors and in proximity to priority destinations. |
Municipalities |
MassDOT |
Medium-term |
Infrastructure |
Adopt a Complete Streets policy and leverage MassDOT Complete Streets funding opportunities to prioritize and improve walking and biking infrastructure. |
Municipalities |
Medium-term |
Policy |
|
Work with Safe Routes to School to expand educational campaigns and training programs for children and adults focusing on bicyclists and pedestrian skill education, safety-related training, helmet use, etc. |
Municipalities |
Boston Region MPO |
Medium-term |
Process |
Work to implement school bus cameras to enforce the existing no passing law. |
Municipalities |
School Districts |
Long-term |
Policy |
1 Timeframes: Short-term: 1–3 years; Medium-term: 3–5 years; Long-term: 5+ years
Older adults, whether as pedestrians, drivers, or transit users, face unique challenges in the transportation system, often due to changes in vision, hearing, reaction time, or physical mobility. This Action Plan aims to create a transportation environment that is safe, accessible, and accommodating for our aging population, ensuring their continued mobility and independence. The Plan’s strategies will address both infrastructure and behavioral aspects to mitigate risks for older adults and older drivers.
Action |
Lead |
Support |
Timeframe1 |
Type |
Use crash and risk data to prioritize locations to address the safety of older adult roadway users and to target messaging campaigns. |
Boston Region MPO |
Municipalities/ |
Short-term |
Process |
Collaborate with MassDOT and the RMV to help share information and resources about safe driving for older adults, including resources from AAA, AARP, and MIT AgeLab. |
Boston Region MPO |
MassDOT/RMV |
Medium-term |
Process |
Partner with state and national organizations to educate older adults and their families about advanced vehicle safety features (e.g., blind spot monitoring, lane keeping assist, automatic emergency braking) and encourage the adoption of vehicles equipped with these technologies. |
Boston Region MPO |
Medium-term |
Process |
|
Continue to invest in research and planning that expands and improves public transit options, paratransit services, and community-based transportation programs tailored to the needs of older adults, reducing their reliance on private vehicles. |
Boston Region MPO |
Long-term |
Process |
|
Coordinate with the MBTA to facilitate "travel training" programs that help older adults learn to use public transportation safely and confidently. |
Boston Region MPO |
Municipalities/ |
Long-term |
Process |
1 Timeframes: Short-term: 1–3 years; Medium-term: 3–5 years; Long-term: 5+ years
Speed is the single most critical factor in crash severity: the faster a vehicle is traveling, the greater the kinetic energy involved in a collision, and thus, the higher the likelihood of severe injury or fatality for all road users, especially vulnerable ones. This Action Plan provides for a comprehensive approach to managing speed through infrastructure design, policy changes, and targeted enforcement, ensuring that speeds are safe and appropriate for all roadway contexts.
| Action |
Lead |
Support |
Timeframe1 |
Type |
|---|---|---|---|---|
Expand guidance and provide resources for municipalities to perform speed data collection more effectively, enabling data-driven identification of speeding hot spots and evaluation of countermeasure effectiveness. |
Boston Region MPO |
Municipalities/ |
Short-term |
Process |
Develop and disseminate public awareness materials highlighting the dangers of speeding and the direct correlation between speed and crash severity for all road users. |
Boston Region MPO |
Municipalities/ |
Short-term |
Process |
Research required speed-limiter devices for repeat and/or reckless speeding offenders. |
Boston Region MPO |
MassDOT |
Medium-term |
Process |
Help spread awareness of and implement MassDOT’s speed management guidance to collect information and analyze data, establish target speeds, design roadways for speed control and separation, set speed limits, and build a community-wide safety culture |
Boston Region MPO |
Municipalities |
Medium-term |
Process |
Provide guidance to municipalities to develop traffic calming prioritization protocols to help municipal staff communicate to colleagues and residents about when and where traffic calming interventions should be implemented. |
Boston Region MPO |
Municipalities |
Medium-term |
Process |
Review crash data on speeding related crashes and coordinate with municipalities and MassDOT to identify pilot locations for automated speed and red light safety cameras. |
Boston Region MPO |
Municipalities/ |
Medium-term |
Process |
Adopt a 25 mph speed limit in municipality-owned high-density and business districts, as authorized by Chapter 90, Section 17C of the MGL. |
Municipalities |
Short-term |
Policy |
|
Establish safety zones and school zones along municipal-owned roadway corridors to lower speed limits to 20 mph. |
Municipalities |
Short-term |
Policy |
|
Prioritize traffic calming street design changes on local and collector streets in areas at a high-risk for speeding-related crashes, such as residential neighborhoods, school zones, and commercial districts. Traffic calming interventions include road diets, raised intersections or crosswalks, speed humps, narrowing travel lanes, and gateway treatments. |
Municipalities |
MassDOT/ |
Medium-term |
Infrastructure |
1 Timeframes: Short-term: 1–3 years; Medium-term: 3–5 years; Long-term: 5+ years
Large vehicles, including commercial trucks, buses, and municipal fleets, present unique safety challenges due to their size, weight, blind spots, and longer stopping distances. Crashes involving large vehicles often result in severe outcomes, particularly for vulnerable road users. The Action Plan provides a commitment to mitigating these risks by promoting safer vehicle design, implementing robust fleet policies, and designing infrastructure that accounts for the operational characteristics of large vehicles.
| Action |
Lead |
Support |
Timeframe1 |
Type |
|---|---|---|---|---|
Develop educational materials that municipalities can use for awareness campaigns for commercial motor vehicle (CMV) drivers on how to better share the roadway and improve safety for all (e.g., Share the Road Campaigns). |
Boston Region MPO |
Municipalities/ |
Short-term |
Process |
Develop and model safe fleet transition plan for municipalities to adopt. |
Boston Region MPO |
Municipalities |
Medium-term |
Process |
Collaborate with MassDOT to promote local adoption of safety measures on large vehicles and municipal fleets according to Massachusetts Acts of 2022 Chapter 358—An Act to Reduce Fatalities, including installing side guards, backup cameras, and cross-over mirrors, as well as prohibition of hazardous aftermarket devices like bull bars and lifted suspensions. Provide guidance to municipalities on effectively incorporating these safety requirements into residential parking permit programs to encompass privately owned vehicles. |
Boston Region MPO |
MassDOT |
Medium-term |
Process |
Establish clearly defined and safely designed loading/unloading zones. |
Municipalities |
Short-term |
Process |
|
Adopt a ‘safe fleet’ policy that outlines municipal fleet owners’ commitment to safer vehicles with higher direct vision. This policy should draw on Boston's and New York City's Safe Fleet Transition Plans and should include:
|
Municipalities |
Boston Region MPO |
Medium-term |
Policy |
1 Timeframes: Short-term: 1–3 years; Medium-term: 3–5 years; Long-term: 5+ years
As noted, other road safety issues also cause death and injury on the region’s roads, and the MPO encourages its partners to continue to take action in these areas as well.
Notably, Post Crash Care is identified as an element of the Safe System Approach and a part of MassDOT’s SHSP to provide expedient access to EMS (emergency medical services) care and support the work of first responders. According to NHTSA, 40 percent of 2021 crash victims nationally were alive when first responders arrived, but later died. Thus, delivering medical care can clearly and dramatically improve crash outcomes.
The region is known for its world-class hospitals and multiple Level 1 adult and pediatric trauma centers. However, the MPO and its cities and towns can take additional steps to leverage Post Crash Care to help achieve Vision Zero:
States, communities, and other countries are pioneering many other innovative approaches to highway safety. Several emerging strategies are listed in Table 5.1 that could be considered for the Boston region.
Table 5.1 | Innovative Countermeasures and Strategies
| Issue |
Strategy/Countermeasure |
|---|---|
Intelligent Transportation Systems (ITS) |
Intelligent Transportation Systems (ITS): Encompasses a range of digital transportation infrastructure that can include a wide spectrum of use cases for connected vehicles, vehicle-to-everything (V2X) communication, and artificial intelligence. These technologies hold tremendous promise to improve safety and mobility. |
Lane Departures |
Advanced Driver-Assistance Systems (ADAS): Advanced driver-assistance systems provide real-time alerts and automated interventions to prevent lane departures. |
Roadway Departure Prevention Systems: Innovations in systems that prevent vehicles from leaving the roadway, such as haptic feedback and drive-by-wire systems, are being evaluated for their effectiveness in emergency situations. |
|
Distracted Driving |
Automated Distracted Driving Detection: New safety camera technology is available that can monitor phone use of drivers, bother for the purpose of enforcement and to better diagnose distracted driving trends. |
Impaired Driving |
Specialty OWI Courts: Massachusetts has a number of drug courts, but many states have begun leveraging DUI courts specifically to offer individualized supervision and treatment for high risk impaired driving offenders. |
Increased Drug Recognition Training: In addition to training police officers as Drug Recognition Experts (DRE), some law enforcement agencies have set goals to have all of their traffic officers certified in Advanced Roadside Impaired Driving Enforcement (ARIDE), a course offered by the Massachusetts Municipal Police Training Committee. |
6 Progress and Transparency
Achieving the Boston region’s goal of eliminating fatal and serious injury crashes by 2050 will require collaboration and sustained effort among all regional transportation safety stakeholders including: planners, road owners, maintenance, law enforcement, first responders, the public, advocacy groups, engineers, policy makers, EMS, and community-based organizations.
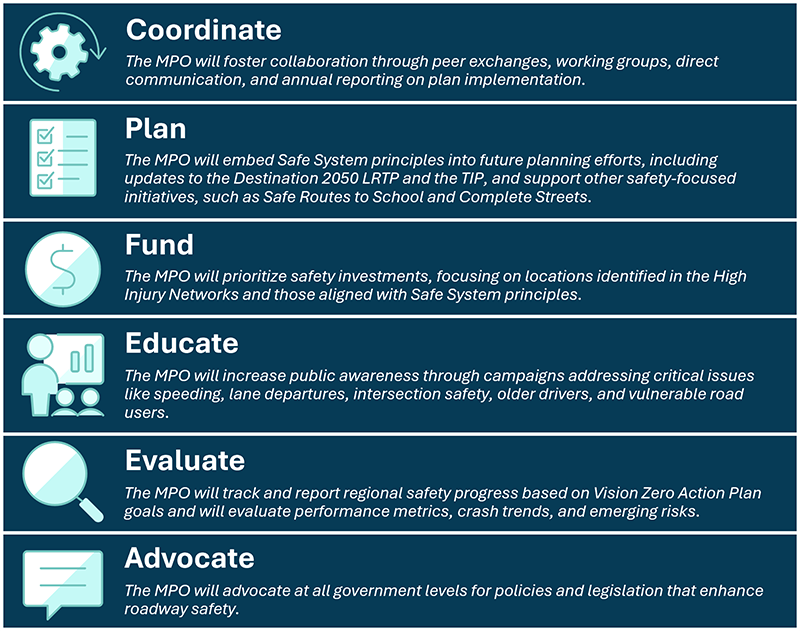
The MPO will continue to play a critical role in enhancing transportation safety by leading implementation of several Vision Zero action items to advance the region toward a Safe System.
The MPO will utilize this Action Plan (see the actions tracking table in Appendix J) to track and report regional safety progress based on Action Plan goals, using both outputs and outcomes on an annual basis. Outputs track and report on the progress of the MPO in supporting, promoting, and leading safety initiatives, programs, policies, plans, and projects. Outcomes evaluate the effectiveness of safety programs and investments in reducing crash frequency and severity, and evaluation findings are used to strengthen successful strategies and revise or discontinue ineffective ones.
The MPO will track performance annually through quantitative analysis of the performance metrics listed in Table 6.1 and Table 6.2. While similar metrics are tracked statewide in the SHSP, these metrics will be tracked specifically for the Boston region and publicly reported by the MPO.
Table 6.1 | Vision Zero Action Plan Performance Metrics (All Roads)
Metric |
Baseline (5 Year Average 2018–2022) |
Year 1—Annual Number |
Year 1—Rolling 5-year Average |
Number of Fatal Crashes in Boston MPO region |
113 |
|
|
Number of Fatalities |
117 |
|
|
Rate of Fatal Crashes (per 100,000 population) |
3.43 |
|
|
Number of Serious Injury Crashes |
841 |
|
|
Number of Serious Injuries |
966 |
|
|
Rate of Serious Injury Crashes (per 100,000 population) |
25.52 |
|
|
Table 6.2 | Vision Zero Action Plan Performance Metrics (Interstates, Expressways, Other Fully Access-Controlled Roads, and Ramps)
Metric |
Baseline (5 Year Average 2018–2022) |
Year 1—Annual Number |
Year 1—Rolling 5-year Average |
Percent Change in Fatal and Serious Injury (FSI) Crashes Involving Large Trucks |
4% |
|
|
Percent Change in FSI Crashes Involving Older Drivers |
5% |
|
|
Percent Change in FSI Crashes Involving Speeding |
18% |
|
|
Percent Change in FSI Crashes Involving Intersections |
1% |
|
|
Percent Change in FSI Crashes Involving Lane Departure |
9% |
|
|
Percent Change in FSI Crashes Involving Vulnerable Road Users |
3% |
|
|
7 Next Steps
The Boston Region Vision Zero Action Plan represents a critical step forward in our commitment to eliminating traffic fatalities and serious injuries by 2050. Through a thorough analysis of crash data, extensive public and stakeholder engagement, and a deep dive into policy and infrastructure, we identified key areas of concern such as intersections, lane departures, and the heightened vulnerability of pedestrians and cyclists. This Action Plan is a regional roadmap built on the Safe System Approach, recognizing that human error is inevitable and that our transportation system must be designed with multiple layers of protection to ensure everyone's safety.
Moving forward, the success of this Vision Zero Action Plan hinges on sustained collaboration and proactive implementation. The MPO will continue to play a central role in coordinating efforts, embedding Safe System principles into future planning, and prioritizing investments in high-risk areas. We will also focus on educating the public, evaluating our progress against clear performance metrics, and researching and providing information to stakeholders about necessary legislative changes. This plan provides a regional framework, but its impact will be measured by the collective actions taken by all stakeholders—from state agencies and municipalities to community organizations and individual road users.Achieving Vision Zero is a shared responsibility, demanding a unified commitment from everyone who uses and shapes our roadways. We urge all stakeholders to actively engage with the strategies and countermeasures outlined in this plan. By working together, leveraging the identified data, and adopting the Safe System Approach, we can transform our streets into safer, more equitable spaces for all. Your active participation is not just encouraged, it is essential to reach Vision Zero in the Boston Region.
Boston Region Vision Zero Action Plan:
A Roadmap to Safer Streets
For more information, visit our website! Achieving Vision Zero is a shared responsibility, demanding a unified commitment from everyone who uses and shapes our roadways. We urge all stakeholders to actively engage with the strategies and countermeasures outlined in this plan. By working together, leveraging the identified data, and adopting the Safe System Approach, we can transform our streets into safer, more equitable spaces for all. Your active participation is not just encouraged, it is essential to reach Vision Zero in the Boston Region.
1 The summaries in this section do not include crashes along Interstates, expressways, other fully access-controlled roadways, or ramps unless otherwise noted.
2 Massachusetts Highway Safety Improvement Program, MassDOT. Source: https://www.mass.gov/info-details/highway-safety-improvement-program.
3 To demonstrate locations in a variety of municipalities in each region, a maximum of two locations from each municipality are included in these lists. There may be more than two high-scoring locations in each municipality.