
This document is draft and has not gone through the internal editorial review process.
Appendix F: Stakeholder Engagement Approach and Findings
Table of Contents
1. Engagement Activities Overview
How Engagement Informs the Vision Zero Action Plan
Reaching Stakeholders throughout the Region
Roadway Design and Maintenance
3. Outcomes and Takeaways by Engagement Activity
Vision Zero Task Force Takeaways
Municipal Virtual Office Hours
High Injury Network Municipal Virtual Office Hours
Policy Interviews with Municipalities and State Agencies
Policy Interviews with Municipalities
Policy Interviews with State Agencies.
Public Focus Groups and Roundtables
Older Adults (Ages 65 and Above)/Aging Services Access Point Staff
Municipal Law Enforcement Roundtable
Municipal Departments of Public Works and Planning Roundtable
Appendix A. Municipalities Engaged
Appendix B. Municipal Survey Summary
Appendix C. Public Survey Summary
Appendix D. Safety Concerns Map Summary
Appendix E. January 2025 Public Forum Summary
List of Tables
Table 1.1 | List of Engagement Activities and Tools
Table 1.2 | Participants by Activity
Table 3.1 | Vision Zero Task Force and Subcommittee Meeting Dates
Table 3.2 | Task Force Takeaways
Table 3.3 | Policy Interview Stakeholders and Dates
Table 3.4 | Key Takeaways from Interview with Municipalities
Table 3.5 | Key Takeaways from Interviews with State Agencies
Table A.1 | Municipality Engagement by Activity
Table B.1 | Community Priorities and Challenges
Table C.1 | Number of Responses per Language
Table C.2 | Demographic Question—How many people are in your household?
Table C.3 | Demographic Question—How do you self-identify by race and/or ethnicity?
Table C.4 | Demographic Question—Do you have a disability?
Table C.5 | Demographic Question—What is your age?
Table C.6 | Demographic Question—How do you identify by gender?
Table C.7 | Question—How many vehicles are kept at home for you and your household to use?
Table C.8 | How Respondents Travel Through the Region
Table C.9 | Average Rating of Top Road Safety Concerns on a Scale from One to Six
Table C.10 | Number of Write-in Comments Received by Municipality
Table D.1 | Distribution of Submissions by Mode
Table D.2 | Safety Challenges Identified (Number and Percentage Share) by Mode
Table D.3 | Number of Submissions by MPO Subregion
Table D.4 | Number of Submissions by Municipality
Table D.5 | Number of Submissions with Suggestions for Improvement
Table D.6 | Safety Challenges Identified (Number and Percentage Share) by Mode—Inner Core Committee
List of Figures
Figure 3.1 | Map of Municipal Survey Respondents.
Figure 3.2 | Map of Number of Responses by Respondents’ Home Zip Codes within the Boston MPO Region
Figure 3.3 | Image of Responses Tracked on the Interactive Map
Figure B.1 | Map of Responses Recorded in the Boston MPO Region
Figure B.2 | Rating of Infrastructure Concerns of Highest Priority (Question 7)
Figure B.3 | Rating of Driver Behavior Concerns of Highest Priority (Question 8)
Figure B.4 | Rating of Challenges Faced by Municipalities (Question 11)
Figure C.1 | Map of Number of Responses by Respondents’ Home Zip Codes within the Boston MPO Region
Figure C.2 | Feeling of Safety by Mode of Travel
Figure C.3 | Issues Preventing Walking, Bicycling, or Taking Transit More Often
Figure D.1 | Image of Responses Tracked by the Interactive Map
Figure D.2 | Map of Boston region MPO Subregions and Municipalities
The Boston Region Metropolitan Planning Organization (MPO) Vision Zero Action Plan provides a roadmap for the region to eliminate all fatalities and serious injuries on its roadways. Stakeholder and public engagement were a critical part of the planning process to ensure that the vision represented the people who live and work in the region.
This summary report describes engagement activities during development of the Vision Zero Action Plan. This first chapter describes how engagement informs the Plan, what communication tools were used, how and when engagement occurred, and who shared input during the process.
Chapter 2 highlights the key takeaways across all engagement efforts. These takeaways span perceptions about traffic safety culture, driver behaviors, roadway geometry and design, and policy and process changes.
Chapter 3 describes each engagement activity’s purpose, approach, participants, and key takeaways that guided and informed development of the Vision Zero Action Plan.
Lastly, this summary report includes four appendices with more in-depth summaries of key engagement activities. Appendix A lists which municipalities contributed through various engagement approaches. Appendix B provides a summary of the municipal survey distributed in fall 2024. Appendix C summarizes input shared during the public survey between October 2024 and February 2025. Appendix D highlights key safety concerns identified by respondents across the region and MPO subregions, as shared in an online comment webpage between October 2024 and April 2025. Appendix E captures discussion from the January 2025 virtual public forum.
Engagement is crucial to develop a successful comprehensive safety action plan that directly addresses the region’s transportation safety challenges. By engaging both transportation safety stakeholders and members of the public, the Boston Region MPO was able to uncover the region’s biggest safety concerns and identify where the Vision Zero Action Plan should focus its efforts. Engagement activities also identified potential and preferred solutions that can make the Boston Region’s streets safer for all people who drive, walk, bike, roll, ride, and take transit.
Task Force member participation informed several essential sections of the Vision Zero Action Plan development, guiding public and stakeholder engagement, safety analysis, policy and process review, and selection of strategies and countermeasures for implementation. Additionally, combined feedback from the Task Force and municipalities helped refine and finalize the Boston region’s High Injury Network (HIN).
The Boston Region MPO also incorporated public engagement findings into the safety analysis, building upon existing conditions data to conduct a comprehensive analyses of systemic and site-specific roadway challenges. This information was valuable to focus efforts on selecting high injury or high-risk locations, identifying appropriate strategies and countermeasures, and informing policy recommendations to reduce traffic fatalities and serious injuries.
The project team leveraged a diverse range of communication tools to share updates about the project, collect input, and invite stakeholders to participate in the plan development process. Tools included a publicly available project website, email updates to an email distribution list that members of the public could sign up for, social media posts, a Community Partners Toolkit, and the Vision Zero email newsletter.
The Boston Region Vision Zero website was published at www.bostonmpovisionzero.com in August of 2024. The website contained pages that gave an overview of the MPO, the project itself, Vision Zero as a concept, and an overview of the Task Force. It also contains pages that shared information about safety analysis and contained documents and reports to share updated project information with the public. The Safety Concerns Map had its own page directly embedded into the website. The website was consistently updated with flyers and data, up-to-date surveys, and a contact form as the project progressed so that the public could easily contact the project team.
As of May 12, 2025, the website has received a total of 2,529 visits with the peak number of visitors around the announcement and kickoff of the project in October 2024 and a second peak in December 2024 and January 2025 prior to the Virtual Public Forum. The most visited page after the Home page was the page detailing “What is the Boston Region Vision Zero Action Plan?” and the “We Want to Hear from You” page.
As part of this project, the Boston Region Vision Zero team developed a database that included existing Boston Region MPO contacts as well as other stakeholders identified early in the process. These contacts were imported into an email marketing tool (MailChimp) and a direct sign-up link to the tool was available on the project website. In addition, the link to sign-up was shared via online surveys, public meeting discussions, and other channels. As of May 12, there are 3,416 subscribers.
There were three distribution lists as part of this mailing list—a general one for all subscribers, one for municipal staff (DPW/Planning, etc.), and one for law enforcement contacts.
Throughout the project, the project team shared regular updates with the email distribution list, including announcement of the website and online survey, the public meeting (including availability of materials after the meeting), and invitations to key events like the municipal roundtables. A total of eight emails with invitations and reminders were sent regarding different events throughout the project. Additionally, direct invitations were sent for Aging Service Access Point (ASAP), Adults with Disabilities, and Chambers of Commerce Roundtables.
The Community Partners Toolkit included information for Community Based Organizations (CBO) in the Boston Region to help the project team spread awareness about the Plan and capitalize on existing relationships the CBOs have with their audiences. The Toolkit included a variety of messaging in “ready to share” format for the CBOs to easily post in their channels, all available in one Google Drive folder.
The distribution list for the Community Partners Toolkit included 75 CBOs in the MPO region covering a range of audiences, including bicycle and pedestrian advocacy groups, disability advocacy groups, public health, environmental justice advocates, and seniors. There were two versions of the Toolkit, as described below.
The MPO distributed the first version of the Community Partners Toolkit via email on December 11, 2024, and again on January 10, 2025.
The first version of the Toolkit was developed with the following goals:
The MPO distributed the Community Partners Toolkit second version via email on January 23, 2025. The Community Partners Toolkit Version 2 included updated information for CBOs to easily distribute to their audiences. The second version of the Toolkit was developed with the following goals:
In addition to email updates, the project team used the email marketing platform to send out regular Boston Region MPO newsletters to the Vision Zero stakeholder list. All newsletters were distributed via the MPO’s Vision Zero email newsletter to a total of 3,375 project stakeholders from each of the region’s 97 municipalities.
The MPO sent seven Vision Zero newsletters in May, July, September, November, and December of 2024, and in January and May of 2025. Two additional announcement emails were sent to the same distribution list about the project kickoff in October 2024 and about materials available to review after the virtual public forum in February 2025.
Throughout the Vision Zero planning process, the project team used multiple methods of communication to solicit feedback directly from the region’s community members, municipal agency staff, law enforcement, first responders, CBOs, and many others.
Engagement activities included meetings, online surveys for multiple audiences, focus groups, roundtables, and public meetings. Activities primarily occurred between October 2024 and May 2025.
The Vision Zero Task Force was established to bring perspectives from municipalities; school systems; pedestrian, bike, accessibility, and public health organizations; and state and Federal transportation agencies. In addition to the full Task Force, the MPO also designated three Subcommittees focused on safety analysis, engagement, and policy. Task Force members include:
| Name |
Affiliation |
|---|---|
Daniel Albert |
Resident of Marblehead |
Ari Belathar |
Former Executive Director, Boston Cyclists Union |
Kristopher Carter |
Chief Possibility Officer, Massachusetts Department of Transportation |
Jacqueline DeWolfe |
Director of Mobility Policy and Program Development |
Alex Epstein |
Resident of Somerville |
Charlotte Fleetwood |
Senior Transportation Planner, Boston Transportation Department |
JR Frey |
Town Engineer, Town of Hingham |
James Fuccione |
Executive Director, Massachusetts Healthy Aging Collaborative |
Catherine Gleason |
Public Policy Manager, Liveable Streets Alliance |
Tina Hein |
Vice Chair Select Board, Town of Holliston; Massachusetts Safe Routes of School Outreach Coordinator |
Brendan Kearney |
Co-Executive Director, WalkMassachusetts |
Jeremy Marsette |
Town Administrator, Town of Sherborn |
Galen Mook |
Executive Director, MassBike |
Shavel’le Oliver |
Executive Director, Mattapan Food and Fitness Coalition |
Kathryn Quigley |
Deputy Director of Strategic Planning, MBTA Systemwide Accessibility |
Brad Rawson |
Director, Mobility Division, City of Somerville |
Katarina Torres Radisic |
Riders Transportation Access Group (RTAG) |
Ryan Williams |
Resident of Melrose |
Stephen Winslow |
City Councilor, City of Malden |
Task Force member participation informed several essential sections of the Action Plan’s development, guiding public and stakeholder engagement, the safety analysis, policy and process review, and selection of strategies and countermeasures for implementation. Additionally, combined feedback from the Task Force and municipalities helped refine and finalize this project’s HIN.
The Boston Region MPO is responsible for conducting the federally required metropolitan transportation planning process for the Boston metropolitan area. The MPO encompasses 97 cities and towns, covering approximately 1,360 square miles and stretching from Boston to Ipswich in the north, Marshfield in the south, and to approximately Interstate 495 in the west. Cooperatively selecting transportation programs and projects for funding is a role of the MPO’s 23 voting members, which includes state agencies, regional entities, and municipalities. The work of the MPO is performed by the Central Transportation Planning Staff under the direction of the MPO Board. The MPO is composed of:
A full list of activities and the dates they were held are listed in Table 1.1 below. Detailed information about each activity can be found in Chapter 3.
Table 1.1 | List of Engagement Activities and Tools
| Engagement Activity |
Dates Completed |
Distribution/Advertisement |
Purpose |
|---|---|---|---|
Vision Zero Task Force (virtual meetings) |
February 13, 2024 October 2, 2024 October 9, 2024 December 16, 2024 December 19, 2024 February 3, 2025 May 2, 2025 June 16, 2025 |
Task Force members were invited to each virtual meeting. |
Provide input and guidance about the development of the Vision Zero Action Plan, including meetings with safety analysis, engagement, and policy subcommittees. |
Project Website1 |
Launched: August 2024 Available throughout project duration |
Distributed in virtual meetings and in Vision Zero email newsletters; publicly available online at www.bostonmpovisionzero.com. |
Share general information and updates about the project. |
Vision Zero email newsletter and email updates1 |
May 2024 July 2024 September 2024 October 2024 November 2024 December 2024 January 2025 February 2025 May 2025 |
Distributed via email marketing platform to the Vision Zero stakeholders list, reaching a total of 3,375 project stakeholders. |
Share announcements and updates about plan development with stakeholders, including opportunities to provide input. |
Municipal Survey |
Opened: September 24, 2024 Closed: Friday, October 4, 2024 |
Link sent via email to 331 contacts across 97 municipalities, including Directors of Department of Public Works, Town Engineers, Planners, and other municipal staff. |
Collect input from municipal staff about transportation safety issues, challenges to improving safety, and priorities. Paired with municipal virtual office hours. |
Municipal Virtual Office Hours |
September 25, 2024, 11:00 AM |
Meeting invitation sent via email to 331 contacts across 97 municipalities, including Directors of Department of Public Works, Town Engineers, Planners, and other municipal staff. |
Collect input from municipal staff about transportation safety issues, challenges to improving safety, and priorities. Paired with municipal survey. |
Public Survey |
Opened: October 17, 2024 Closed: February 14, 2025 |
Link distributed via the MPO Vision Zero email newsletter to a total of 3,375 project stakeholders; shared via MPO social media channels; included in Community Partners Toolkit; posted on project website; shared in January 2025 virtual public forum. Available in seven languages (English, Spanish, Brazilian Portuguese, Vietnamese, Traditional Chinese, Simplified Chinese, and Haitian Creole). |
Collect input from members of the general public about perceived transportation safety concerns and desired solutions. |
Safety Concerns Comment Map |
Opened: October 17, 2024 |
Link distributed via the MPO Vision Zero email newsletter to a total of 3,375 project stakeholders; included in Community Partners Toolkit; posted on project website; shared in January 2025 virtual public forum. Available in seven languages (English, Spanish, Brazilian Portuguese, Vietnamese, Traditional Chinese, Simplified Chinese, and Haitian Creole). |
Collect input from members of the public about perceived transportation safety concerns and desired solutions at specific locations throughout the region. |
Policy Interviews with Municipalities and State Agencies (virtual) |
November 2024—May 2025 (13 interviews) |
Interviewees were contacted directly via email and phone call. |
Identify policies and processes that might be missing, that inhibit safety or need additional resources to implement successfully. |
Community Partners Toolkit1 |
Version 1: December 11, 2024 Version 2: January 23, 2025 |
Distributed via email to contacts at 75 community-based organizations throughout the Boston region, covering a range of audiences, including bicycle and pedestrian advocacy groups, disability advocacy groups, public health, environmental justice, and seniors. |
Provide information and resources that community-based organizations could distribute to their members about plan development. |
Virtual Public Forum |
January 29, 2025, 6:00 PM |
Invitation distributed via the MPO Vision Zero email newsletter to a total of 3,377 project stakeholders; promoted in Community Partners Toolkit; flyers posted on project website in seven languages (English, Spanish, Brazilian Portuguese, Vietnamese, Traditional Chinese, Simplified Chinese, and Haitian Creole); meeting held via Zoom. |
Present overview and purpose of Vision Zero Action Plan and region’s safety data; learn about public’s perspectives on safety challenges, concerns, and solutions. |
High Injury Network Municipal Virtual Office Hours |
March 3 and March 6, 2025 |
Meeting invitation sent via email to 331 contacts across 97 municipalities, including Directors of Department of Public Works, Town Engineers, Planners, and other municipal staff. |
Discuss the draft High Injury Network and High Risk Network methodology and maps. |
Focus Group—Adults with Disabilities (virtual) |
April 14, 2025, 5:30 PM |
Promotional flyer shared with 83 organizations in the region that work with adults with disabilities or in transportation safety; participants received a $100 gift card for their time. |
Understand how stakeholders with disabilities that impact their mobility travel and maneuver safely around the region. |
Roundtable—Aging Services Access Point and follow-up Older Adults Survey (virtual) |
April 16, 2025, 2:00 PM |
Invitation to roundtable emailed to Aging Services Access Point (ASAP) providers. Survey shared with ASAP staff to distribute to older adults who use ASAP services. |
Understand how older adults travel and their perceptions about traffic safety challenges and needs in the region. |
Roundtable—Chambers of Commerce (virtual) |
April 17, 2025, 2:00 PM |
Invitation to roundtable emailed to 24 regional Chamber of Commerce representatives within Boston region. |
Understand the business community’s perceptions of safety challenges and efforts to improve safety. |
Municipal Roundtable—Law Enforcement (virtual) |
May 8, 2025, 10:00 AM |
Invitation sent via email and phone call to local law enforcement agencies across all 97 municipalities. |
Discuss potential solutions and strategies to address identified safety issues, from an enforcement perspective. |
Municipal Roundtable—Departments of Public Works and Planning (virtual) |
May 9, 2025, 10:00 AM |
Invitation sent via email to 165 contacts across 97 municipalities, targeting Directors of Department of Public Works, Town Engineers, Planners, and other municipal staff. |
Discuss potential solutions and strategies to address identified safety issues, from a municipal perspective. |
Across all activities, participants, respondents, and attendees included members of the general public, municipal planners and engineers, municipal law enforcement officers, other municipal staff, individuals with disabilities, Aging Service Access Point staff, Chambers of Commerce staff, and members of community-based and advocacy organizations. Table 1.2 below provides an overview of the participants for each engagement activity, as well as the intended audience or type of attendee for each activity/tool over the course of the project.
Table 1.2 | Participants by Activity
| Engagement Activity |
Number of Attendees/Respondents |
Type of Attendee/Audience |
|---|---|---|
Task Force |
18 members |
Representation from multiple levels of municipal leadership; advocates for walking, biking, schools, and accessibility; and state and Federal partners |
Project Website |
Not applicable |
General public |
Community Partners Toolkit |
Not applicable |
75 CBOs in the Region |
Municipal Survey |
36 submissions |
Planners, City Councilors, Public Works staff, Town Engineers, Housing and Economic Development Staff |
Municipal Virtual Office Hours |
6 attendees |
Planners, City Councilors, DPW directors, Town Engineers, Transportation Planners, Housing and Economic Development Staff |
Public Survey |
761 submissions |
General public |
Safety Concerns Comment Map |
921 submissions |
General public |
Virtual Public Forum |
37 attendees |
General public |
High Injury Network Municipal Virtual Office Hours |
14 on March 2, 8 on March 6 |
Municipal Planners, Public Works Directors, Town Engineers, Law Enforcement |
Policy Interviews with Municipalities |
13 interviews |
Municipal Planners, Public Works Directors, Town Engineers; Massachusetts Department of Conservation and Recreation; Massachusetts Executive Office of Public Safety and Security Office of Grants and Research |
Focus Group—Adults with Disabilities |
8 attendees |
Adults with Disabilities in the Boston region |
Aging Services Access Point Providers Roundtable and follow-up Older Adults Survey |
7 attendees (Discussion) and 2 submissions (Survey) |
ASAP Directors and Staff |
Discussion on Roadway Safety—Chambers of Commerce |
3 attendees; 1 follow‑up conversation |
Chambers of Commerce Staff |
Municipal Roundtable—Law Enforcement |
5 attendees |
Municipal Law Enforcement |
Municipal Roundtable—Departments of Public Works and Planning |
7 attendees; 1 follow‑up conversation |
Municipal Planners and DPW Staff |
This section summarizes key findings and takeaways at a high-level across all engagement efforts.
People shared their mistrust of other road users—people do not trust others to make the safest decisions on the road. For example, pedestrians do not trust drivers to stop for them at intersections or crosswalks; drivers do not trust other drivers to drive unimpaired or distraction-free; and bicyclists do not trust that drivers will give them enough space or keep bicycle lanes free of barriers (such as parked cars). Across all engagement activities, commonly reported driver behavior concerns included speeding; distracted driving; aggressive and reckless driving; drivers passing too close to people bicycling, walking, or rolling; and red-light running.
Roadway design, geometry, and infrastructure conditions play key roles in people’s travel patterns and mode choices. Roadway designs that allow vehicles to travel at high speeds may discourage awareness of pedestrians and bicyclists; this may make people more likely to choose to travel via vehicle since they feel unsafe biking or walking. At the same time, some motor vehicle drivers feel unsafe while driving due to confusing roadway geometry, coupled with speeding and aggressive driving behaviors by other drivers. Across all engagement activities, commonly reported infrastructure concerns included poor or missing sidewalks, crosswalks, and bike lanes; roadway design that feel unsafe; lack of visibility at intersections; and poor drainage (e.g., ice, snow, or water on the roads or sidewalks).
Roadway design dictates how people drive, walk, bike, roll, and more. Changing the geometry of the road is an essential method to change road user behavior, especially dangerous driving behaviors such as speeding, running red lights, driving aggressively, or using a phone while driving. Self-enforcing and self-educating roadway design helps road users understand how they should interact with the environment. Safety improvements can slow vehicle speeds by visually or physically narrowing travel lanes or create physical separation between vehicles and vulnerable road users. However, as we heard from stakeholders, there are challenges with limited right of way. Often sidewalks and bike lanes cannot be widened without repurposing current parking areas which may be unpopular with business owners and motorists. This approach is also very costly and requires extensive interdepartmental coordination.
There is a need to implement systemic improvements across the transportation network to improve safety, including: wider and well-maintained sidewalks in good pavement condition; more bike lanes and increased connectivity of a robust bicycle network; highly-visible and well-maintained crosswalks; timely snow clearing and winter weather maintenance; improved lighting; lower speed limits and vehicle speeds; traffic calming; and Complete Streets design that consider all users.
Policies and processes determine what safety priorities people and organizations will focus on, as well as how, when, and who can select, implement, and evaluate safety solutions. While the Commonwealth and Region have many proactive and supportive safety policies and processes, stakeholders identified several policy changes still needed.
Policy suggestions include allowing automated enforcement for speeding, work zones, red light running, and moving and parking violations in bus lanes and bike lanes; extending driver education curriculum and licensing requirements; protections for and education about vulnerable road users; taxes and fees for large vehicles; speed management guidance and implementation; and multimodal path use. Leading and supporting organizations for policy changes include the Boston Region MPO, municipalities, Massachusetts Department of Transportation (MassDOT), the Massachusetts General Court, and advocacy and non-profit organizations.
Many municipal stakeholders, including planners, public works staff, and enforcement officers, identified a lack of funding as a critical challenge to roadway safety. This sentiment was expressed across many engagement activities, including the municipal survey, virtual office hours, interviews, and roundtables. While quick-build, low-cost improvements can improve safety outcomes in some cases, many proven safety countermeasures are resource- and time-intensive. Staff capacity can also be a challenge, especially for smaller municipal departments with many shared responsibilities.
The following sections describe the purpose of each engagement activity, the engagement approach, and key takeaways that guided and informed development of the Vision Zero Action Plan.
The Vision Zero Task Force’s role was to advise the Boston Region MPO in creating a Vision Zero Action Plan based on a robust data framework and public engagement, while identifying priorities, strategies, and projects paired with goals, accountability, and progress reporting. Task Force input is key to shaping an action plan that shifts the region away from the status quo. Vision Zero Task Force members brought perspectives from municipalities; school systems; pedestrian, bike, accessibility, and public health organizations; and state and Federal transportation agencies.
In addition to the full Vision Zero Task Force, the Boston Region MPO also designated three Vision Zero Task Force subcommittees focused on safety analysis, engagement, and policy. The Task Force and subcommittees met seven times throughout plan development, as shown in Table 3.1 below.
Table 3.1 | Vision Zero Task Force and Subcommittee Meeting Dates
| Group |
Meeting Date |
|---|---|
Task Force |
February 13, 2024 |
Safety analysis subcommittee |
October 2, 2024 |
Engagement subcommittee |
October 9, 2024 |
Policy and process subcommittee |
December 16, 2024 |
Safety analysis subcommittee |
December 19, 2024 |
Task Force |
February 3, 2025 |
Task Force |
May 2, 2025 |
Task Force |
June 16, 2025 |
The following subsections describe key discussions and decision-making for the Task Force and its subcommittees guiding the development of the Vision Zero Action Plan.
The Vision Zero Task Force meetings yielded valuable input to the Vision Zero Action Plan. These discussions allowed members to examine potential challenges to development and implementation of a Vision Zero Action Plan, identify opportunities that will come with the Action Plan, and catalogue what tools and resources municipalities will need to help implement the Action Plan. Key takeaways from Task Force engagement efforts are described in Table 3.2.
Table 3.2 | Task Force Takeaways
| Challenges to Development and Implementation of a Vision Zero Action Plan |
Opportunities that Come with Implementation of a Vision Zero Action Plan |
Resources and Tools Needed by Municipalities for Action Plan Implementation |
|---|---|---|
A shift in traffic safety culture is needed to change the current car-centric mentality with one where all users of the transportation system can travel safety. |
Spreading awareness of available resources and best practices. |
Access to GIS tools for identifying the high injury and high-risk areas within their communities. |
The 97 municipalities in the Region have great differences in staff and funding resources, capacity for projects, and available funding. |
Breaking down silos to better coordinate future investments and connect funding to the achievement of safety performance metrics. |
Technical assistance to identify and prioritize projects. |
There may be competing priorities for resources throughout the Region. |
Engaging transportation users across all modes to create partnerships between levels of government, advocacy organizations, and concerned citizens. |
Grant writing assistance to pursue additional funding streams. |
Advancing safety countermeasures that require legislative change, such as the use of automated enforcement technologies and regulation of e-bike/delivery scooters, will be difficult to achieve. A collective approach will be needed not just for getting laws passed but also for making sure those laws are enforceable. |
Ensuring that traffic safety priorities are based on data-driven methodologies and represent all users of the transportation system. |
A variety of tools for engaging the public as well as local officials, such as surveys; peer exchanges between communities of similar size and community type. |
The Vision Zero Task Force Safety Analysis Subcommittee met twice, on October 2 and December 19, 2024. The purpose of the Safety Analysis Subcommittee was to provide input on the High Injury Network (HIN) approach and outcomes. The HIN helps municipalities to focus their limited resources on the most dangerous streets.
The Safety Analysis Subcommittee identified factors to potentially include in the Boston region’s HIN, including vehicle type; vulnerable populations; age of person injured; user type; vehicle maneuver; underserved communities; crash type; mode of person injured; hospital data; vehicle type; household status; lighting condition; and time of day. Members also discussed proposed methodology approaches, such as:
The Vision Zero Task Force Engagement Subcommittee met on October 9, 2024. Subcommittee members identified engagement goals and preferred outcomes. The goal of engagement should be to listen to community members’ needs and establish trust. Engagement should ensure the project reaches a wide, inclusive, and representative variety of community members, including road users who may be vulnerable or disadvantaged, disabled, young, and older. The project should promote access to active, healthy, and reliable transportation options for all road users.
Engagement activities should strive to meet people where they are, such as attending community events and engaging with existing community groups. A variety of in-person and virtual methods should be used to ensure accessibility for everyone who wants to participate. Importantly, engagement should focus on listening to people, rather than talking or presenting. Partnering with community-based organizations can extend outreach efforts, by providing these organizations with resources and allowing them to lead engagement within their own communities.
The Vision Zero Task Force Policy and Process Subcommittee met on December 16, 2024 to help identify roadway safety challenges that may be solved through policy changes, such as changes to driver education curriculum and licensing requirements, taxes and fees for large vehicles, and improvements to protections for vulnerable road users. One challenge identified was a lack of understanding or interest by “implementers.” Another related challenge included struggles to gain political and public support for countermeasure implementation. From this discussion, a Task Force member suggested that the Vision Zero Action Plan could include a strategy to define a uniform approach to addressing safety issues based on best practices.
In September 2024, the project team sought to gain a better understanding of transportation safety issues at a municipal level in the Boston region. To accomplish this, the team developed an online survey for municipal staff, which was paired with municipal virtual office hours. Staff members could either participate in the office hours, complete the survey, or do both.
The purpose of the municipal survey was to gather transportation safety concerns and successes from municipal leaders to better understand the challenges faced in making progress toward safer streets. It’s important to note that the municipal survey was created separately from a public survey (which was distributed several weeks later) to get a more precise response from municipal staff, specifically planners, engineers, Public Works employees, and those directly involved with the planning, maintenance, and oversight of the region’s local transportation systems. This feedback from local experts is critical to supplement other information sources, such as crash data and public input.
The municipal survey was distributed via email to a total of 331 contacts across the 97 municipalities in the region, including Directors of Department of Public Works, Town Engineers, Planners, and other municipal staff. The survey opened for responses on September 24, 2024 and closed October 4, 2024.
The survey contained 15 questions, including information regarding the following topics:
The survey received responses from 36 municipalities in the Boston Region (Figure 3.1). The types of respondents from each community contained municipal workers from several departments, including mostly Directors of Planning, City Councilors, DPW directors, Town Engineers, Transportation Planners, and Housing and Economic Development Staff.
Figure 3.1 | Map of Municipal Survey Respondents
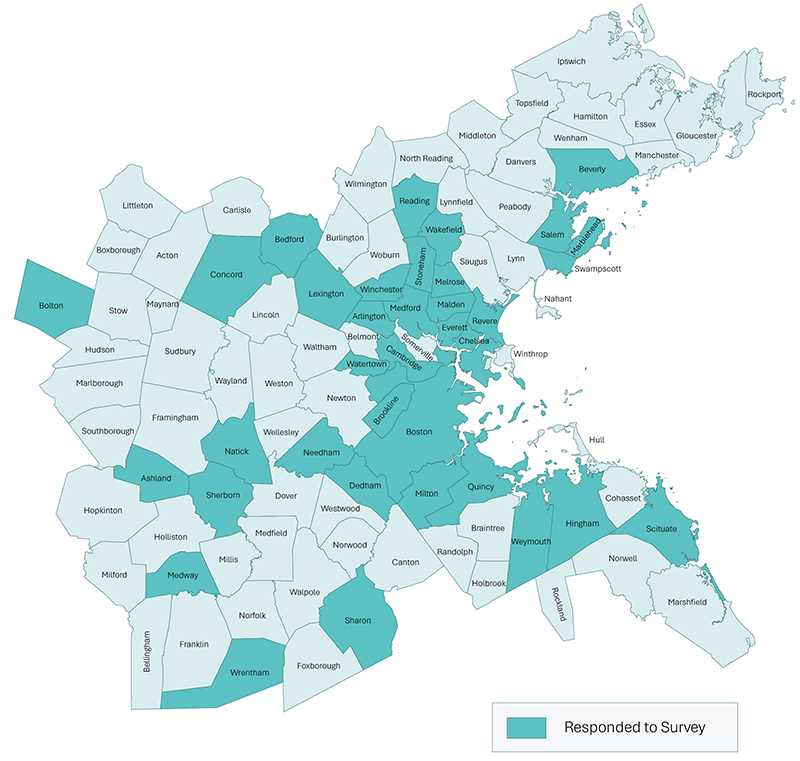
The survey results clearly indicate that within all communities, the infrastructure concerns with the highest degree of priority (those rated as “Essential”) were poor/missing sidewalks, poor/missing crosswalks, poor/missing bike lanes, and poor drainage (ice/snow/water on the road/sidewalks). Respondents also rated speeding and distracted driving as their high priority concerns related to driver behavior. Additionally, the option consistently rated as a “Serious Challenge” was the lack of funding for capital improvement projects (CIP) or other roadway safety programs.
The combined high priority for speeding, distracted driving, and lack of pedestrian and cycling infrastructure directly reflect the purpose of the Vision Zero Action Plan. These insights helped to identify the nexus between infrastructure, policy gaps, and driver behaviors to inform the development of solutions to improve regional traffic safety.
The municipal survey results also guided the Vision Zero Plan forward in regard to municipal outreach and areas of concern for focus. Helping to identify what municipalities are concerned about and struggling with at an organizational level, paired with the results from the public survey guided the intention and focus of the Vision Zero Plan to ensure the most prominent issues in the Boston region are addressed head-on.
A more in-depth summary of the municipal survey findings is provided in Appendix B of this document.
Municipal virtual office hours, held on September 25, 2024, supplemented the municipal survey. . Staff members were invited to either participate in the office hours meeting complete the survey, or do both. The office hours allowed the MPO’s municipal and Transportation Improvement Program (TIP) contacts an opportunity to ask questions about the Vision Zero Action Plan in an informal setting, and for the MPO to learn more about transportation challenges or current projects from attendees.
The municipal virtual offices hours invitation was distributed via email to a total of 331 contacts across the 97 municipalities in the region, including Directors of Department of Public Works, Town Engineers, Planners, and other municipal staff. The project team began the office hours with a presentation about the Vision Zero Action Plan and then opened up the meeting for discussion. Attendees could come and go throughout the office hours. Attendees included representatives from the Town of Marblehead, Town of Acton, Town of Natick, Town of Sharon, and the Town of Arlington.
When asked about the biggest constraints faced in implementing safety improvements to roadways, the attendees identified that funding is one of the biggest constraints; there is a lack of personnel/staff resources; and there is difficulty getting public buy-in.
When asked how the Boston Region MPO can support the municipalities, attendees stated it would be helpful to receive a guide on how to get public buy-in and leadership buy-in and support, and attendees asked to receive guidance on how to prioritize corridors and projects. Attendees also expressed their interest in SS4A demonstration grant opportunities.
How the MPO Can Help
The Boston Region MPO can serve as a clearinghouse for safety countermeasures, best practices, and information by:
In October 2024, the project team distributed a survey to better understand the public transportation safety concerns in the 97 communities represented by the Boston Region MPO. The survey was distributed via the MPO’s Vision Zero email newsletter to a total of 3,375 project stakeholders across the region’s 97 municipalities. Stakeholders on the list included municipal staff members like planners and engineers; local elected officials; community-based organizations; State and local agency staff; community advocates; and Chambers of Commerce. The distribution list also included members of the public who had subscribed to the Plan’s email distribution list.
The public survey was also shared via the MPO’s social media channels and the Community Partners Toolkit. The public survey was available to the public via the project website homepage. The January 2025 virtual public forum also promoted the public survey. Those who received the link were encouraged to share the link with others.
The survey was available in seven languages, including English, Spanish (Español), Brazilian Portuguese (Português), Vietnamese (Tiếng Việt), Traditional Chinese (漢語), Simplified Chinese (汉语), and Haitian Creole (Kreyòl Ayisyen).
The survey was opened for responses on October 17, 2024, and closed on February 14, 2025. This summary describes the responses and key takeaways submitted by members of the public during this time frame.
The public survey contained approximately 20 questions, including inquiries regarding the following topics:
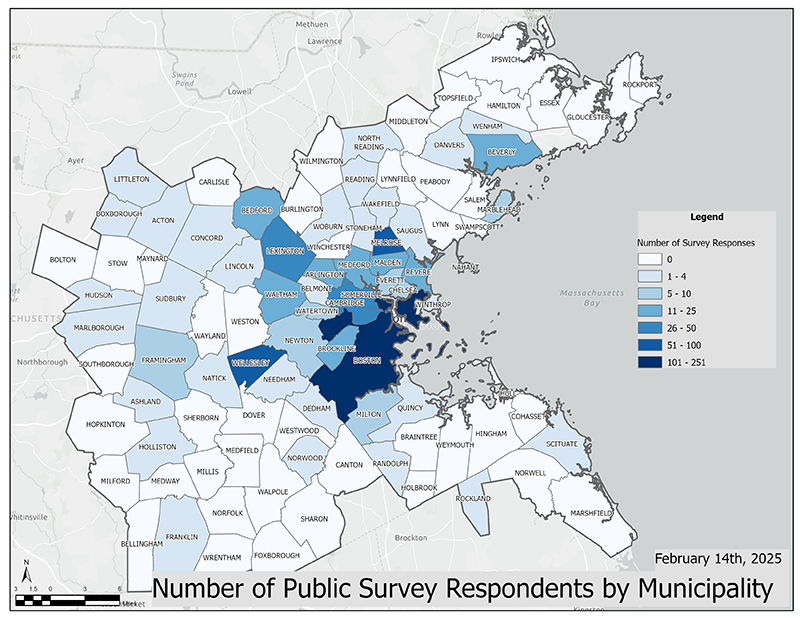
A total of 761 respondents completed the public survey, residing in 58 municipalities within the region (Figure 3.2). Additionally, respondents could submit comments about multiple municipalities; a total of 1,694 individual write-in comments were submitted about 91 municipalities. The following highlights key takeaways shared by many survey respondents.
A more in-depth summary of the public survey findings is available in Appendix C of this document.
Figure 3.2 | Map of Number of Responses by Respondents’ Home Zip Codes within the Boston MPO Region
The safety concerns comment map was launched at the same time as the public survey in October 2024 and publicly available on the Boston Region Vision Zero Action Plan project website as of October 17, 2024. The safety concerns map will remain available for public comment until the end of the project in June 2025 or later.
A link to the safety concerns map was sent via several email newsletters to a total of 3,375 project stakeholders from each of the 97 municipalities in the region. Stakeholders on the list included municipal staff members like planners and engineers. Local elected officials, CBOs, State and agency staff, community advocates, and Chambers of Commerce were also included in the distribution, as well as members of the public who had subscribed to the Vision Zero Plan’s email list. Those who received the link were encouraged to share it with others. The community partners toolkit, which was shared with CBOs, also included the link to the safety concerns map, encouraging these organizations to share with their members. The link was shared at the virtual Public Forum in January 2025.
The safety concerns map is an online, interactive web map that allows people the opportunity to share specific locations in the Boston region where they feel unsafe traveling. Stakeholders could submit location-specific comments identifying their mode of choice, the type of safety concerns they experience, and suggestions for short- or long-term improvements. Respondents may click on the map to drop a point at the location of their safety concern. Respondents may submit as many comment locations as they choose.
The analysis conducted for this report included location-specific safety concerns data received between October 17, 2024, and April 2, 2025. A total of 3,952 safety concerns were identified across 921 submissions (an average of about four safety concerns per submission) in 55 municipalities (Figure 3.3).
Figure 3.3 | Image of Responses Tracked on the Interactive Map
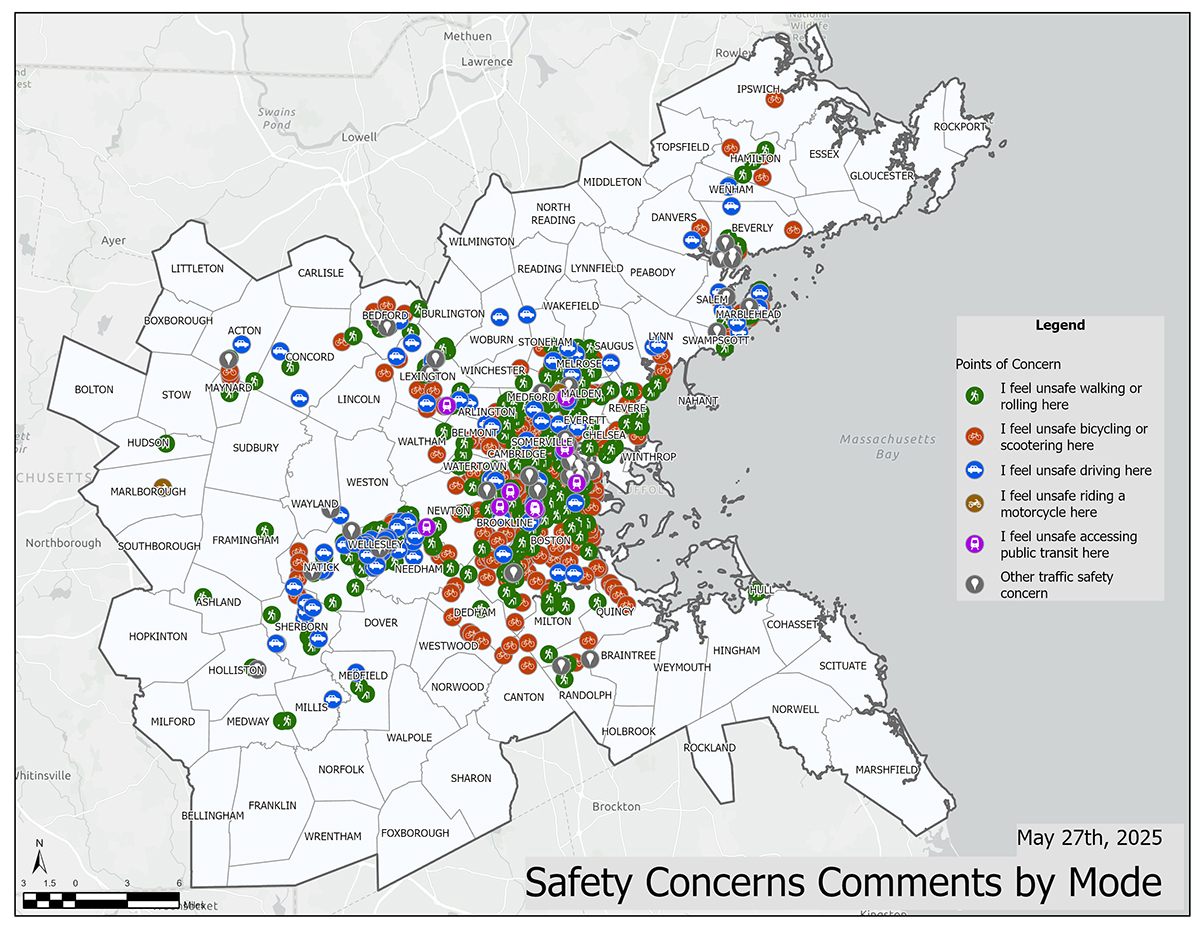
Driver behavior-related concerns were at the forefront of submissions across all modes: 53 percent identified vehicles speeding (487 submissions); 49 percent identified aggressive, reckless, or distracted driving (454 submissions); and 42 percent identified drivers passing too close (391 submissions).
The top roadway design issues identified by submissions across all modes included: 45 percent identified poor bike lane infrastructure (416 submissions); and 44 percent identified road design that feels unsafe (407 submissions).
Many people identified multiple safety concerns in one submission. In 20 percent of submissions, respondents selected more than eight safety concerns (out of 14 options). Across the submissions, several common groupings of safety concerns were observed, such as people who selected issues related to bike lanes also selected drivers passing too close. As another example, people who identified vehicle speeding as a concern also identified aggressive driving and red light running.
Notably, the most common safety challenges for respondents riding a bicycle or scooter (384 total submissions) included: 78 percent (299 submissions) identified missing or poor bike lane infrastructure; and 53 percent (205) identified drivers passing too close to pedestrians or bicyclists on the road. Other concerns included a lack of pedestrian/bike bridges, obstructions in bike lanes (typically, illegally parked cars), blind crossings, unsafe intersections, and enforcement-related issues.
The most common safety challenges identified by people walking or rolling (365 total submissions) included: 60 percent identified vehicles speeding (218 submissions); and 56 percent identified reckless driving (205 submissions). Other concerns included a lack of crosswalk visibility, lack of enforcement (drivers who do not stop for pedestrians, vehicles driving on pedestrian-only streets), and unsafe or lack of roadway crossings.
The top safety challenges for vehicle drivers (110 total submissions) included: 57 percent identified unsafe road design (63 submissions); and 50 percent identified vehicles speeding (55 submissions). Other concerns included excessive digital advertising, lack of enforcement, and unsafe intersection design when making a left or right turn.
A more in-depth summary of the safety concerns map comments is available in Appendix D of this document.
On January 29, 2025, the MPO hosted a virtual Public Forum via Zoom to gather perspectives of people who live, work, or commute through the region on roadway safety challenges and concerns.
The Public Forum had 37 attendees, including members of the general public and those representing organizations such as the Massachusetts Bay Transportation Authority (MBTA), municipal government, and local pedestrian and bicycle advisory committees, among others.
Public Forum Top Safety Concerns:
Suggestions for Improvement:
A more in-depth summary of the virtual public forum is available in Appendix E of this document.
The Boston Region MPO hosted two virtual High Injury Network (HIN) Municipal Office Hour sessions on March 3 and March 6, 2025. In these office hours, the MPO presented the draft HIN and High Risk Network (HRN) to municipal staff. These two sessions provided municipalities with an opportunity to ask questions about the HIN draft and provide suggestions on changes to the draft map layout or its data to make it more useful. Municipalities also shared how the HIN may be used to assist municipalities with prioritizing transportation safety improvement projects within their communities.
Representatives across 17 municipalities (Reading, Rockport, Boston, Marblehead, Littleton, Wellesley, Dedham, Ashland, Medway, Lincoln, Medford, Natick, Stow, Littleton, Stoneham, Hopkinton, and Bedford) provided input on the draft HIN map in the two virtual office hours sessions. Each Office Hour session was guided by the following questions:
Municipalities engaged with the HIN and HRN and shared feedback on the web-based tools and how they could see it being used within their community.
The Boston MPO conducted policy and process interviews with numerous municipal agency stakeholder groups and state agencies between November 2024 and May 2025. Table 3.3 below lists the agency stakeholders and dates for the policy interviews.
Table 3.3 | Policy Interview Stakeholders and Dates
| Agency Stakeholders |
Interview Date |
|---|---|
Massachusetts Municipal Association, Committee on Public Works, Transportation and Public Utilities (including Fitchburg, Natick, Wareham, Sterling, Newton, Andover, Sunderland, Brookline, Beverly, Concord, Hopkinton, and Northampton) |
November 15, 2024 |
Acton (Minuteman Advisory Group on Interlocal Coordination) |
November 25, 2024 |
Norwood (Three Rivers Interlocal Council) |
November 25, 2024 |
Framingham (MetroWest Regional Collaborative) |
November 25, 2024 |
Beverly |
January 21, 2025 |
Boston, Cambridge, and Somerville |
January 31, 2025 |
Arlington |
February 13, 2025 |
Medford |
March 6, 2025 |
Walpole |
March 10, 2025 |
Dedham |
March 17, 2025 |
Massachusetts Department of Transportation, Highway Safety Office |
December 2024, April and May 2025 |
Massachusetts Department of Conservation and Recreation |
May 5, 2025 |
Massachusetts Executive Office of Public Safety and Security |
May 5, 2025 |
Massachusetts Department of Public Health1 |
May 1, 2025 |
1 The Boston Region MPO did not conduct an interview with the Massachusetts Department of Health. Instead of an interview, the Boston Region MPO communicated via email correspondence to gather input.
Interviews with municipal agency stakeholders sought to broadly inform three topics about roadway safety policies and processes at both the local and state levels: gaps where policies might be missing or do not exist; challenges with existing policies that inhibit roadway safety or that municipalities struggle to implement or meet requirements; and best practices that municipalities would like to enact but need additional resources, guidance, or other support.
Table 3.4 | Key Takeaways from Interview with Municipalities
Gaps in Policies or Gaps in Policy Detail or Other Barriers |
Constrained funding (most often cited challenge). Funding constraints impact staffing and project coordination, design, and implementation. Limited design funding impedes potential safety-enhancing projects from the beginning. |
Speeding is prevalent everywhere and there are not enough human resources to stop it; legislation supporting automated enforcement is missing. |
Distracted driving and phone use by people riding bicycles or scooters. |
E-bike use in bike lanes. |
Reckless driving. |
Limited right-of-way with conflicting design demands. |
The Massachusetts Hands-Free Law was highlighted as an important step to increasing safety and identified that more can be done to reduce distracted driving. |
Identifying their municipalities as a “Vision Zero City” was identified as a helpful way to create a shared understanding of road safety and needs for different municipal departments. |
Gaps in Policies or Gaps in Policy Detail or Other Barriers (continued) |
Requiring property setback requirements for residential development may prevent future eminent domain conflicts. |
Local laws are needed to support taking out parking spaces to put in bicycle lanes, rather than having to go to the City Council for each individual project would reduce questions around project feasibility. |
State-level Policies that Influence Roadway Safety and Operations |
Openness but wariness of adopting a “safe fleet” policy, that could become an unfunded mandate or have potential liability municipalities cannot comply with to retrofit or purchase fleet vehicles with better direct vision. |
Right-of-way acquisition is a significant hurdle to increasing and improving pedestrian and bicycle infrastructure and connectivity. Barriers include the federally required acquisition process, funding, zoning, and availability. |
MassDOT’s “Healthy Transportation Policy Directive” related to developing bike networks |
Massachusetts legislation preventing automated enforcement such as red light and speed cameras. |
Massachusetts General Law on shade trees (Part 1, Title XIV, Chapter 87). |
Need to enact a “no turn on red” statewide policy and creating a resident pledge to Vision Zero. |
The Commonwealth has a “leftover” policy which states that if a speed study has already been completed on a certain street, the speed cannot be changed on the roadway. This barrier is counter to the local authority to change citywide speed limits. |
MassDOT’s speed zoning policy is workable, but it is not necessarily well known or understood. For example, the speed zoning policy allows a municipality to remove a 40 mph speed zone without doing a study, but enforcement becomes an issue because of existing statutes. |
How State Agencies and Municipalities Can Work Together |
Communities want funding to do the work, flexibility in how they can do it, and support with communications to stakeholders and the public. |
There needs to be more communication between municipal- and state-agencies for planning projects and making sure safety is incorporated in construction projects. |
Public education and buy-in are essential to implementing successful safety projects. |
Include “touch-a-truck” events to showcase large vehicle blind zones. |
Conduct stakeholder education and engagement to adjacent disciplines, including conservation, planning boards, and engineering. |
Bringing municipalities together for peer exchanges and connecting municipalities with similar land uses and development patterns could aid with identifying solutions that resonate with their needs. |
Municipalities can leverage the MAPC “Perfect Fit” resource to set parking maximums. |
Very small traffic enforcement sections have challenges implementing traffic calming measures; collecting data; managing requests for new crosswalks and implementing new projects to improve sidewalk network connectivity; conducting public engagement and education; and managing traffic congestion which leads to aggressive driving behaviors. |
How State Agencies and Municipalities Can Work Together (continued) |
Changing sideguard requirements on large vehicles at both the state and federal level to improve both fleet and roadway safety. |
Traditional public meetings are not the best way to gauge public opinion. Agencies have been focusing on more 1:1 casual conversations and open houses to counteract strong negative opinions. Additionally, the willingness to take responsibility for past traffic crashes has been helpful to gain public trust. |
Assist towns by providing more materials, such as paint, bollards, and rectangular rapid flashing beacons (RRFB). |
Interviews with state agency stakeholders sought to identify safety challenges they experience with roadway safety, state-level policies that influence or affect roadway safety and operations, and how state agencies do or would like to collaborate and coordinate with municipalities and the Boston Region MPO. The Boston Region MPO met with representatives of the Massachusetts Department of Conservation and Recreation (DCR), Executive Office of Public Safety and Security (EOPSS) Office of Grants and Research (OGR), Massachusetts Department of Transportation (MassDOT),and the Department of Public Health Injury Prevention and Control Program (IPCP). Each of these agencies’ work includes addressing transportation safety and collaboration with MassDOT at varying levels and highlighted the importance of this collaboration on improving safety in the Commonwealth. Interagency collaboration, therefore, is critical to making systemic safety improvements. Table 3.5describes key takeaways from agency partners.
Table 3.5 | Key Takeaways from Interviews with State Agencies
Challenges to Roadway Safety |
State agencies continue to be challenged with effectively communicating safety issues to the public and demonstrating the safety benefits of successful projects to continue to receive stakeholder buy-in on new and proposed projects. |
It is essential to demonstrate benefits of successful projects to continue to receive stakeholder buy-in on new proposed projects. |
Many law enforcement agencies do not have enough staff to participate in over-time speed patrols, to be trained as a Drug Recognition Experts (DRE), or to write complete grant applications. |
Motor vehicle crashes are the leading cause of traumatic brain injuries, hospitalizations, and deaths in Massachusetts. There are also other serious injuries that people sustain in these crashes that may require long-term rehabilitation and be life-altering, such as spinal cord injury. |
People’s fear of being injured in a motor vehicle crash could exacerbate other conditions, such as obesity, cardiovascular disease, and depression. |
Traffic fatalities and serious injuries could affect mental health for those who have sustained serious injuries and the loved ones of those seriously injured or killed. |
Parkways play an important role in connecting open spaces to key destinations across the region, and there is an overall need to implement infrastructure improvements that help increase operational safety (e.g., implementing pedestrian signal buttons) and consider accessibility and mobility needs for strollers, wheelchairs, and other mobility assistance device users. |
State-level Policies that Influence Roadway Safety and Operations |
Program and policy recommendations are needed to make incremental improvements to pedestrian and bicycle accommodations a consistent consideration in routine maintenance activities (such as Integrate sidewalk and pathway maintenance and replacement within the existing roadway resurfacing program; and expand and publicize a policy on winter maintenance and a prioritized list of sidewalks and shared use paths.) |
Often motor vehicle citations are not upheld in the courts, which undermines the efforts of law enforcement to keep drivers accountable and roadways safe. |
The passing of a primary enforcement law would need to include judicial support for law enforcement officers issuing citations. |
How State Agencies and Municipalities Can Work Together |
The MPO could potentially assist municipalities with applying for and tracking performance for public safety grant programs offered by the state as municipalities are often too short-staffed to apply for grants even when the data identifies an area of concern. |
The MPO could support improving communications and education about safety and connectivity improvement efforts. |
The MPO to potentially assist municipalities with applying for and tracking performance for public safety grant programs. |
It is important to leverage public health messaging and communication strategies to raise awareness about transportation safety and related interventions. Some approaches could include educating children; spreading messages coming from peers, trust community organizations, and health care provides; and ensure cultural and linguistically appropriate messaging is available. |
Continue to work across agencies to improve the quality and availability of crash data (including and contributing factors) and public health data. |
Inform strategies to reduce motor vehicle crash (MVC) injuries and deaths in MA, particularly to address inequities in MVC injuries and deaths among people of color, vulnerable road users, and other disproportionally impacted populations. |
Identify ways in which the Vision Zero Action Plan can include public awareness and education; subsidize driver education for low-income families and require driver’s education for all new drivers; push for health care interventions; expand and subsidize older driver assessments; support the role of law enforcement; explain the importance of legal sanctions; and ensure cultural and linguistically appropriate messaging is available. |
On April 14, 2025, the Boston Region MPO conducted a virtual focus group with individuals with disabilities. The intent of the Focus Group for Individuals with Disabilities was to better understand how stakeholders with disabilities that impact their mobility can travel and maneuver safely around the region. The goal of the focus group was to understand obstacles and safety concerns for adults with disabilities from various parts of the region and to understand what safety improvements could help benefit those in the region with disabilities that impact mobility.
A promotional flyer for the Adults with Disabilities Focus Group was shared with 83 organizations in the region that work in the with adults with disabilities and/or transportation safety. The project team asked a representative of each group to share the Focus Group information and flyer among stakeholders. The flyer invited those who met the criteria to express interest in participating. Interested participants were screened and selected. Participants received a $100 gift card for their time.
The roundtable included eight participants. Participants were asked to introduce themselves and describe how they travel around the region. Out of the eight participants, two focus group members drive personal motor vehicles, two focus group members walk, and the remaining focus group members get around the region using a combination of transportation methods including ride-sharing services (e.g., Uber) and by train, bus, or paratransit service provided by the MBTA.
Following introductions, focus group members were asked to participate in a polling activity to gauge their feelings on roadway safety. After the polling activity was complete, the rest of the focus group included facilitated discussion related to roadway safety concerns and roadway improvement suggestions. Key takeaways related to the polling activity and facilitated discussions are summarized in the sections below.
The first poll gauged how safe individuals with disabilities feel when traveling in the region on a 1–5 scale. Six participants provided feedback. Fifty percent of participants indicated they feel somewhat safe, 33 percent feel neither unsafe nor safe, and 16 percent feel very safe.
The second poll gauged how important roadway safety is to individuals with disabilities on a 1–5 scale. Six participants provided feedback. All participants (100 percent) indicated that roadway safety is extremely important to them.
Participants were asked about the kinds of roadway characteristics or design that make them feel unsafe. Focus group participants noted that sidewalks are not wide enough and a lack of sidewalk snow shoveling in winter months force them to walk or roll in the streets; roadways are not well maintained resulting in potholes; and intersections have confusing signals and limited pedestrian visibility which results in motor vehicles transversing the crosswalk at the same time as pedestrians. Participants specifically noted difficulties when traveling in Cleveland Circle, Roslindale, and in the North End due to dangerous roadway and sidewalk conditions.
Participants were then asked about the kinds of driver behaviors that make them feel unsafe. Focus group participants noted that they feel unsafe due to the prevalence of distracted driving and texting while operating a vehicle; when traveling near large vehicles; when traveling near older drivers; and when Uber or Lyft rideshare drivers act inappropriately.
Participants were also asked how traffic enforcement in their area could be improved to ensure safety for all users. Focus group participants noted that traffic enforcement is challenging due to state and local jurisdiction issues; people never get pulled over for speeding on local roads; and there is a stigma that drivers in the region should be “aggressive drivers.”
Participants were asked if there are any recent transportation improvements that have made them feel safer as they walk, take transit, bike, or drive around the region. Focus group participants noted that train ambassadors are helpful and empowering; roadway repairs and restriping has been helpful; the upcoming shared-use pathways improvements on Mystic Valley Parkway may improve the feeling of safety; and that young driver education on texting while driving seems to be helpful to teach the younger generation about roadway safety.
Participants were then asked if they had suggestions for improving transportation safety in their communities. Focus group participants noted the importance of empowering safety for all roadway users by ensuring adequate rules are set for moped drivers, motor vehicle drivers, and pedestrians; and the need for investments in public transportation.
Participants were also asked how the community and local leadership can work together to improve safety for everyone. Focus group participants noted that initiatives such as “ride my ride” or “walk my walk” implemented by Mayor Wu is a great collaborative and interactive experience to demonstrate how people with disabilities navigate transportation challenges; it’s important to share accountability; and there needs to be better coordination across jurisdictions to ensure roadway rules are agreed upon.
To understand the transportation safety needs for older adults (ages 65 and above), the project team facilitated a roundtable with Aging Services Access Point (ASAP) providers on April 16, 2025. Following the discussion, a survey directed at older adults was shared with the ASAP staff who attended the meeting and those in the region unable to attend, for them to distribute to their members. The goal of the survey was to gain perspective on transportation safety from older adults who engaged with ASAP services.
On April 16th, 2025, the Boston Region MPO invited Aging Services Access Point (ASAP) providers to a virtual roundtable to discuss older adult roadway safety challenges and improvement recommendations. ASAPs provide programs and services designed specifically to support adults aged 60 and older and their caregivers. The invite for this discussion was sent to each ASAP organization in the region.
The goal of the discussion was to understand obstacles and safety concerns for older adults from different parts of the region and to understand what safety improvements could help benefit those in the region trying to access ASAP services.
To kick off the roundtable, participants were asked to complete a polling activity. The poll question asked providers to vote on transportation safety challenges faced by older adults they serve. Participants voted on walkability as the biggest challenge, followed by sidewalks; accessibility of sidewalks for wheelchairs and walkers; street sharing; snow and ice clearing; intersection design; vehicle design; lighting; and other drivers’ behaviors. Participants explained that intersection design should include elements such as lighting, curb bump outs, and flashing beacons; vehicle technology is getting more complex which can be distracting and confusing; and older adults feel unsafe sharing the street with bicyclists and scooters.
When asked about challenges for older adults who need or want to continue to drive, participants noted that older adults have trouble navigating the roadway due to an increase in larger vehicles; sidewalks are often brick and need repairs; delivery drivers block sightlines; there’s a lack of accessible parking near destinations; and older adults that drive feel uncomfortable traveling into Boston for medical appointments.
When asked about recent improvements that have helped improve older adult safety in the region, participants noted that Complete Streets projects and those that assist with accessibility and walkability (e.g., Boston’s Squares + Streets planning initiative) are most successful. Participants then discussed several recommendations to improve transportation safety for older adults:
When asked how community and local leadership can work together to improve traffic safety for older adults, participants noted the need build partnerships between ASAPs and local planners and ensure safety initiative planning and coordination occurs early in the process.
The Older Driver Survey received two responses. Older driver respondents indicated that they usually drive or walk around the region. One respondent noted that they are dependent on a rolling walker, so they prefer to drive but often feel unsafe driving due to the fact that parking rarely exists close enough to their destinations.
When asked about issues that prevent them from walking, bicycling, or taking transit, respondents indicated that a lack of access to transit is the biggest contributor. One respondent indicated that they would like to bike more locally, but there are not a lot of bike bikes. Additionally, both respondents indicated that the number one concern related to driver behavior is drivers passing too close to people walking or bicycling.
On April 17, 2025, the Boston Region MPO invited representatives from Chambers of Commerce (CoC) to a roundtable to discuss the state of transportation safety, top safety challenges faced by businesses, and the relationship between transportation safety and economic health. The roundtable had three participants.
The Roundtable for CoC members was intended to help the project team understand how the business community felt about traffic safety efforts. The roundtable was also intended to educate the project team on how to best engage the business community on these topics moving forward. The roundtable discussion focused on three topical areas: understanding the perceptions of the business community; communication challenges and strategies; and long-term versus short-term planning. Key input from roundtable participants is summarized in the sections below.
There is a perception of conflict between road safety and increasing the number of patrons visiting businesses. Roundtable participants shared that transportation safety projects such as “road diets” can be perceived by businesses as conflicting with their interests and their bottom line. While the town may see changes as an improvement to safety and traffic flow, the business community may see these plans as an economic development threat instead of a safety improvement. Eliminating cut-through traffic, for example, can be seen negatively as taking eyes away from businesses.
Similarly, many small business owners view congestion as a higher priority transportation issue compared to safety. Congestion is seen as a more tangible issue when discussing roadways, but safety is not felt as closely by the business community until a crash or other safety-related event occurs in the area. Communicating the relationship between safety, healthy community, and the business benefits is important to building the relationship between municipal staff and the business community.
Business owners with curb access may view bike lanes as taking parking away from shoppers instead of seeing them as a way to get more people to access their business through different modes. This does not mean that business owners do not care about safety, but they care about it in a different way. There is a need to engage business owners by focusing on their priorities; congestion and access to businesses will get their attention.
Communication challenges exist between municipal staff and leadership and the business community. While CoCs try to facilitate the conversation between municipal staff and leadership, there can be a challenge with effectively communicating municipal plans, priorities, and projects to the business community.
Due to the heavy demands of owning a small business, it is often difficult to engage small business owners in local transportation planning and projects. This means that they often only get involved when projects are perceived to cause a problem for business, making it challenging to have productive conversations about the need for a transportation improvement project and the trade-offs. Getting businesses involved early in the project planning process is important to creating understanding and support for transportation safety projects. It is a lot easier for the CoCs to then help communicate and educate businesses.
To best engage the business community during a transportation improvement project, it would be helpful to focus on what is most important to the business stakeholders—why is the project important and how will it impact businesses? It is good to focus on the potential for future benefits and show real world examples of how projects focused on transportation safety have positively impacted businesses elsewhere.
Planners and municipal staff should anticipate questions and concerns from the business community and be accessible early and often to communicate with the businesses. Several items to plan for may include:
One example of the business community being involved and supportive of downtown streetscape improvements is the Hudson, MA Business Improvement District (BID). Placemaking improvements have been run by businesses working together. The funds from the BID have been used on streetscape improvements, which allows the business owners to see direct benefits of being involved in the process. Another example of positive business interaction is the Watertown Square Complete Streets project, which used multiple charettes and workshops to engage the business community early in the project. These types of improvements make the business community feel empowered in decision making.
Longer-term municipal planning projects and priorities (such as a 15-year vision to increase transportation safety) can be difficult for small business owners to focus on when they face concerns about the health of their business on a much shorter time horizon.
Communicating with businesses about how planning processes and construction projects will impact their businesses in the short term, and working together to form feasible solutions for short term impacts is one way attendees thought municipal staff and leadership could help build strong working relationships with the business community.
On May 8 and 9, 2025, the team held two virtual Municipal Roundtables to present existing safety data in the region and discuss potential strategies. One roundtable focused on perceptions and insights by local law enforcement officers. A second roundtable collected input from Directors of Department of Public Works, Town Engineers, Planners, and other municipal staff about potential strategies to address the top transportation safety issues, from a municipal perspective.
The municipal law enforcement roundtable was held virtually in Zoom on May 8, 2025. The invitation was sent to a total of 99 law enforcement contacts from each of the 97 municipalities in the region. Targeted phone calls were conducted as follow-up to specific municipal police departments. Five law enforcement officers participated in the roundtable.
The goal of the Law Enforcement Roundtable was to share findings from the existing conditions report and understand how traffic safety concerns manifested in their areas within the region. A secondary goal was to discuss potential enforcement and other strategies to deal with recurring transportation safety issues, from the perspective of law enforcement.
Overall, participants shared that in their experience, speeding is a common contributing factor to crashes that result in serious injuries or fatalities. Participants perceived that signage (such as posted speed limits) does not alter driver behavior or slow speeds; the design of the roadway is much more impactful. The new e-citation process has successfully made traffic stops more efficient, as well as officers’ ability to track the number of warnings a driver has received.
Participants expressed appreciation for the law that allows a municipality to opt into a 25 mile per hour (mph), city-wide speed limit on municipal-owned roadways (based on Massachusetts General law Chapter 90 Section 17). However, several hurdles remain. It is difficult to enforce the 25 mph speed limit since the law requires vehicles to be tracked for a 1/8-mile length while exceeding the speed limit (and ¼ mile for higher speeds) in order for an officer to write a citation. This means the 25 mph speed limit cannot be enforced by LIDAR or RADAR on those segments. Furthermore, the 25 mph limit does not apply to any roadway segment with a special speed regulation or owned by the state. This means that some corridors have frequently changing speed limits, which can be confusing for drivers.
Funding and lack of staffing were identified as the biggest challenges when enforcing traffic laws effectively. Participants felt that automated enforcement (including speeding and red light running) could be beneficial; however, automated enforcement is not allowed by Massachusetts law at this time. Participants also identified a lack of regulation specifically for e-bikes and mopeds, which make enforcement difficult for dangerous riding behaviors. Overall, law enforcement officers emphasized that changes in roadway design and education must accompany enforcement efforts to see changes in driver behavior.
The Departments of Public Works (DPW) and Planning Roundtable was held virtually in Zoom on May 9, 2025. The roundtable invitation was sent to a total of 165 contacts from each of the 97 municipalities in the region, including Directors of Department of Public Works, Town Engineers, Planners, and other municipal staff. Seven staff members representing six municipalities participated in the roundtable.
The goal of the DPW and Planning Roundtable was to share findings from the existing conditions report and understand how traffic safety concerns manifested in their areas within the region. A secondary goal was to discuss potential strategies to deal with recurring transportation safety issues, from the perspective of municipal planners and public works departments.
Overall, participants emphasized the importance of addressing roadway safety through parallel efforts: roadway design, signage, speed limits, enforcement, and education. Self-enforcing roadway design helps drivers understand how they should drive for a specific roadway’s contexts. Traffic enforcement helps ensure safe driving behaviors as well. Automated enforcement and traffic cameras, if made legal by the Commonwealth, could be another strategy to combat dangerous driving behaviors.
Public education about roadway improvements is a key component for successful implementation of engineering and enforcement measures. The public may not consider how much effort it takes to implement traffic calming infrastructure, even if requested by the public. Education on safety strategies and driver behavior for the public may help to develop multimodal solutions while making drivers, walkers, rollers, and bikers safer and more aware beyond physical roadway changes.
Coordination between municipal departments (including Planning, Engineering, DPW, Fire and Police) is crucial to successfully accomplishing physical changes to the roadway. For example, roadway improvements such as flex posts or speed humps may affect snow plowing operations during winter months. As another example, there is a perception that traffic calming and road diet infrastructure narrowing the roadway may create challenges or increase response times for first responders, such as emergency medical services or fire departments. Early coordination in project design can help all municipal departments to feel comfortable with new roadway designs and to understand different maintenance and operational needs that new roadway designs might require, Buy-in and commitment from municipal leaders (a top-down approach) can make safety strategies easier to propose and implement. The MPO could serve a role in coordinating across jurisdictions, as well as with state roadway owners including MassDOT and the Department of Conservation and Recreation.
Participants were interested in peer exchanges to learn more about successful implementation and best practices. Participants were interested in sharing solutions between similar types of towns and cities with similar safety needs. Smaller, more rural municipalities will have more in common amongst one another in terms of infrastructure and driving behavior. At the same time, attendees also thought that learning from municipalities with more mature Vision Zero programs could be helpful for individual municipal implementation.This appendix lists which municipalities participated in various engagement activities throughout the development of the plan. Engagement opportunities included responding to a municipal survey in fall 2024, participating in a virtual meeting or policy interview, or having a separate follow-up conversation with the MPO. Meeting opportunities included the September 2024 office hours, January 2025 public forum, March 2025 HIN office hours, or May 2025 roundtables with municipal law enforcement or departments of public works and planning. Understanding which municipalities were reached during plan development will help MPO staff plan continued engagement during plan implementation.
Table A.1 | Municipality Engagement by Activity
| Municipality | Municipality Engaged? | Municipal Survey | September 2024 Office Hours | January 2025 Public Forum | March 2025 HIN Office Hours | Policy Interviews | May 2025 Municipal Law Enforcement Roundtable | May 2025 Municipal DPW/Planner Roundtable | Follow-up Conversation with MPO |
| Acton | Yes | l | l | ||||||
| Arlington | Yes | l | l | l | |||||
| Ashland | Yes | l | l | l | |||||
| Bedford | Yes | l | l | l | |||||
| Bellingham | Yes | l | |||||||
| Belmont | No | ||||||||
| Beverly | Yes | l | l | l | l | ||||
| Bolton | Yes | l | |||||||
| Boston | Yes | l | l | l | l | l | |||
| Boxborough | No | ||||||||
| Braintree | No | ||||||||
| Brookline | Yes | l | l | l | l | ||||
| Burlington | No | ||||||||
| Cambridge | Yes | l | l | ||||||
| Canton | No | ||||||||
| Carlisle | No | ||||||||
| Chelsea | Yes | l | l | ||||||
| Cohasset | No | ||||||||
| Concord | Yes | l | l | ||||||
| Danvers | Yes | l | |||||||
| Dedham | Yes | l | l | l | |||||
| Dover | No | ||||||||
| Essex | No | ||||||||
| Everett | Yes | l | |||||||
| Foxborough | No | ||||||||
| Framingham | Yes | l | |||||||
| Franklin | No | ||||||||
| Gloucester | Yes | l | |||||||
| Hamilton | No | ||||||||
| Hingham | Yes | l | l | ||||||
| Holbrook | No | ||||||||
| Holliston | Yes | l | |||||||
| Hopkinton | Yes | l | l | ||||||
| Hudson | No | ||||||||
| Hull | No | ||||||||
| Ipswich | No | ||||||||
| Lexington | Yes | l | |||||||
| Lincoln | Yes | l | |||||||
| Littleton | Yes | l | |||||||
| Lynn | No | ||||||||
| Lynnfield | No | ||||||||
| Malden | Yes | l | l | l | |||||
| Manchester-by-the-Sea | No | ||||||||
| Marblehead | Yes | l | l | l | l | ||||
| Marlborough | No | ||||||||
| Marshfield | No | ||||||||
| Maynard | No | ||||||||
| Medfield | No | ||||||||
| Medford | Yes | l | l | l | |||||
| Medway | Yes | l | l | ||||||
| Melrose | Yes | l | |||||||
| Middleton | No | ||||||||
| Milford | No | ||||||||
| Millis | No | ||||||||
| Milton | Yes | l | |||||||
| Nahant | No | ||||||||
| Natick | Yes | l | l | l | l | l | l | ||
| Needham | Yes | l | |||||||
| Newton | Yes | l | |||||||
| Norfolk | No | ||||||||
| North Reading | No | ||||||||
| Norwell | No | ||||||||
| Norwood | Yes | l | |||||||
| Peabody | No | ||||||||
| Quincy | Yes | l | |||||||
| Randolph | No | ||||||||
| Reading | Yes | l | l | ||||||
| Revere | Yes | l | |||||||
| Rockland | No | ||||||||
| Rockport | Yes | l | |||||||
| Salem | Yes | l | |||||||
| Saugus | No | ||||||||
| Scituate | Yes | l | |||||||
| Sharon | Yes | l | l | ||||||
| Sherborn | Yes | l | l | l | |||||
| Somerville | Yes | l | l | ||||||
| Southborough | No | ||||||||
| Stoneham | Yes | l | l | ||||||
| Stow | Yes | l | |||||||
| Sudbury | Yes | l | |||||||
| Swampscott | Yes | l | |||||||
| Topsfield | No | ||||||||
| Wakefield | Yes | l | |||||||
| Walpole | Yes | l | l | ||||||
| Waltham | No | ||||||||
| Watertown | Yes | l | l | ||||||
| Wayland | No | ||||||||
| Wellesley | Yes | l | l | ||||||
| Wenham | No | ||||||||
| Weston | No | ||||||||
| Westwood | No | ||||||||
| Weymouth | Yes | l | |||||||
| Wilmington | No | ||||||||
| Winchester | Yes | l | |||||||
| Winthrop | No | ||||||||
| Woburn | No | ||||||||
| Wrentham | Yes | l |
About the Municipal Survey
Purpose
The municipal survey was developed for the Boston Region Vision Zero Action Plan. The purpose of the municipal survey was to gather transportation safety concerns and successes from municipal leaders to better understand the challenges faced in making progress toward zero traffic-related deaths and serious injuries in the region.
The municipal survey was created separately from a public survey (which was distributed several weeks later) to get a more precise response from municipalities, especially planners, Public Works employees, and those related directly to the planning, maintenance, and oversight of the region’s local transportation systems. This feedback at a local level is critical to help supplement other sources, such as crash data and input from the public.
Recipients
The survey was sent to a total of 331 contacts from each of the 97 municipalities in the region, including Directors of Department of Public Works, Town Engineers, Planners, and other municipal staff.
Topics
The survey contained 15 questions, including information regarding the following topics:
Survey Questions
Time Frame
The survey was opened for responses on September 24, 2024, and scheduled to close September 30. To receive as many responses as possible, a reminder was sent to recipients on October 1 to complete the municipal survey by the deadline extended until Friday, October 4, 2024.
Municipal Survey Results
The survey received responses from 36 municipalities in the Boston Region. Respondents included:
Figure B.1 below shows a map of survey respondents throughout the greater Boston Region.
Figure B.1 | Map of Responses Recorded in the Boston MPO Region
Respondents
The types of respondents from each community contained municipal workers from several departments, including mostly Directors of Planning, City Councilors, DPW directors, Town Engineers, Transportation Planners, Housing and Economic Development Staff.
Infrastructure and Driver Concerns
Question 7 in the survey asked municipalities to rank safety concerns related to road and infrastructure design and conditions. Respondents were asked to rate 14 different road and infrastructure priorities on a scale from “Essential” to “Not a Priority” (see Figure B.2 below). Poor/missing sidewalks and poor/missing bike lanes were the two infrastructure concerns rated as the highest priority across municipalities, each earning 20 votes as a high priority item. Meanwhile, road width (either too wide or too narrow) was the characteristic most often rated as not a priority. Of the road width related options, roads being too narrow had the lowest rating with nine votes for not being a priority.
Figure B.2 | Rating of Infrastructure Concerns of Highest Priority (Question 7)
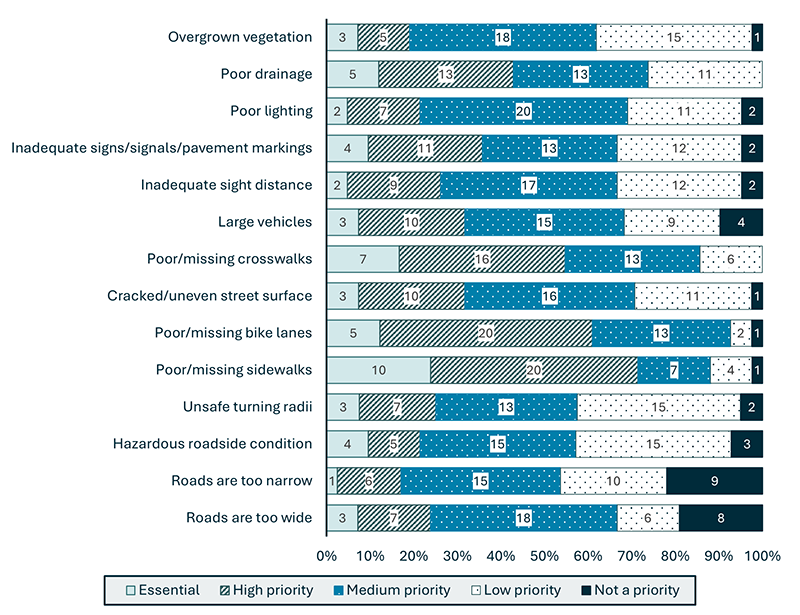
Several respondents also answered “Other” for Question 7 and wrote in additional concerns. Their responses spanned roadway design, speed management, vulnerable road users and accessibility, transit, and roadway ownership, including:
Question 8 in the survey asked municipalities to rank road safety concerns related to driver behavior. Figure B.3 visualizes Question 8. Speeding and distracted driving were the two driver behavior safety concerns rated as the highest priority to address, each with 23 respondents identifying as a high priority item. Pedestrian/bicyclists not adhering to rules of the road were the characteristic rated most often as not a priority or low priority.
Figure B.3 | Rating of Driver Behavior Concerns of Highest Priority (Question 8)
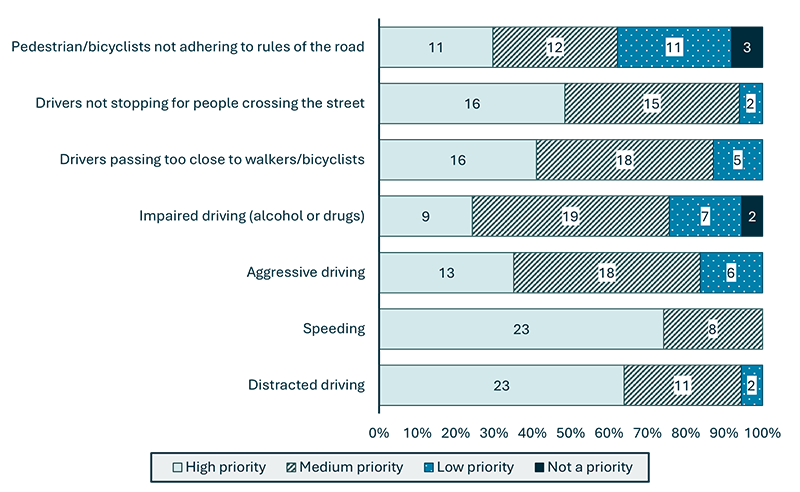
Several respondents also answered “Other” for Question 8 regarding driver behavior, including driving differently on different road types, illegal parking, and motorized bike use on paths and sidewalks. Respondents’ written-in concerns included:
Community Challenges
Question 11 asked about challenges that each community faces when trying to implement safety strategies, interventions, or programs. Lack of funding for capital improvement projects or other roadway safety behavioral and educational programs was ranked as the most serious challenge for municipalities, by a wide margin.
Figure B.4 | Rating of Challenges Faced by Municipalities (Question 11)
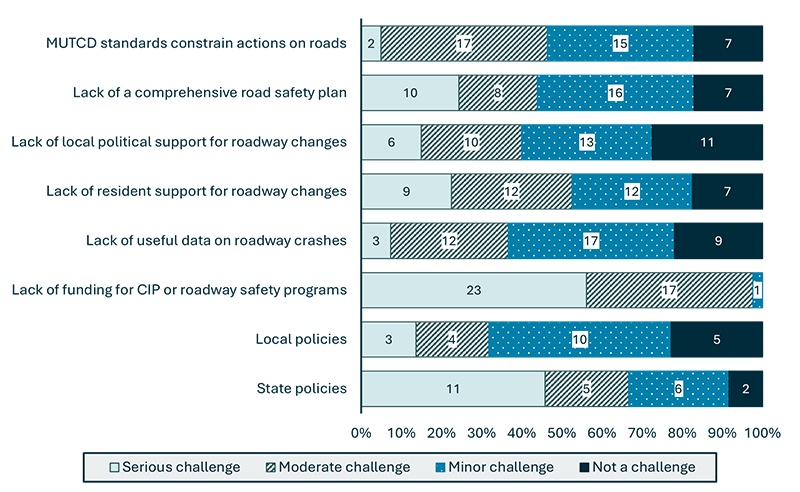
Respondents also noted several other challenges faced by their municipalities that were not listed as options in Question 11, including public opposition, limited capacity of both municipal staff and contractors, and restrictive state policies and processes. Respondents wrote out the following answers in the “Other” section:
Concerns of the Highest Priority
After analyzing the data, it is clear that within all communities, the infrastructure concerns with the highest degree of priority (those rated as “Essential”) were poor/missing sidewalks, poor/missing crosswalks, poor/missing bike lanes, and poor drainage (ice/snow/water on the road/sidewalks). Respondents rated speeding and distracted driving as their high priority concerns related to driver behavior.
The combined high priority for speeding, distracted driving, and lack of pedestrian and cycling infrastructure directly reflect the purpose of The Plan. The development process of The Plan will help to identify the nexus between infrastructure and policy gaps and driver behaviors to better understand how to implement solutions that will improve regional safety.
The option consistently rated as a “Serious Challenge” was the lack of funding for capital improvement projects (CIP) or other roadway safety behavioral and educational programs.
The municipal survey will help guide The Plan forward as it relates to municipal outreach and areas of concern for focus. Helping to identify what municipalities are concerned about and struggling with at an organizational level, paired with the forthcoming results from the public survey, will guide the intention and focus of The Plan going forward to directly address the issues faced across the Boston Region.
Priorities and Challenges by Community
Table B.1 below shows the responses on the infrastructure and driver behavior safety priorities rated as “Essential” and the challenges noted as “Serious Challenges” by respondent communities.
Table B.1 | Community Priorities and Challenges
| Municipality |
Essential Safety Priority—Infrastructure |
Essential Safety Priority—Driver Behavior |
Serious Challenges |
|---|---|---|---|
Arlington |
|
|
|
Ashland |
|
|
|
Bedford |
|
|
|
Bolton |
|
|
|
Brookline |
|
|
|
Cambridge |
|
|
|
Chelsea |
|
|
|
Concord |
|
|
|
Dedham |
|
|
|
Everett |
|
|
|
Lexington |
|
|
|
Malden |
|
|
|
Marblehead |
|
|
|
Medford |
|
|
|
Medway |
|
|
|
Melrose |
|
||
Milton |
|
|
|
Natick |
|
|
|
Needham |
|
|
|
Quincy |
|
|
|
Reading |
|
|
|
Revere |
|
|
|
Salem |
|
|
|
Scituate |
|
|
|
Sharon |
|
|
|
Sherborn |
|
|
|
Stoneham |
|
||
Wakefield |
|
|
|
Watertown |
|
|
|
Weymouth |
|
|
|
Winchester |
|
|
|
Wrentham |
|
|
|
About the Public Survey
Purpose
This public survey was developed for the Boston Region Vision Zero Action Plan (the Plan) to better understand the public transportation safety concerns in the 97 communities represented by the Boston Region Metropolitan Planning Organization (MPO).
Recipients and Analysis Timeframe
The survey was distributed via the MPO’s Vision Zero email newsletter to a total of 3,375 project stakeholders from each of the 97 municipalities in the region. Stakeholders on the list included municipal staff members like planners and engineers. Local elected officials, Community Based Organizations (CBOs), State and agency staff, community advocates, Chambers of Commerce were also included in the distribution, as well as members of the public who had subscribed to the Plan’s email list.
The survey was also shared via the MPO’s social media channels. Those who received the link were encouraged to share the link with others. The survey was available to the public via the project website homepage. The link was also shared at a Boston Vision Zero public meeting in January 2025.
The survey was opened for responses on October 17, 2024, and closed on February 14, 2025. This summary report describes the responses and key takeaways submitted by members of the public during this time frame.
Topics
The survey contained approximately 20 questions, including information regarding the following topics:
The survey was available in seven languages, including: English, Spanish (Español), Brazilian Portuguese (Português), Vietnamese (Tiếng Việt), Traditional Chinese (漢語), Simplified Chinese (汉语), and Haitian Creole (Kreyòl Ayisyen). The next section lists all public survey questions in in English.
Survey Questions
Respondents were also asked a series of questions about individual communities in the study area. From the 97 communities in the region, respondents could select which communities they wanted to provide feedback on. The following questions were repeated for each community selected. The [COMMUNITY] text indicates where the respondent’s chosen municipality is listed.
Participants were also asked if they were willing to share demographic information. They could opt‑in to respond to the following demographic questions.
Public Survey Results
Key Takeaways
The public survey was completed by 761 respondents in total, including receiving 1,694 individual write-in comments about specific municipalities. This section highlights the key takeaways shared by many survey respondents.
About Survey Respondents
The online survey was completed by 761 respondents in total. This section describes the languages, locations, and demographics of survey respondents.
Although the survey was available in seven languages, it was only completed in three, with over 98 percent of respondents completing it in English (Table C.1).
Table C.1 | Number of Responses per Language
Language |
Number of Respondents |
English |
750 |
Spanish |
10 |
Haitian Creole |
1 |
Brazilian Portuguese |
0 |
Simplified Chinese |
0 |
Traditional Chinese |
0 |
Vietnamese |
0 |
Grand Total |
761 |
The survey received responses from people who live in 58 municipalities within the Boston Region. Figure C.1 shows a map of survey respondents throughout the greater Boston Region. Respondents gave their home zip codes but were able to comment on any municipality in the region.
Figure C.1 | Map of Number of Responses by Respondents’ Home Zip Codes within the Boston MPO Region
The tables below show the demographic makeup of respondents who elected to provide answers to demographic questions. This subsection only includes statistics about the portion of respondents who shared this information. Demographic information included household size, race and ethnicity, disability, age, gender, and number of vehicles per household.
Most respondents (45.3 percent) came from a household that included two people. Table C.2 lists the number of people per household.
Table C.2 | Demographic Question—How many people are in your household?
| How many people are in your household? Include yourself. |
Percentage |
Count |
|---|---|---|
1 |
15.66% |
65 |
2 |
45.30% |
188 |
3 |
16.63% |
69 |
4 |
17.35% |
72 |
5 |
3.37% |
14 |
6 |
0.72% |
3 |
7 |
0.48% |
2 |
8 |
0.24% |
1 |
9 or more |
0.24% |
1 |
Grand Total |
100.00% |
415 |
Of the respondents who chose to answer the demographic questions, 72.6 percent were White. The second largest number of respondents identified as Black or African American (6.97 percent) followed by respondents of Hispanic, Spanish origin, or Latino/a/x (4.09 percent). Table C.3 shows how respondents self-identified by race and ethnicity.
Table C.3 | Demographic Question—How do you self-identify by race and/or ethnicity?
| How do you self-identify by race and/or ethnicity? |
Percentage |
Count |
|---|---|---|
American Indian or Alaskan Native, Black or African American |
0.48% |
2 |
American Indian or Alaskan Native, Hispanic, Spanish origin or Latino/a/x |
0.24% |
1 |
American Indian or Alaskan Native, Hispanic, Spanish origin or Latino/a/x, White |
0.48% |
2 |
American Indian or Alaskan Native, White |
0.48% |
2 |
Asian |
4.33% |
18 |
Asian, White |
1.92% |
8 |
Black or African American |
6.97% |
29 |
Black or African American, Hispanic, Spanish origin or Latino/a/x |
0.72% |
3 |
Black or African American, Hispanic, Spanish origin or Latino/a/x, White |
0.48% |
2 |
Black or African American, White |
0.72% |
3 |
Hispanic, Spanish origin or Latino/a/x |
4.09% |
17 |
Hispanic, Spanish origin or Latino/a/x, White |
1.68% |
7 |
Native Hawaiian or other Pacific Islander |
0.48% |
2 |
Other (please specify) |
0.96% |
4 |
Prefer not to answer |
2.64% |
11 |
White |
72.60% |
302 |
White, Other (please specify) |
0.72% |
3 |
Grand Total |
100.00% |
416 |
Of respondents who chose to answer the demographic questions, approximately 15 percent (63 respondents) identified as having a disability (shown in Table C.4).
Table C.4 | Demographic Question—Do you have a disability?
| Do you have a disability? |
Percentage |
Count |
|---|---|---|
Yes |
15.11% |
63 |
No |
80.58% |
336 |
Prefer not to answer |
4.32% |
18 |
Grand Total |
100.00% |
417 |
The majority of respondents fell into the age range of 45-64 (28.85 percent), with the 22–34 age group following closely behind (28.61 percent). The third largest age group recorded was 35–44 (18.75 percent); almost 20 percent of respondents who shared their ages were aged 65 or older. Table C.5 lists the breakdown of age ranges for all respondents.
Table C.5 | Demographic Question—What is your age?
| What is your age? |
Percentage |
Count |
|---|---|---|
Under 18 |
2.88% |
12 |
18–21 |
0.72% |
3 |
22–34 |
28.61% |
119 |
35–44 |
18.75% |
78 |
45–64 |
28.85% |
120 |
65–74 |
14.66% |
61 |
75 and older |
4.81% |
20 |
Prefer not to answer |
0.72% |
3 |
Grand Total |
100.00% |
416 |
Of respondents who chose to answer the demographic questions, 51.44 percent identified as women, while 40.63 percent identified as men. The next largest group who chose to identify were respondents who identified as non-binary at 3.61 percent. Table C.6 illustrates how people self-identify by gender.
Table C.6 | Demographic Question—How do you identify by gender?
| How do you identify by gender? |
Percentage |
Count |
|---|---|---|
Woman |
51.44% |
214 |
Man |
40.63% |
169 |
Non-binary |
3.61% |
15 |
Prefer to self-describe |
0.48% |
2 |
Prefer not to answer |
3.85% |
16 |
Grand Total |
100.00% |
416 |
All respondents were asked how many vehicles they keep at home for household use (shown in Table C.7). The majority of respondents (37.32 percent) have one vehicle at home. Households with two vehicles followed closely behind at 34.56 percent of responses.
Table C.7 | Question—How many vehicles are kept at home for you and your household to use?
| Number of Vehicles for Household |
Percentage of Respondents |
|---|---|
No vehicle |
20.37% |
1 vehicle |
37.32% |
2 vehicles |
34.56% |
3 or more vehicles |
7.75% |
Feelings of Safety
Respondents were asked about their feelings of safety by mode of travel: “Please share how do you typically get around for daily travel and errands and how safe you feel while traveling in each of these ways.” They could answer this question by selecting multiple modes. Table C.8 shows how respondents travel throughout the region. In total, this question received 3,013 responses from 761 respondents.
Table C.8 | How Respondents Travel Through the Region
| How do you travel? |
Number of Responses |
Percentage of Total Respondents |
|---|---|---|
I drive in a car, SUV, or truck alone |
517 |
68% |
I carpool with other people |
197 |
26% |
I take transit (bus, subway/trolley, commuter rail) |
547 |
72% |
I take Paratransit |
38 |
5% |
I walk with a mobility aid |
42 |
6% |
I use a wheelchair |
13 |
2% |
I bike or use an e-bike |
447 |
59% |
I walk |
707 |
93% |
I ride a motorcycle, motorized scooter, or moped |
30 |
4% |
I take other micromobility options, such as an electric scooter, rollerblades, or skateboards |
47 |
6% |
I take a ridesharing service like Uber, Lyft, or taxis |
428 |
56% |
Total number of comments |
3,013 |
|
For each travel mode, Figure C.2 below illustrates the percentage of people who always feel safe, usually feel safe, usually feel unsafe, or always feel unsafe.
Of the 515 respondents who drove a personal vehicle only (car, SUV, or truck), the majority (87 percent) felt safe usually or always. This percentage of relative perception of safety is mirrored in the 197 respondents who carpool, of whom 86 percent felt usually or always safe.
The highest ratings for feelings of safety come from the 547 respondents who take transit, noting that 92 percent felt usually or always safe while using this mobility method. Of those who use paratransit (38 respondents), 84 percent also felt usually or always safe. The final mode that includes a majority of respondents who felt safe is walking (707 respondents), of whom 74 percent felt usually or always safe. Those who walk using a mobility aid (42 respondents) also felt usually or always safe (69 percent).
Meanwhile, of the 13 respondents who use a wheelchair, 46 percent said they either always or usually felt safe. Of the 30 respondents who drive a motorcycle, a majority felt usually or always unsafe (63 percent). The mode with the lowest feeling of safety was respondents who travel using a bike or e-bike (47 respondents), of whom the majority of 58 percent felt usually or always unsafe.
Of the responses recorded in the open-ended section of the survey, respondents were able to mention additional concerns about roadway safety. Several themes emerged throughout responses, including:
Figure C.2 | Feeling of Safety by Mode of Travel
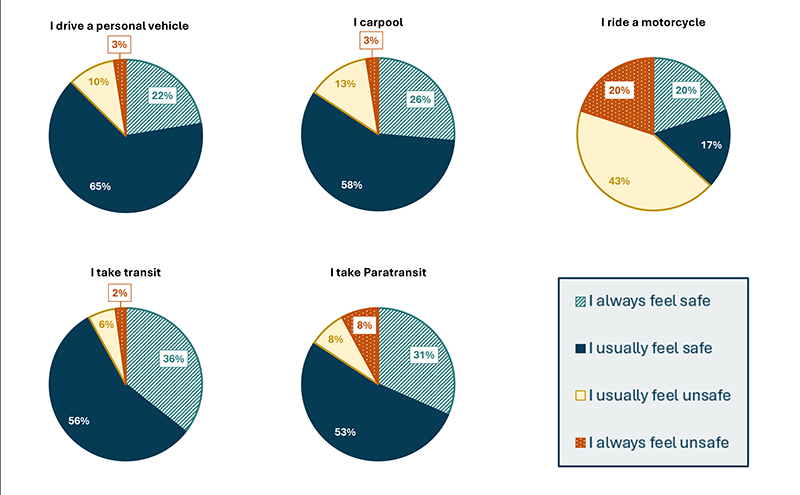
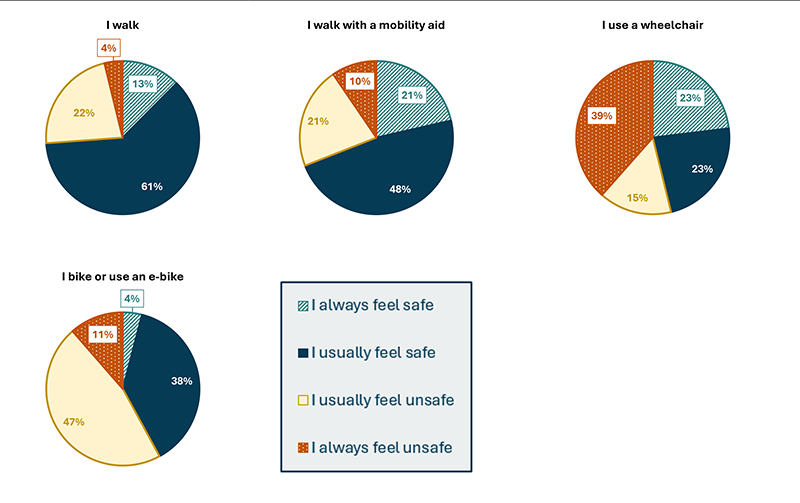
Barriers to Mode Changes
Respondents were also asked to identify barriers that prevented walking, bicycling, or taking transit to travel in the region. The largest barriers identified are concerns about traffic safety (e.g. traffic speed, distracted driving, etc.), lack of sidewalks and/or safe road crossings, and respondents who do not like walking or bicycling in bad weather. Of respondents with concerns about traffic safety, approximately 81 percent identified it as a somewhat, moderate, or an extreme barrier. Around 75 percent of respondents identified a lack of sidewalks and/or safe road crossings as a barrier of some level. Approximately 71 percent of respondents identified walking and bicycling in bad weather as a barrier.
The overwhelming majority of respondents did not identify “physical limitations1 that keep me from walking and/or bicycling,” concerns about personal safety (ex. being robbed), or lack of access to a bicycle as barriers. Every category of barrier is broken down by perceived barrier in Figure C.3.
Figure C.3 | Issues Preventing Walking, Bicycling, or Taking Transit More Often
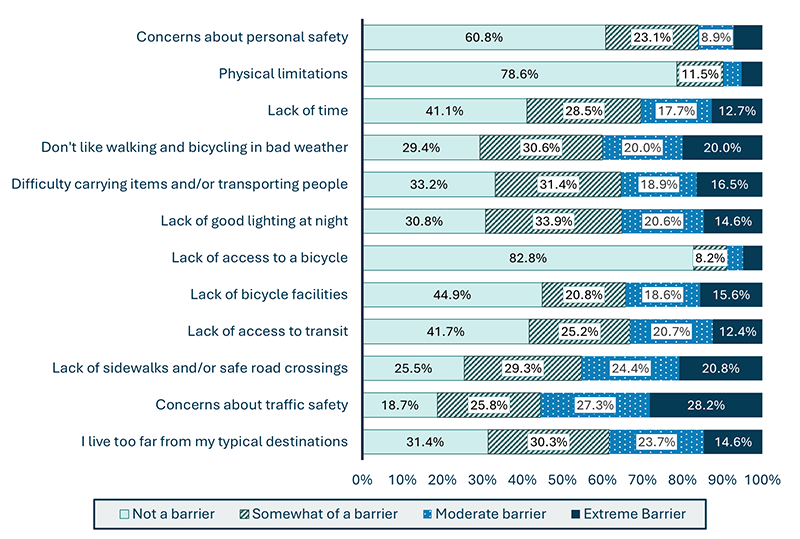
Driver Behavior
Several questions invited respondents to share their concerns about road safety for the region. Every respondent was asked about their concerns related to driver behavior region-wide, while concerns about specific road conditions or locations were asked for specific communities chosen by the respondents.
Respondents were asked to rank their highest road safety concerns regarding driver behavior on a scale from one to six, with one being the item of highest concern and six being the item of lowest concern. Distracted driving was the most often ranked number one concern for respondents, followed by aggressive driving and then speed. The average rating was very similar for drivers not stopping for people walking across the street and drivers passing too close to walkers or bicyclists on the road. Impaired driving was most often rated as the lowest concern. In Table C.9, a lower value is equal to a higher priority rating for road safety concerns.
Table C.9 | Average Rating of Top Road Safety Concerns on a Scale from One to Six
Top Road Safety Concerns |
Average Rating |
Priority Rank Scale |
Distracted driving |
2.31 |
1 |
Aggressive driving |
2.86 |
2 |
Speeding |
2.98 |
3 |
Drivers not stopping for people walking across the street |
4.02 |
4 |
Drivers passing too close to walkers or bicyclists on the road |
4.07 |
5 |
Impaired driving (e.g., drunk driving) |
4.76 |
6 |
Safety Concerns by Municipality
Respondents could identify concerns in specific communities, providing comments on as many communities in the region as they chose. Municipal-specific comments were considered as a part of the Key Takeaways. Comments for specific municipalities will also be incorporated into future safety analysis and strategy selection tasks, such as for the development of municipal safety profiles and projects.
Responses were submitted for 91 out of 97 municipalities (either as multiple-choice or write-in comments). Seventy-five municipalities received at least one write-in comment, overall totaling 1,694 individual write-in comments. Municipalities that received no multiple-choice or write-in responses included Boxborough, Hopkinton, Milford, Millis, Stow, and Wilmington. Table C.10 below lists the number of write-in comments received for each municipality.
Table C.10 | Number of Write-in Comments Received by Municipality
| Municipality |
Count |
|---|---|
Boston |
358 |
Cambridge |
187 |
Somerville |
120 |
Wellesley |
106 |
Brookline |
92 |
Melrose |
90 |
Arlington |
79 |
Lexington |
45 |
Malden |
45 |
Newton |
40 |
Medford |
36 |
Watertown |
30 |
Waltham |
29 |
Revere |
26 |
Bedford |
23 |
Everett |
22 |
Natick |
22 |
Beverly |
19 |
Belmont |
18 |
Needham |
17 |
Framingham |
16 |
Chelsea |
15 |
Acton |
13 |
Manchester |
13 |
Marblehead |
11 |
Burlington |
9 |
Canton |
9 |
Concord |
9 |
Dedham |
9 |
Milton |
9 |
Wakefield |
9 |
Danvers |
8 |
Hamilton |
8 |
Saugus |
8 |
Reading |
7 |
Woburn |
7 |
Holliston |
6 |
Ipswich |
6 |
Littleton |
6 |
Lynn |
6 |
Quincy |
6 |
Wayland |
6 |
Winthrop |
6 |
Essex |
5 |
Stoneham |
5 |
Topsfield |
5 |
Gloucester |
4 |
Hingham |
4 |
Lincoln |
4 |
Randolph |
4 |
Sudbury |
4 |
Wenham |
4 |
Ashland |
3 |
Braintree |
3 |
Carlisle |
3 |
Marlborough |
3 |
Maynard |
3 |
Peabody |
3 |
Rockport |
3 |
Salem |
3 |
Scituate |
3 |
Sherborn |
3 |
Walpole |
3 |
Weston |
3 |
Bellingham |
2 |
Winchester |
2 |
Bolton |
1 |
Cohasset |
1 |
Hudson |
1 |
Nahant |
1 |
Norwell |
1 |
Norwood |
1 |
Southborough |
1 |
Swampscott |
1 |
Westwood |
1 |
About the Safety Concerns Map
Purpose
The Boston Region Vision Zero Action Plan project team created an online interactive map to allow the public an opportunity to share locations in the Boston region where they feel unsafe getting around. Stakeholders are able to submit location-specific comments including identifying their mode of choice, the types of safety concerns they experience, and suggestions for short- or long-term improvements. Respondents may click on the map to drop a point at the location of their safety concern. Respondents may submit as many comment locations as they choose.
Analysis Timeframe
The online safety concerns map became available on the Boston Region Vision Zero Action Plan project website on October 17, 2024. The safety concerns map will remain available for public comment until the end of the project in June 2025 or later. The analysis conducted for this report included location-specific safety concerns data received between October 17, 2024, and April 2, 2025.
Recipients and Languages
The interactive map is accessible via the project website homepage. A link to the map was sent via several email newsletters to a total of 3,375 project stakeholders from each of the 97 municipalities in the region. Stakeholders on the list included municipal staff members like planners and engineers. Local elected officials, Community Based Organizations (CBOs), State and agency staff, community advocates, Chambers of Commerce were also included in the distribution, as well as members of the public who had subscribed to the Plan’s email list. Those who received the link were encouraged to share it with others. The community partners toolkit, which was shared with community-based organizations throughout the region, also included the link to the safety concerns map, encouraging these organizations to share with their members. The link was also shared at a Boston Vision Zero public meeting in January 2025.
The interactive map is available in seven languages: English, Spanish (Español), Brazilian Portuguese (Português), Vietnamese (Tiếng Việt), Traditional Chinese (漢語), Simplified Chinese (汉语), and Haitian Creole (Kreyòl Ayisyen).
Interactive Map Questions
The map survey contains following questions:
Summary of Safety Concerns Map Comments
The safety concerns map received a total of 921 comments identifying 3,952 safety concerns across the Boston Region between October 17, 2024, and April 2, 2025.
More than 80 percent of submissions addressed safety concerns experienced by people using active transportation modes, including walking or rolling, riding bicycles, or riding scooters (Table D.1). Only about 1 percent of all submissions addressed people’s experiences while riding public transit or motorcycles.
Table D.1 | Distribution of Submissions by Mode
Mode |
Number of Submissions |
Percentage of Total Submissions |
Bicycle/Scooter |
384 |
41.7% |
Walking/Rolling |
365 |
39.6% |
Vehicle |
110 |
11.9% |
Public Transit |
9 |
1.0% |
Motorcycle |
2 |
0.2% |
Other |
51 |
5.5% |
Total |
921 |
100.0% |
The survey offered respondents a list of 14 safety challenges to select from (with multiple selections allowed per submission). Respondents could also select “other” and submit write-in challenges. The listed safety challenges included:
Figure D.1 below shows a screenshot of all submitted comment locations on the safety concerns map, through April 2, 2025.
Figure D.1 | Image of Responses Tracked by the Interactive Map
Major Safety Concerns Across the Boston Region
A total of 3,952 safety concerns were identified across 921 submissions (an average of about four safety concerns per submission) in 55 municipalities. See Table D.2 below for a breakdown of safety challenges identified by transportation mode (both number of submissions and percentage share of total submissions by mode).
Driver behavior-related concerns were at the forefront of submissions across all modes:
The top roadway design issues identified by submissions across all modes included:
Many people identified multiple safety concerns in one submission. In 20 percent of submissions, respondents selected more than eight safety concerns (out of 14 options). Across the submissions, several common groupings of safety concerns were observed, such as people who selected issues related to bike lanes also selected drivers passing too close. As another example, people who identified vehicle speeding as a concern also identified aggressive driving and red light running.
Notably, the most common safety challenges for respondents riding a bicycle or scooter (384 total submissions) included:
The most common safety challenges identified by people walking or rolling (365 total submissions) included:
The top safety challenges for vehicle drivers (110 total submissions) included:
Table D.2 | Safety Challenges Identified (Number and Percentage Share) by Mode
Safety Challenge |
Bicycle/Scooter (384)1 |
Pedestrian (365)1 |
Vehicle (110)1 |
Public Transit |
Motorcycle (2)1 |
Other |
All Modes (921)1 |
% of Total |
||||||||||||
Speeding |
185 |
48% |
218 |
60% |
55 |
50% |
5 |
56% |
2 |
100% |
22 |
43% |
487 |
53% |
||||||
Aggressive, reckless, or distracted driving |
178 |
46% |
205 |
56% |
48 |
44% |
5 |
56% |
1 |
50% |
17 |
33% |
454 |
49% |
||||||
Bike lanes don’t exist or need improvement |
299 |
78% |
81 |
22% |
16 |
15% |
2 |
22% |
0% |
18 |
35% |
416 |
45% |
|||||||
Road design feels unsafe |
166 |
43% |
154 |
42% |
63 |
57% |
5 |
56% |
1 |
50% |
18 |
35% |
407 |
44% |
||||||
Drivers passing too close to walkers or bicyclists on the road |
205 |
53% |
147 |
40% |
23 |
21% |
4 |
44% |
0% |
12 |
24% |
391 |
42% |
|||||||
Difficult to cross street |
101 |
26% |
180 |
49% |
23 |
21% |
5 |
56% |
1 |
50% |
18 |
35% |
328 |
36% |
||||||
Poor or missing crosswalks |
37 |
10% |
136 |
37% |
15 |
14% |
4 |
44% |
0% |
17 |
33% |
209 |
23% |
|||||||
Sidewalks don’t exist or need improvement |
39 |
10% |
136 |
37% |
11 |
10% |
5 |
56% |
0% |
12 |
24% |
203 |
22% |
|||||||
Low visibility or lack of good lighting at night |
56 |
15% |
91 |
25% |
35 |
32% |
2 |
22% |
1 |
50% |
12 |
24% |
197 |
21% |
||||||
Trucks or large vehicles present |
98 |
26% |
61 |
17% |
18 |
16% |
4 |
44% |
1 |
50% |
9 |
18% |
191 |
21% |
||||||
Red light or stop sign running |
83 |
22% |
74 |
20% |
22 |
20% |
4 |
44% |
0% |
4 |
8% |
187 |
20% |
|||||||
Signs, signals, or pavement markings are missing or not working |
52 |
14% |
70 |
19% |
36 |
33% |
5 |
56% |
1 |
50% |
10 |
20% |
174 |
19% |
||||||
Pavement conditions |
69 |
18% |
38 |
10% |
5 |
5% |
4 |
44% |
0% |
6 |
12% |
122 |
13% |
|||||||
Poor drainage—ice/snow/water on the road/sidewalks |
17 |
4% |
13 |
4% |
3 |
3% |
2 |
22% |
0% |
1 |
2% |
36 |
4% |
|||||||
Other |
47 |
12% |
55 |
15% |
24 |
22% |
2 |
22% |
1 |
50% |
21 |
41% |
150 |
16% |
||||||
Total number of safety challenges identified for each mode |
1,632 |
|
1,659 |
|
397 |
|
58 |
|
9 |
|
197 |
|
3,952 |
|
||||||
1 Number of submissions by mode.
Major Safety Concerns by MPO Subregion and Municipalities
Among the eight subregions within the greater Boston area (see map of subregions below in Figure D.2), 69 percent of submissions (from the total of 921 submissions) were received for the ICC subregion, 13 percent for the MetroWest subregion, and remaining are split amongst the other six subregions (as listed in Figure D.2).
Figure D.2 | Map of Boston region MPO Subregions and Municipalities
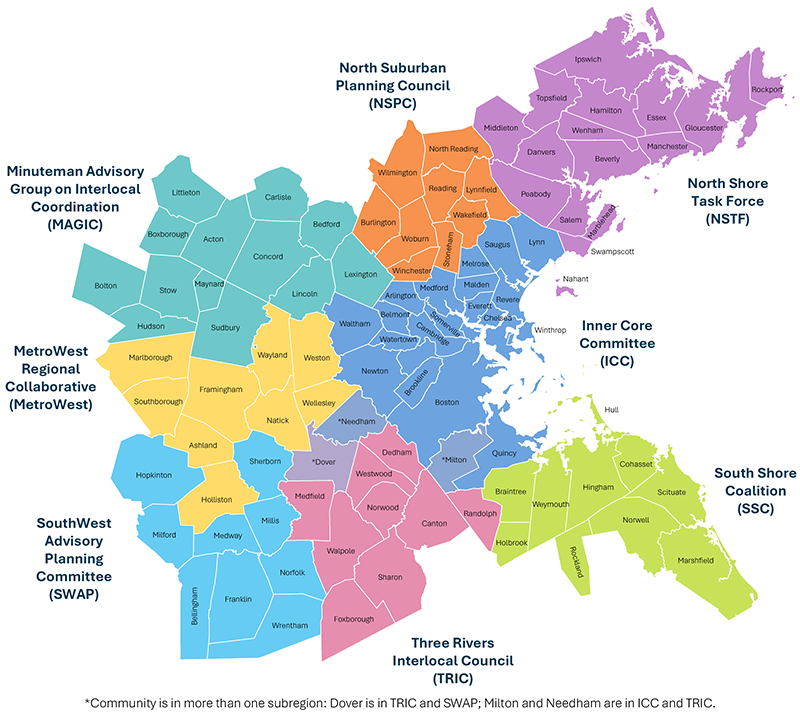
Table D.3 | Number of Submissions by MPO Subregion
Subregion |
Total Submissions1 |
Inner Core Committee (ICC) |
637 |
MetroWest Regional Collaborative (MetroWest) |
116 |
North Shore Task Force (NSTF) |
59 |
Minuteman Advisory Group on Interlocal Coordination (MAGIC) |
55 |
Three Rivers Interlocal Council (TRIC) |
44 |
SouthWest Advisory Planning Committee (SWAP) |
20 |
North Suburban Planning Council (NSPC) |
17 |
South Shore Coalition (SSC) |
1 |
Total |
921 |
1 Several municipalities (Needham and Milton) are a part of both the ICC and TRIC subregions and therefore any locations submissions within these municipalities are included in the subtotals for both ICC and TRIC.
Across the MPO subregions, speeding was identified as one of the top three concerns. Aggressive and reckless driving was one of the top three concerns in ICC, MetroWest, and MAGIC, while unsafe road design was one of the top three concerns in NSTF, NSPC, and SWAP. For more information on top safety concerns by MPO subregion, refer to Table D.6, Table D.7, Table D.8, Table D.9, Table D.10, and Table D.11 at the end of this report.
The submissions were received from 55 municipalities; Boston received the highest number of submissions (31 percent, 284 submissions), followed by Wellesley (10 percent, 95 submissions) and Brookline (6 percent, 54 submissions). Refer to Table D.4 for the list of municipalities from where submissions were received.
Table D.4 | Number of Submissions by Municipality
| Municipality |
# of submissions |
|---|---|
Boston |
284 |
Wellesley |
95 |
Brookline |
54 |
Cambridge |
45 |
Malden |
42 |
Somerville |
39 |
Melrose |
34 |
Medford |
29 |
Lexington |
23 |
Beverly |
20 |
Marblehead |
20 |
Sherborn |
17 |
Bedford |
16 |
Newton |
16 |
Natick |
15 |
Needham |
15 |
Revere |
14 |
Milton |
13 |
Stoneham |
11 |
Arlington |
10 |
Acton |
7 |
Dedham |
7 |
Everett |
7 |
Quincy |
7 |
Hamilton |
6 |
Salem |
6 |
Watertown |
6 |
Belmont |
5 |
Chelsea |
5 |
Concord |
5 |
Saugus |
5 |
Lynn |
4 |
Randolph |
4 |
Burlington |
3 |
Medfield |
3 |
Canton |
2 |
Danvers |
2 |
Holliston |
2 |
Maynard |
2 |
Medway |
2 |
Swampscott |
2 |
Waltham |
2 |
Wenham |
2 |
Winchester |
2 |
Ashland |
1 |
Framingham |
1 |
Hudson |
1 |
Hull |
1 |
Ipswich |
1 |
Lincoln |
1 |
Marlborough |
1 |
Millis |
1 |
Wayland |
1 |
Westwood |
1 |
Woburn |
1 |
Total |
921 |
Total |
55 |
Improvement Recommendations
When asked, 92 percent of submissions shared potential solutions they felt could address the identified safety concerns (Table D.5). About 57 percent of respondents thought that a short-term solution could be used to address their safety concerns (short-term was defined as a solution that could be implemented within five years), 16 percent of respondents thought that the solution for their safety concern required longer term implementation (long term was defined as a solution that would likely take greater than five years to implement), and 19 percent suggested both short- and long-term solutions could address their safety concerns.
Table D.5 | Number of Submissions with Suggestions for Improvement
Implementation Timeline for Improvement |
Percentage of Total Submissions |
No Suggestion |
7.7% |
Long-Term |
16.1% |
Short-Term |
57.4% |
Short- and Long-Term |
18.8% |
The majority of recommendations were related to providing improved bicycle and pedestrian infrastructure or improving roadway design. The most common recommendations are provided below, categorized based on major safety concerns, including vulnerable road users (pedestrians and bicyclists), vehicle speeding, intersections, lighting and signage, and other suggestions. Some improvement recommendations are broadly applicable and therefore are listed under multiple topics.
Data Tables: Safety Challenges Identified by Mode by MPO Subregion
The following summary tables break down identified safety challenges by MPO subregion (Table D.6, Table D.7, Table D.8, Table D.9, Table D.10, and Table D.11). “Number of submissions by mode” represents the number of location-specific comments that people submitted for a specific transportation mode. The next set of rows are the number of submissions for a particular mode that identified a specific safety concern; a submission could identify multiple concerns. For specific safety concerns, the % is the proportion of submissions by mode that identified that specific concern. The bottom row “Total number of safety challenges identified for each mode” identifies how many safety challenges were chosen across a particular mode’s submissions. For example, there were 315 submissions for bicycle/scooter mode for ICC subregion. These 315 submissions identified a total of 1,380 safety concerns; of those, aggressive, reckless, or distracted driving was identified in 160 of 315 bicycle/scooter submissions (51 percent).
For the ICC, MetroWest, NSTF, MAGIC, and TRIC subregions, each table lists the number of submissions and% of total submissions by transportation mode that identified a specific safety challenge. Each table also lists the total number of safety challenges identified by mode; participants could select multiple safety challenges within one submission, hence this value may be significantly higher than the total number of submissions.
The SWAP, NSPC, and SSC Subregions each received 20 or less total submissions, and therefore Table D.11 does not break down submissions and safety challenges by transportation mode.
Table D.6 shows the number and percentage of safety challenges identified by mode for Inner Core Committee (ICC) subregion. The ICC subregion received a total of 2,824 safety concerns identified across 637 submissions. The most frequently mentioned modes were bicycle/scooter (315 submissions), walking or rolling (248), and vehicle (34). The top three safety concerns across the subregion were aggressive, reckless, or distracted driving (54 percent), speeding (53 percent), and missing bike lanes (49 percent). However, the top concerns differed a little across the modes. For bicycle/scooter users, the top concerns were missing bike lanes (78 percent) and drivers passing too close to bicyclists (54 percent). For pedestrians, the top concerns were aggressive, reckless, or distracted driving (61 percent), speeding (60 percent), and difficult to cross street (52 percent). For vehicles, unsafe road design was the top concern (65 percent).
Table D.6 | Safety Challenges Identified (Number and Percentage Share) by Mode—Inner Core Committee
| Safety Challenge Experienced by Mode |
Bicycle/Scooter (315)1 |
Pedestrian (248)1 |
Vehicle |
Public Transit (7)1 |
Motorcycle (1)1 |
Other |
All Modes (637)1 |
|||||||
|---|---|---|---|---|---|---|---|---|---|---|---|---|---|---|
Aggressive, reckless, or distracted driving |
160 |
51% |
152 |
61% |
19 |
56% |
4 |
57% |
0% |
8 |
25% |
343 |
54% |
|
Speeding |
156 |
50% |
149 |
60% |
19 |
56% |
3 |
43% |
1 |
100% |
9 |
28% |
337 |
53% |
Bike lanes don’t exist or need improvement |
247 |
78% |
52 |
21% |
6 |
18% |
1 |
14% |
0% |
9 |
28% |
315 |
49% |
|
Road design feels unsafe |
144 |
46% |
111 |
45% |
22 |
65% |
4 |
57% |
0% |
9 |
28% |
290 |
46% |
|
Drivers passing too close to walkers or bicyclists on the road |
169 |
54% |
98 |
40% |
9 |
26% |
3 |
43% |
0% |
6 |
19% |
285 |
45% |
|
Difficult to cross street |
79 |
25% |
128 |
52% |
8 |
24% |
4 |
57% |
0% |
10 |
31% |
229 |
36% |
|
Red light or stop sign running |
78 |
25% |
65 |
26% |
8 |
24% |
3 |
43% |
0% |
2 |
6% |
156 |
24% |
|
Trucks or large vehicles present |
87 |
28% |
40 |
16% |
5 |
15% |
3 |
43% |
|
0% |
4 |
13% |
139 |
22% |
Poor or missing crosswalks |
29 |
9% |
91 |
37% |
5 |
15% |
3 |
43% |
0% |
9 |
28% |
137 |
22% |
|
Low visibility or lack of good lighting at night |
48 |
15% |
65 |
26% |
11 |
32% |
2 |
29% |
1 |
100% |
4 |
13% |
131 |
21% |
Signs, signals, or pavement markings are missing or not working |
47 |
15% |
53 |
21% |
7 |
21% |
5 |
71% |
0% |
4 |
13% |
116 |
18% |
|
Sidewalks don’t exist or need improvement |
25 |
8% |
76 |
31% |
4 |
12% |
3 |
43% |
0% |
7 |
22% |
115 |
18% |
|
Pavement conditions |
61 |
19% |
30 |
12% |
3 |
9% |
4 |
57% |
0% |
4 |
13% |
102 |
16% |
|
Poor drainage—ice/snow/water on the road/sidewalks |
12 |
4% |
7 |
3% |
2 |
6% |
2 |
29% |
0% |
1 |
3% |
24 |
4% |
|
Other |
38 |
12% |
39 |
16% |
8 |
24% |
1 |
14% |
1 |
100% |
18 |
56% |
105 |
16% |
Total number of safety challenges identified for each mode |
1,380 |
|
1,156 |
|
136 |
|
45 |
|
3 |
|
104 |
|
2,824 |
|
1 Number of submissions by mode.
Table D.7 shows the number and percentage of safety challenges identified by mode for MetroWest Regional Collaborative (MetroWest) subregion. The MetroWest subregion received a total of 389 safety concerns identified across 116 submissions. The most frequently mentioned modes were walking (50 submissions), vehicle (41), and bicycle/scooter (17). The top three safety concerns across the subregion were speeding (47 percent); aggressive, reckless, or distracted driving (41 percent); and drivers passing too close to walkers or bicyclists on the road (34 percent). However, the top concerns varied for vehicles and bicycle/scooter users. For vehicles, unsafe road design was the top concern (46 percent). For bicycle/scooter users, the top concern was missing bike lanes (76 percent).
Table D.7 | Safety Challenges Identified (Number and Percentage Share) by Mode—MetroWest Regional Collaborative
| Safety Challenge Experienced by Mode |
Bicycle/Scooter (17)1 |
Pedestrian (50)1 |
Vehicle |
Public Transit |
Motorcycle (1)1 |
Other |
All Modes (116)1 |
|||||||
|---|---|---|---|---|---|---|---|---|---|---|---|---|---|---|
Speeding |
6 |
35% |
27 |
54% |
17 |
41% |
1 |
100% |
1 |
100% |
2 |
33% |
54 |
47% |
Aggressive, reckless, or distracted driving |
4 |
24% |
24 |
48% |
15 |
37% |
1 |
100% |
1 |
100% |
3 |
50% |
48 |
41% |
Drivers passing too close to walkers or bicyclists on the road |
9 |
53% |
21 |
42% |
6 |
15% |
1 |
100% |
|
0% |
2 |
33% |
39 |
34% |
Road design feels unsafe |
3 |
18% |
12 |
24% |
19 |
46% |
1 |
100% |
1 |
100% |
2 |
33% |
38 |
33% |
Bike lanes don’t exist or need improvement |
13 |
76% |
9 |
18% |
5 |
12% |
1 |
100% |
|
0% |
3 |
50% |
31 |
27% |
Difficult to cross street |
3 |
18% |
18 |
36% |
6 |
15% |
1 |
100% |
1 |
100% |
2 |
33% |
31 |
27% |
Sidewalks don’t exist or need improvement |
4 |
24% |
18 |
36% |
1 |
2% |
1 |
100% |
|
0% |
1 |
17% |
25 |
22% |
Low visibility or lack of good lighting at night |
1 |
6% |
9 |
18% |
12 |
29% |
|
0% |
|
0% |
1 |
17% |
23 |
20% |
Poor or missing crosswalks |
2 |
12% |
15 |
30% |
4 |
10% |
1 |
100% |
|
0% |
1 |
17% |
23 |
20% |
Signs, signals, or pavement markings are missing or not working |
1 |
6% |
4 |
8% |
12 |
29% |
|
0% |
1 |
100% |
1 |
17% |
19 |
16% |
Red light or stop sign running |
2 |
12% |
6 |
12% |
7 |
17% |
1 |
100% |
|
0% |
|
0% |
16 |
14% |
Trucks or large vehicles present |
1 |
6% |
5 |
10% |
3 |
7% |
1 |
100% |
1 |
100% |
1 |
17% |
12 |
10% |
Pavement conditions |
1 |
6% |
2 |
4% |
|
0% |
|
0% |
|
0% |
|
0% |
3 |
3% |
Poor drainage—ice/snow/water on the road/sidewalks |
|
0% |
2 |
4% |
1 |
2% |
|
0% |
|
0% |
|
0% |
3 |
3% |
Other |
3 |
18% |
8 |
16% |
10 |
24% |
1 |
100% |
|
0% |
2 |
33% |
24 |
21% |
Total number of safety challenges identified for each mode |
53 |
|
180 |
|
118 |
|
11 |
|
6 |
|
21 |
|
389 |
|
1 Number of submissions by mode.
Table D.8 shows the number and percentage share of safety challenges identified by mode for the North Shore Task Force (NSTF) subregion. The NSTF subregion received a total of 303 safety concerns identified across 59 submissions. The modes identified across the submissions were walking (23 submissions), bicycle/scooter (16), vehicle (13), and other modes (7). There were no submissions for public transit or motorcycle modes. The top safety concerns across the subregion were speeding (61 percent), unsafe road design (54 percent), difficult to cross street (51 percent), and drivers passing too close to walkers or bicyclists on the road (51 percent). For pedestrians, missing sidewalks (57 percent) was one of the top concerns, and for bicycle/scooter users, missing bike lanes (75 percent) was one of the top concerns.
Table D.8 | Safety Challenges Identified (Number and Percentage Share) by Mode—North Shore Task Force
| Safety Challenge Experienced by Mode |
Bicycle/Scooter (16)1 |
Pedestrian |
Vehicle |
Other |
All Modes |
|||||
|---|---|---|---|---|---|---|---|---|---|---|
Speeding |
9 |
56% |
15 |
65% |
6 |
46% |
6 |
86% |
36 |
61% |
Road design feels unsafe |
9 |
56% |
12 |
52% |
6 |
46% |
5 |
71% |
32 |
54% |
Difficult to cross street |
6 |
38% |
13 |
57% |
6 |
46% |
5 |
71% |
30 |
51% |
Drivers passing too close to walkers or bicyclists on the road |
12 |
75% |
12 |
52% |
3 |
23% |
3 |
43% |
30 |
51% |
Bike lanes don’t exist or need improvement |
12 |
75% |
7 |
30% |
3 |
23% |
5 |
71% |
27 |
46% |
Aggressive, reckless, or distracted driving |
5 |
31% |
10 |
43% |
5 |
38% |
4 |
57% |
24 |
41% |
Sidewalks don’t exist or need improvement |
4 |
25% |
13 |
57% |
2 |
15% |
3 |
43% |
22 |
37% |
Low visibility or lack of good lighting at night |
3 |
19% |
10 |
43% |
3 |
23% |
5 |
71% |
21 |
36% |
Poor or missing crosswalks |
3 |
19% |
10 |
43% |
3 |
23% |
4 |
57% |
20 |
34% |
Trucks or large vehicles present |
3 |
19% |
6 |
26% |
4 |
31% |
4 |
57% |
17 |
29% |
Signs, signals, or pavement markings are missing or not working |
2 |
13% |
4 |
17% |
7 |
54% |
3 |
43% |
16 |
27% |
Pavement conditions |
4 |
25% |
6 |
26% |
2 |
15% |
2 |
29% |
14 |
24% |
Red light or stop sign running |
1 |
6% |
0 |
0% |
5 |
38% |
1 |
14% |
7 |
12% |
Poor drainage—ice/snow/water on the road/sidewalks |
3 |
19% |
1 |
4% |
0 |
0% |
0 |
0% |
4 |
7% |
Other |
0 |
0% |
2 |
9% |
1 |
8% |
0 |
0% |
3 |
5% |
Total number of safety challenges identified for each mode |
76 |
|
121 |
|
56 |
|
50 |
|
303 |
|
1 Number of submissions by mode.
Table D.9 shows the number and percentage of safety challenges identified by mode for the Minuteman Advisory Group on Interlocal Coordination (MAGIC) subregion. The MAGIC subregion received a total of 193 safety concerns identified across 55 submissions. The most frequently mentioned modes were walking (21 submissions), bicycle/scooter (18), and vehicle (10). The top three safety concerns across the subregion were speeding (58 percent), drivers passing too close to walkers or bicyclists on the road (36 percent), and aggressive, reckless, or distracted driving (33 percent). For pedestrians and bicycle/scooter users, missing sidewalks (52 percent) and missing bike lanes (61 percent) were one of the top three concerns respectively.
Table D.9 | Safety Challenges Identified (Number and Percentage Share) by Mode—Minuteman Advisory Group on Interlocal Coordination
| Safety Challenge Experienced by Mode |
Bicycle/Scooter (18)1 |
Pedestrian (21)1 |
Vehicle |
Public Transit (1)1 |
Other |
All Modes |
||||||
|---|---|---|---|---|---|---|---|---|---|---|---|---|
Speeding |
8 |
44% |
13 |
62% |
5 |
50% |
1 |
100% |
5 |
100% |
32 |
58% |
Drivers passing too close to walkers or bicyclists on the road |
11 |
61% |
7 |
33% |
1 |
10% |
0 |
0% |
1 |
20% |
20 |
36% |
Aggressive, reckless, or distracted driving |
5 |
28% |
8 |
38% |
3 |
30% |
0 |
0% |
2 |
40% |
18 |
33% |
Sidewalks don’t exist or need improvement |
3 |
17% |
11 |
52% |
1 |
10% |
1 |
100% |
1 |
20% |
17 |
31% |
Bike lanes don’t exist or need improvement |
11 |
61% |
4 |
19% |
|
0% |
0 |
0% |
1 |
20% |
16 |
29% |
Road design feels unsafe |
4 |
22% |
6 |
29% |
5 |
50% |
0 |
0% |
1 |
20% |
16 |
29% |
Low visibility or lack of good lighting at night |
1 |
6% |
6 |
29% |
3 |
30% |
0 |
0% |
2 |
40% |
12 |
22% |
Poor or missing crosswalks |
1 |
6% |
7 |
33% |
1 |
10% |
0 |
0% |
3 |
60% |
12 |
22% |
Difficult to cross street |
|
|
|
|
|
|
0 |
|
|
|
|
|
Signs, signals, or pavement markings are missing or not working |
2 |
11% |
7 |
33% |
1 |
10% |
0 |
0% |
|
0% |
10 |
18% |
Trucks or large vehicles present |
1 |
6% |
3 |
14% |
4 |
40% |
0 |
0% |
2 |
40% |
10 |
18% |
Red light or stop sign running |
4 |
22% |
2 |
10% |
2 |
20% |
0 |
0% |
|
0% |
8 |
15% |
Poor drainage—ice/snow/water on the road/sidewalks |
1 |
6% |
2 |
10% |
2 |
20% |
0 |
0% |
1 |
20% |
6 |
11% |
Pavement conditions |
2 |
11% |
1 |
5% |
|
0% |
0 |
0% |
|
0% |
3 |
5% |
Other |
2 |
11% |
|
0% |
|
0% |
0 |
0% |
|
0% |
2 |
4% |
Total number of safety challenges identified for each mode |
59 |
|
80 |
|
33 |
|
2 |
|
19 |
|
193 |
|
1 Number of submissions by mode.
Table D.10 shows the number and percentage of safety challenges identified by mode for the Three Rivers Interlocal Council (TRIC) subregion. The TRIC subregion received a total of 135 safety concerns identified across 44 submissions. The modes identified across the submissions were bicycle/scooter (21 submissions), walking (20), vehicle (2), and other modes (1). There were no submissions for public transit or motorcycle modes. The top three safety concerns across the subregion were missing bike lanes (59 percent), difficult to cross street (59 percent), and speeding (39 percent). For bicycle/scooter users, missing bike lanes (95 percent) was the top concern.
Table D.10 | Safety Challenges Identified (Number and Percentage Share) by Mode—Three Rivers Interlocal Council
| Safety Challenge Experienced by Mode |
Bicycle/Scooter (21)1 |
Pedestrian |
Vehicle |
Other |
All Modes |
|||||
|---|---|---|---|---|---|---|---|---|---|---|
Bike lanes don’t exist or need improvement |
20 |
95% |
5 |
25% |
1 |
50% |
0 |
0% |
26 |
59% |
Difficult to cross street |
14 |
67% |
10 |
50% |
1 |
50% |
1 |
100% |
26 |
59% |
Speeding |
6 |
29% |
9 |
45% |
2 |
100% |
0 |
0% |
17 |
39% |
Road design feels unsafe |
4 |
19% |
6 |
30% |
1 |
50% |
1 |
100% |
12 |
27% |
Aggressive, reckless, or distracted driving |
2 |
10% |
7 |
35% |
0 |
0% |
0 |
0% |
9 |
20% |
Drivers passing too close to walkers or bicyclists on the road |
3 |
14% |
4 |
20% |
1 |
50% |
0 |
0% |
8 |
18% |
Poor or missing crosswalks |
1 |
5% |
6 |
30% |
1 |
50% |
0 |
0% |
8 |
18% |
Sidewalks don’t exist or need improvement |
1 |
5% |
5 |
25% |
1 |
50% |
0 |
0% |
7 |
16% |
Low visibility or lack of good lighting at night |
1 |
5% |
1 |
5% |
2 |
100% |
0 |
0% |
4 |
9% |
Trucks or large vehicles present |
1 |
5% |
1 |
5% |
1 |
50% |
0 |
0% |
3 |
7% |
Pavement conditions |
0 |
0% |
1 |
5% |
0 |
0% |
0 |
0% |
1 |
2% |
Red light or stop sign running |
0 |
0% |
1 |
5% |
0 |
0% |
0 |
0% |
1 |
2% |
Poor drainage—ice/snow/water on the road/sidewalks |
1 |
5% |
0 |
0% |
0 |
0% |
0 |
0% |
1 |
2% |
Signs, signals, or pavement markings are missing or not working |
1 |
5% |
0 |
0% |
0 |
0% |
0 |
0% |
1 |
2% |
Other |
2 |
10% |
8 |
40% |
0 |
0% |
1 |
100% |
11 |
25% |
Total number of safety challenges identified for each mode |
57 |
|
64 |
|
11 |
|
3 |
|
135 |
|
1 Number of submissions by mode.
Table D.11 shows the number and percentage of safety challenges identified for the SouthWest Advisory Planning Committee (SWAP), North Suburban Planning Council (NSPC), and South Shore Coalition (SSC) subregions. The SWAP, NSPC, and SSC received a total of 20, 17, and one submission respectively.
The modes identified across the submissions for SWAP were walking (9 submissions), vehicle (8), and bicycle/scooter (3). For SWAP, the top three safety concerns were unsafe road design (65 percent); speeding (60 percent); and missing signs, signals, or pavement markings (55 percent).
The modes identified across the submissions for NSPC were walking (8 submissions), bicycle/scooter (6), and vehicle (3). For NSPC, the top three safety concerns were unsafe road design (76 percent), speeding (65 percent), and missing sidewalks (59 percent).
For SSC, only one submission for walking was submitted.
There were no submissions for motorcycle or public transit modes for any of these subregions.
Table D.11 | Safety Challenges Identified (Number and Percentage Share) in SouthWest Advisory Planning Committee, North Suburban Planning Council, and South Shore Coalition Subregions
| Safety Challenge Experienced by Mode |
SWAP (20)1 |
NSPC (17)1 |
SSC (1)1 |
|||
|---|---|---|---|---|---|---|
Road design feels unsafe |
13 |
65% |
13 |
76% |
1 |
100% |
Speeding |
12 |
60% |
11 |
65% |
1 |
100% |
Aggressive, reckless, or distracted driving |
10 |
50% |
8 |
47% |
1 |
100% |
Sidewalks don’t exist or need improvement |
10 |
50% |
10 |
59% |
1 |
100% |
Poor or missing crosswalks |
8 |
40% |
6 |
35% |
1 |
100% |
Bike lanes don’t exist or need improvement |
5 |
25% |
9 |
53% |
– |
0% |
Difficult to cross street |
6 |
30% |
8 |
47% |
1 |
100% |
Drivers passing too close to walkers or bicyclists on the road |
7 |
35% |
7 |
41% |
1 |
100% |
Low visibility or lack of good lighting at night |
6 |
30% |
3 |
18% |
– |
0% |
Trucks or large vehicles present |
8 |
40% |
5 |
29% |
– |
0% |
Pavement conditions |
– |
0% |
1 |
6% |
– |
0% |
Red light or stop sign running |
1 |
5% |
1 |
6% |
– |
0% |
Poor drainage—ice/snow/water on the road/sidewalks |
1 |
5% |
1 |
6% |
– |
0% |
Signs, signals, or pavement markings are missing or not working |
11 |
55% |
1 |
6% |
1 |
100% |
Other |
1 |
5% |
2 |
12% |
– |
0% |
Total number of safety challenges identified |
99 |
|
86 |
|
8 |
|
1 Number of submissions by mode.
On January 29, 2025, the Boston Region MPO hosted a virtual Public Forum via Zoom at 6:00 p.m. The Public Forum included a presentation about the Vision Zero Action Plan and the region’s traffic safety data. It also allowed the project team to hear the perspectives of people who live, work, or commute through the region on roadway safety challenges they face and concerns they have. The Public Forum had 37 attendees including members of the general public and those representing organizations such as the Massachusetts Bay Transportation Authority (MBTA), municipal government, and local pedestrian and bicycle advisory committees, among others.
The Public Forum started with a Zoom poll asking participants to identify how they typically get around for daily travel and errands. Out of the 37 attendees, 19 participants regularly walk, 16 participants take transit, 11 participants bike, and 10 participants drive. Following the polling activity, the project team provided an overview of the Vision Zero Action Plan and presented roadway safety data for the Boston MPO region, including crash statistics and the High Injury Network (HIN). At the conclusion of the presentation, attendees were divided into small groups for breakout discussions.
Attendees were divided into three breakout discussion groups for a total of thirty minutes, in which facilitators asked the following questions:
Breakout group #1 identified driving speeds, safe pedestrian and bike infrastructure including safe road crossing points, and slow fixes due to permitting review and historic designations or commissions as the main transportation safety concerns. To address these issues, participants identified that it would be helpful to have ways to more quickly deploy fixes, such as paint, signage, and other quick-build solutions. Participants would also like to see increased aid for local fixes and automated speed enforcement. Additionally, they noted that safety culture starts in schools, and they would like to see more driver re-education.
Breakout group #2 identified several suggestions to improve transportation safety in the region. The top safety concerns identified by participants included speeding and large vehicle sizes. Additionally, the importance of connections between bike trails, destinations, and other locations was discussed. Suggestions to improve safety included continuing education for licensed drivers, increasing enforcement (include automated speed enforcement), lowering speed limits, and infrastructure changes such as separated bike lanes.
Breakout group #3 identified speeding (by cars and e-bikes), cars running red lights, large vehicle size, and driving lane width as the main transportation safety concerns. Suggestions to improve safety included better roadway design that slows vehicles down and provides dedicated space for pedestrians and cyclists, along with education campaigns and automated speed enforcement. One member also suggested engaging the public in walk audits for education and awareness.
At the conclusion of the breakout discussions, all attendees rejoined the main room and facilitators provided a debrief of their discussions.
Breakout Group #1 Debrief:
Breakout Group #2 Debrief:
Breakout Group #3 Debrief:
The following describes the question-and-answer session: in which attendees posted questions in the Zoom Q+A feature and asked questions verbally:
1 Of the 417 respondents who answered the demographic questions, 63 respondents identified as having a disability. The question did not specify whether the disability affects daily travel experience, mobility, or creates physical limitations for the respondent.