The Boston region’s Vision Zero Action Plan is focused on improving locations on the roadway network where serious crashes have occurred and where there is a significant risk of more crashes occurring in the future. These locations are mapped as High-Injury and High-Risk Networks (HIN and HRN) in the Action Plan. To address some of the highest crash and highest risk locations on these networks, the Boston Region Metropolitan Planning Organization (MPO) has collaborated with seven municipalities from across the region to develop targeted safety countermeasure toolboxes that can inform strategies and serve as guidance for other municipalities facing similar roadway safety challenges.
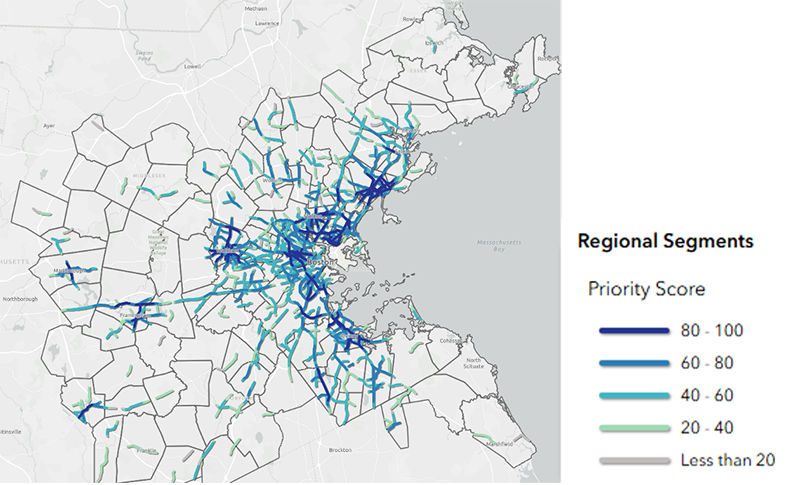
Safety countermeasure toolboxes were developed for locations selected from an initial list of the top 100 highest scoring corridors of the regional High-Injury Network. Geospatial analysis of the HIN showed that the top 100 corridors had a priority score of 77 or greater. Figure 1 shows the priority scoring breakdown of the regional HIN. Appendix C of the Vision Zero Action Plan includes the full methodology for developing the HIN.
Figure 1
Regional High-Injury Network and Priority Segment Scoring
From the list of top priority corridors, the MPO staff focused on roadway segments with the following attributes:
This process resulted in a list of 26 corridors in 12 municipalities. The MPO staff also selected a corridor and three intersections from the regional High-Risk Network.
Over six months, the MPO staff worked with seven municipalities to do in-depth safety analysis, create a safety countermeasure toolbox to address both corridor-wide and site-specific safety challenges, and develop a series of solutions that can be applied in specific high-crash and high-risk locations. Prioritized locations and their high-crash and high-risk data are summarized in Table 1.
Table 1
Selected High-Injury and High-Risk Locations
| Municipality |
Corridor |
Corridor/Intersections Extents |
Regional HIN Score |
High-Risk Element |
|---|---|---|---|---|
Marlborough |
Bolton Street (State Route 85) |
Hudson Street to Main Street (north of Granger Boulevard) |
86 |
High-risk intersection at Main Street, Union Street, and Lincoln Street |
Newton |
Beacon Street |
Tudor Road to Centre Street |
76 |
High risk for vulnerable road users; high-risk intersection at Beacon and Summer Streets/Langley Road and Centre Street |
Milton and Quincy |
Squantum Street |
Granite Avenue to Quincy line (before London Avenue) |
92 |
High risk for large vehicles, lane departure; high-risk intersection at Squantum Street and Granite Avenue |
Swampscott and Lynn |
Essex Street |
Bessom Street (in Lynn) to Swampscott Mall Driveway (in Swampscott) |
94 |
High risk for large vehicles |
Hingham |
Main Street |
North Street to Water Street/Garrison Street |
NA |
High risk for lane departure crashes and intersection crashes involving vulnerable road users |
Hingham |
Three Intersections |
High Street at Ward/French Street Main Street at Cushing/South Pleasant Street |
NA |
High risk for speeding, lane departure, and intersection crashes |
HIN = High-Injury Network. NA = not applicable.
Source: Boston Region MPO.
Table 2 summarizes some of the key operational and land use details of each of the prioritized locations.
Table 2
Key Operational and Land Use Details of Prioritized Locations
| Corridor / Location |
Length |
Functional Classification |
Posted Speed Limit |
Land Use |
Transit |
|---|---|---|---|---|---|
Bolton Street (State Route 85) / Marlborough |
1.1 miles |
Minor Arterial |
25 and 35 mph |
Schools, single family residential, police station |
MetroWest Regional Transit Authority bus service |
Beacon Street / Newton |
0.97 miles |
Principal Arterial |
25, 30, and 35 mph |
Commercial, single and multifamily residential, gas stations, restaurants, historic sites |
No bus service; Access to Green Line D Branch Newton Centre MBTA stop |
Squantum Street / Milton and Quincy |
0.4 miles |
Minor Arterial |
25 and 30 mph |
Single family residential, parks, elementary school |
MBTA rapid transit station and bus service |
Essex Street / Swampscott and Lynn |
1.3 miles |
Minor Arterial |
20 and 30 mph |
Single and multifamily residential, small business, high school, parks, quarry, shopping mall |
MBTA commuter rail station and bus service |
Main Street / Hingham |
0.8 miles |
Minor Arterial |
25 and 30 mph |
Commercial, single family residential, religious |
MBTA bus service |
High Street at Ward and French Streets / Hingham |
NA |
High Street: Minor Arterial
Ward and French Streets: Collectors |
30 mph |
Single family residential, commercial service |
MBTA bus |
Main Street at South Pleasant and Cushing Streets / Hingham |
NA |
Main Street: Minor Arterial
South Pleasant and Cushing Streets: Collectors |
30 mph |
Single family residential, parks and recreation, elementary school |
None |
Note: All of the roadways listed in the table have two lanes—one lane in each direction.
NA = not applicable. mph = miles per hour.
Source: Boston Region MPO.
The MPO staff facilitated in-person safety assessments. At the assessments, participants reviewed crash trends and discussed personal experiences and perspectives about the corridors. The study team led walking audits of the corridors and intersections, stopping at selected locations to observe safety issues and discuss crash patterns.
The audit participants offered a variety of perspectives about safety issues and potential interventions for the corridors and intersections. Viewpoints included those from engineering, public works, police, fire, and community development/planning departments, and from municipal elected officials and school department leadership.
As illustrated in Table 2, the MPO staff found that these high-priority locations had a number of shared attributes:
The safety analysis and safety assessments revealed similar challenges among these locations:
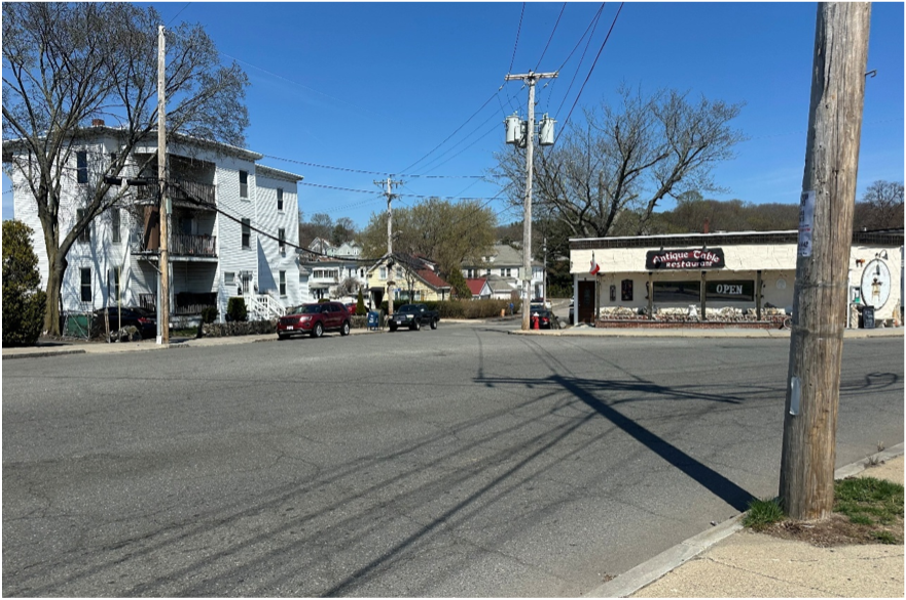
Figure 2 shows existing conditions at a particularly wide intersection at Cherry Street and Essex Street in Lynn.
Figure 2
Wide Intersection Geometry at the Cherry Street and Essex Street Intersection in Lynn, Massachusetts
Based on the common safety issues identified across these priority high-crash and high risk locations, the MPO staff developed a safety countermeasures toolbox that can serve as guidance for municipalities to address common challenges with systemic, low-cost, high-impact solutions.
Table 3
Safety Countermeasures Toolbox
| Safety Issue |
Countermeasure |
Crash Reduction Factor |
Timeframe for Implementation |
Cost |
|---|---|---|---|---|
Speeding |
Narrow vehicle travel lanes to 10 or 11 feet |
42% reduction |
Short-term |
Low |
Speeding |
Install speed cushions or speed humps |
40% reduction |
Mid-term |
Medium |
Speeding |
Install speed feedback signs |
NA |
Short-term |
Low |
Intersection Geometry |
Reduce corner radii and harden corners at intersections |
30% reduction |
Short-term to Mid-term |
Low to Medium |
Intersection Geometry |
Implement centerline hardening (quick-build) |
NA |
Short-term |
Low |
Pavement Markings and Signage |
Refresh and add crosswalks, stop bars, and lane lines with high-visibility paint |
40% reduction |
Short-term |
Low |
Pedestrian Accommodations |
Install rectangular rapid flashing beacons at crosswalks |
47% reduction |
Short-term |
Low |
Pedestrian Accommodations |
Install curb extensions or pedestrian refuge islands at midblock crossings |
30% reduction 56% reduction |
Short-term |
Low |
Pedestrian Accommodations |
Add advanced signage and pavements markings before midblock crosswalks |
25% reduction |
Short-term |
Low |
Pedestrian Accommodations |
Install pedestrian refuge islands at mid-block crossings |
56% reduction |
Mid-Term to Long-Term |
Medium to High |
Pedestrian Accommodations |
Install raised crosswalks |
36% reduction |
Short-Term to Long-Term |
Medium to High |
Traffic Signals |
Add retroreflective backplates to signal heads |
15% reduction |
Short-Term to Mid-Term |
Low to Medium |
Traffic Signals |
Add Leading Pedestrian Intervals (LPIs) |
13% reduction |
Short-Term |
Low |
Bicycle Accommodations |
Implement separated or protected bicycle lanes |
31–45% reduction |
Mid-Term |
Medium to High |
Lighting |
Install pedestrian-scale lighting at crosswalks and intersections |
33% reduction |
Mid-term |
Medium |
Note:
Time frame years:
Cost range dollar amounts:
NA = not applicable.
Sources: Boston Region MPO; Massachusetts Department of Transportation Construction Project Estimator; Federal Highway Administration Proven Safety Countermeasures; Crash Modification Factor Clearinghouse; and Oregon Department of Transportation, Crash Reduction Factor Manual.
Through these efforts, the Boston Region MPO staff developed a process for conducting further analysis on high-priority corridors and for coordinating with municipalities to develop interventions. We identified common safety challenges and developed a toolbox of proven interventions that can be implemented at high-crash and high-risk locations throughout the region. The MPO staff will continue to work with municipalities to help apply this safety toolbox to address priority systemic and site-specific safety challenges.