TECHNICAL MEMORANDUM


DATE:   September 4, 2025

TO:         John Cashell, City of Woburn

FROM:   Kyle Casiglio, Boston Region MPO

RE:         Multimodal Mobility Infrastructure Program: Woburn Intersection Study


This memorandum summarizes analyses and improvement strategies for the intersection of Commerce Way/Presidential Way, Atlantic Avenue, and the Interstate 93 (I-93) Exit 30 ramps.


This memorandum also includes technical appendices that contain data and methods applied in the study.


Study Background

The Boston Region Metropolitan Planning Organization (MPO) conducts studies of intersections with safety and mobility concerns as part of the Multimodal Mobility Infrastructure Program. The outcome of these studies is recommended improvements that focus on all roadway users within a Complete Streets framework, including people walking, biking, driving, using assistive mobility devices, and taking transit. Municipalities in the region and the Massachusetts Department of Transportation (MassDOT) have been receptive to these studies, which provide the opportunity to review conceptual options to improve a specific intersection before committing design and engineering funds to a project. If a proponent initiates a project that qualifies for state and federal funds, the study’s documentation may be useful to both MassDOT and the project proponent for completing MassDOT Highway Division’s project initiation forms, identifying problems at the intersection, justifying the need for improvements, and providing improvement concepts to advance into the preliminary design and engineering stages.


The MPO identified several intersections that should be prioritized based on the following criteria: safety conditions, multimodal significance, regional significance, transportation equity, geographical distribution, and implementation potential. Among the intersections selected for study was the intersection of Commerce Way/Presidential Way, Atlantic Avenue, and the I-93 Exit 30 ramps in Woburn. Woburn, a suburban city in Middlesex County with a population of roughly 42,000, has seen significant growth in the neighborhood of the study intersection with further development anticipated over the next decade.


Land use in the area is mixed, with the majority of nearby uses being commercial, office, and industrial. Residential use is expected to increase over the next decade. The intersection is part of an area identified by the Metropolitan Area Planning Council and The City in their 2019 Equitable Transit Oriented Development plan and is proximate to Woburn’s 3A, commonly known as the Massachusetts Bay Transportation Authority (MBTA) Communities Act, zoning district that allows for higher levels of density by right.1 ,2 Within three-quarters of a mile of the intersection there are 675 residential units permitted or under construction in addition to 325,000 square feet of lab space. In addition, a new bridge across the MBTA railroad tracks connecting two segments of New Boston Street will improve connectivity to destinations west of the study intersection.


MPO staff identified this intersection from the Statewide Top 200 Crash Locations Database. This intersection ranks 96th among the top 200 crash clusters 2018–20 and is also within the top five percent crash clusters 2018–20. Between 2018 and 2020, there were 32 crashes at this intersection—13 injury crashes and 19 non-injury crashes.


The intersection’s jurisdiction is shared between MassDOT and the city, with MassDOT maintaining control of the highway on/off ramps and the city having jurisdiction over the other three approaches. Both indicated support for a study of this intersection, as did the neighboring town of Wilmington.


The intersection is critical to multimodal transportation in the region. While the vast majority of people passing through the intersection do so in a private vehicle, the intersection is the only access to the Woburn/Anderson Regional Transportation Center (RTC), which hosts commuter rail, Amtrak, and Logan Express services. Active modes of transportation, such as walking and biking, are less prevalent at the intersection but still present.


Existing Conditions

The intersection is located in northern Woburn, near the Wilmington town line. Figure 1 shows its location within the city.


Figure 1
Woburn Study Area
A map of the intersection of Commerce Way, Presidential Way, Atlantic Avenue, and I-93.


Commerce Way/Presidential Way is an important local road for commercial activity in Woburn. It runs mostly in a north-south direction and has two travel lanes in each direction with a raised median in the area of the study intersection. North of the intersection, Presidential Way slims to one lane in each direction with shoulders and no median. At the study intersection, the Commerce Way northbound approach expands to include a designated left turn lane and two designated right turn lanes. Presidential Way, the southbound approach, also expands to include two left turn lanes. The roadway is a commercial spine, running from I-95 Exit 54 and Mishawum Road at its southern terminus to the intersection with Woburn Street/New Boston Street at the Wilmington town line. Along this corridor are numerous commercial businesses, offices, and industrial uses, with a few new multifamily residential buildings dispersed throughout.


The I-93 Exit 30 ramps and its proximate connection to I-95 provide connectivity from the study intersection to regional destinations in all directions. Atlantic Avenue is a short local road running east-west and connects the study intersection to the Woburn/Anderson RTC. It carries significantly less volume than the other three approaches to the intersection.


Emblem 120—a 283-unit apartment complex—is located on the corner of Commerce Way and Atlantic Avenue. Across Atlantic Avenue is Sanctuary Medicinals, a marijuana dispensary, which was the destination for the majority of pedestrian trips observed during the site visit. On the eastern side of the intersection, both corner parcels are undeveloped plots with significant wetlands and the Aberjona River flowing through them in a southerly direction.


There are numerous commercial retail businesses just south of the study intersection, including Target, Petco, PetSmart, and Bob’s Discount Furniture, as well as a pediatric urgent care center.


Engagement Activities

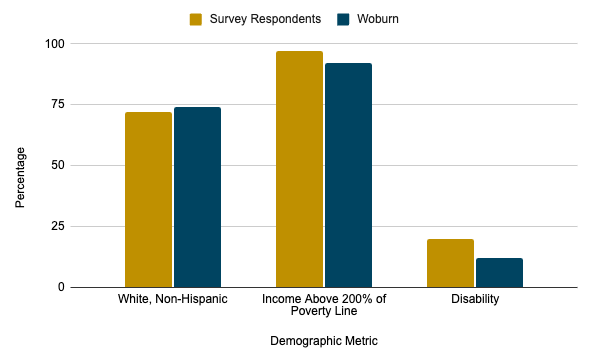
MPO staff coordinated with the City of Woburn to develop and distribute a public survey on conditions at the intersection. The survey included five questions regarding user safety. City staff and elected officials distributed the survey via digital platforms and via a flyer developed by MPO Staff at Emblem 120 and businesses near the intersection. The survey, which was open from January 21 to February 25, received 316 responses, 235 of whom completed the full survey. Staff collected demographic information from survey respondents. The majority of respondents (72 percent) identified as being white, having a household income 200 percent or more of the federal poverty line (97 percent), and not having a disability (80 percent) (Figure 2). Many respondents elected not to respond to the demographic questions. Full results of the survey can be found in Appendix A.


Figure 2
Respondent Demographics Versus Woburn


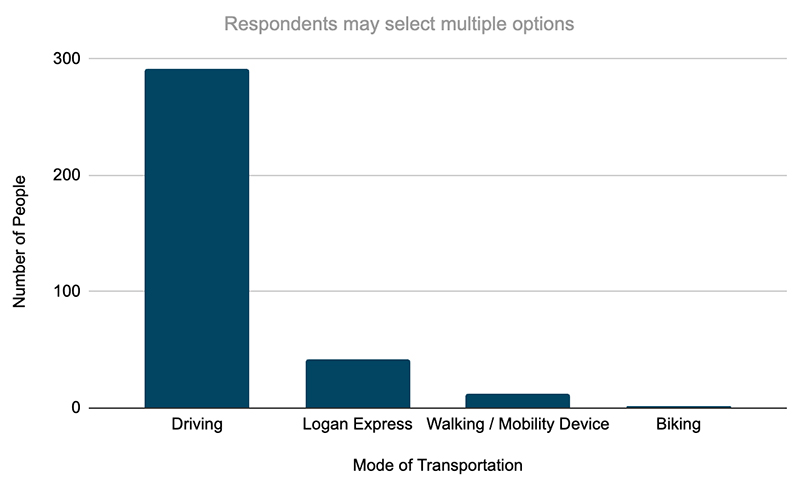
Out of 296 responses, the vast majority of respondents (292) drive. Other methods include taking the Logan Express (42), walking/using a mobility device (12), and biking (2) (Figure 3).


Figure 3
How People Use the Intersection


Of 292 responses, common reasons for traveling through the intersection are for stores or restaurants (206), work (129), and accessing the Anderson RTC (96). Many “other” responses indicate travel to or from other regional destinations via I-93 (Figure 4).


Figure 4
Why People Use the Intersection

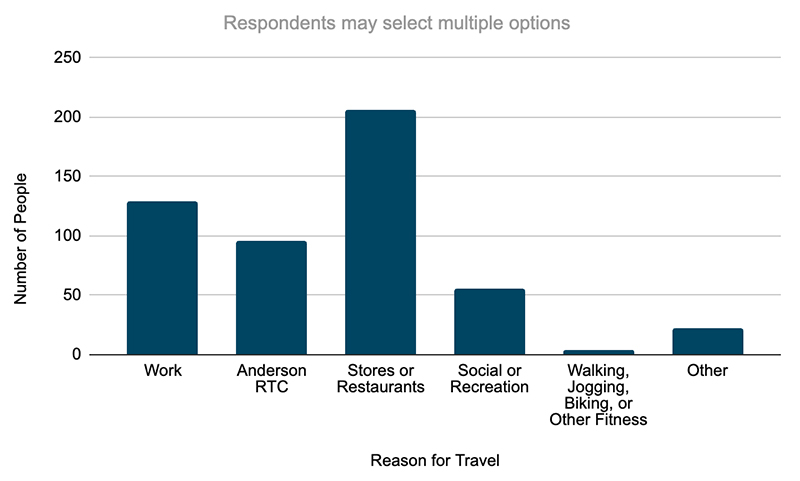
RTC= Regional Transportation Center.


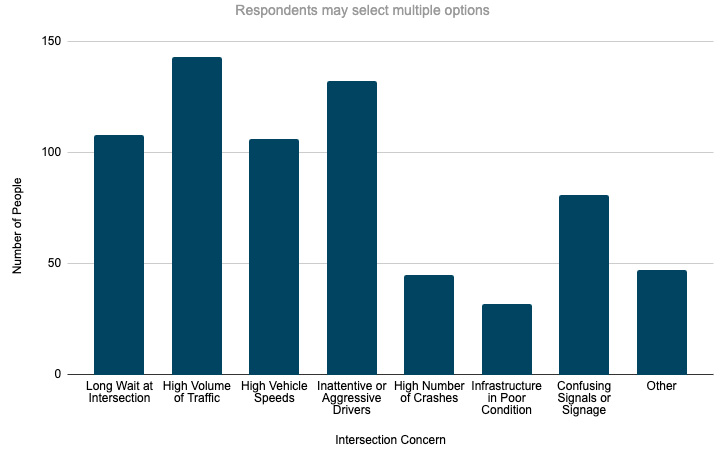
Based on 254 responses, the most frequently reported problems are high volume of traffic (143), inattentive or aggressive drivers (132), long wait at intersection (108), and high vehicle speed (106). Confusing signals or signage (81) and a high number of crashes (45) were also noted (Figure 5).


Figure 5
What Problems People Encounter at the Intersection


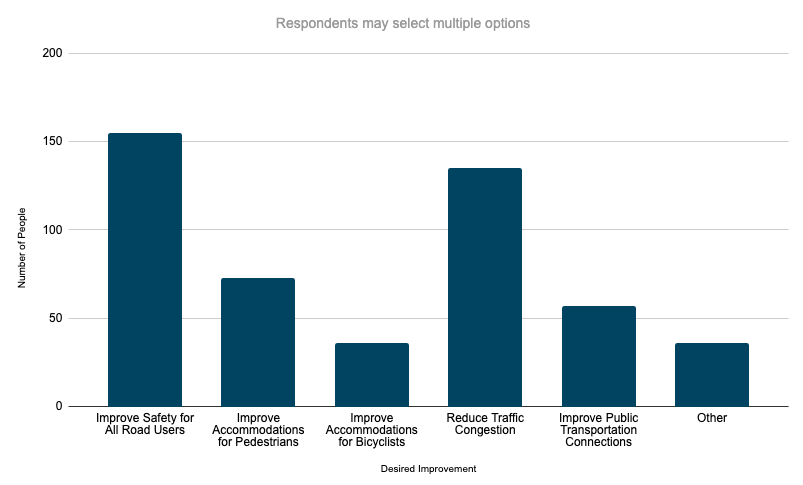
From 235 responses, the top desired improvements are to improve safety for all road users (155) and reduce traffic congestion (135). Improvements for pedestrians (73) and public transportation connections (57) were also requested (Figure 6).


Figure 6
Desired Improvements to Intersection


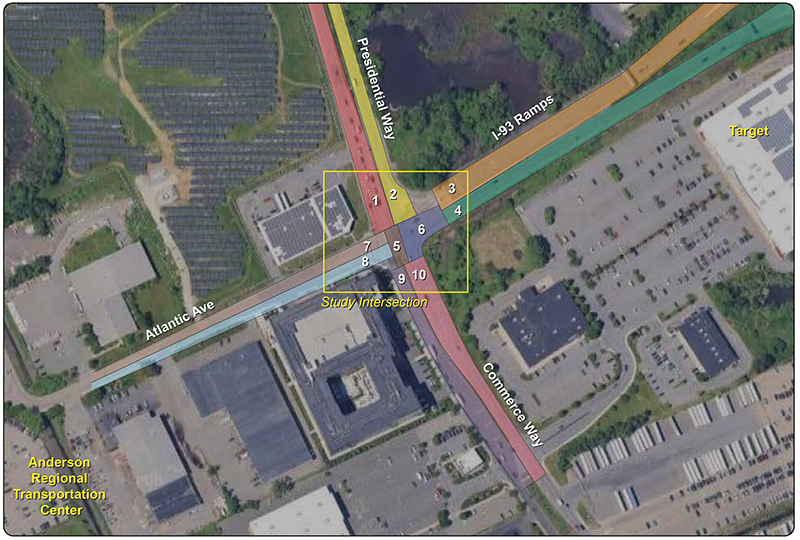
Respondents were also presented with a map of the intersection and asked to indicate areas where they felt unsafe. Zones 1, 6, and 10 received the most responses (Figure 7).


In addition to the public survey, a steering committee was formed consisting of municipal staff, residents, elected officials, and representatives from MassDOT and the Massachusetts Port Authority. The steering committee provided critical expertise and feedback to MPO staff throughout the study.


Figure 7
Public Survey Map Zones
Map showing the zones survey respondents were able to select to indicate feeling unsafe.


Daily Traffic Volumes

To examine the existing conditions, MPO staff requested MassDOT’s assistance

in collecting Automatic Traffic Recorder (ATR) counts on the approaches to this study. The ATR counts were performed during the week of December 3–10, 2024. Further detail of the ATR counts can be found in Appendix B.


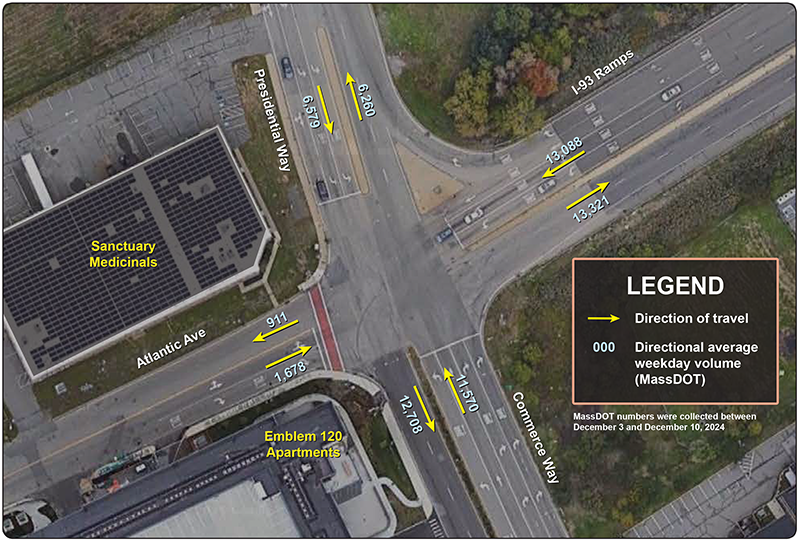
Based on the data, staff estimated the average weekday traffic volumes in roadway sections near the intersection as follows:


The City of Woburn also supplied turning movement counts using the ATR system that is installed at the intersection. The data taken used representative weekday periods of April 22–26, 2024, and September 16–20, 2024. Unfortunately, these counts contained discrepancies, and the data was not used for this analysis. Figure 8 displays traffic counts from MassDOT on all approaches. 


Figure 8
Average Annual Daily Traffic
Map showing the average weekday daily traffic on each leg of the intersection.


Turning Movement Counts

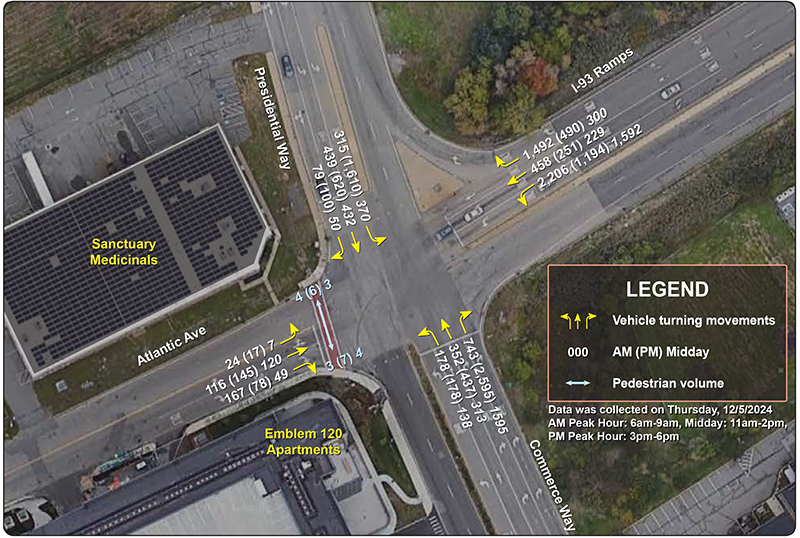
MassDOT collected turning movement counts at the study intersection on Thursday, December 5, during the AM (6:00–9:00 AM) and PM (3:00–6:00 PM) Peak Periods. Counts were also collected for the weekend Midday (11:00 AM–2:00 PM) Peak period on Saturday, December 7. Pedestrian crossings were also collected for these periods. Figure 9 summarizes the peak hour traffic turning volumes by approach at the intersection.


AM Peak Period travel is defined by people traveling from I-93 to jobs at points north and south at the study intersection, with a smaller but significant group traveling to the Anderson/Woburn RTC to the west of the intersection. The PM Peak Period is defined by a reverse travel pattern, with most traffic being made of people traveling from points north and south to access I-93 east of the intersection. Full turning movement count data is available in Appendix C.


Figure 9
Turning Movement Counts
Map showing the turning movement counts at peak hours for each intersection approach.


Speed Data

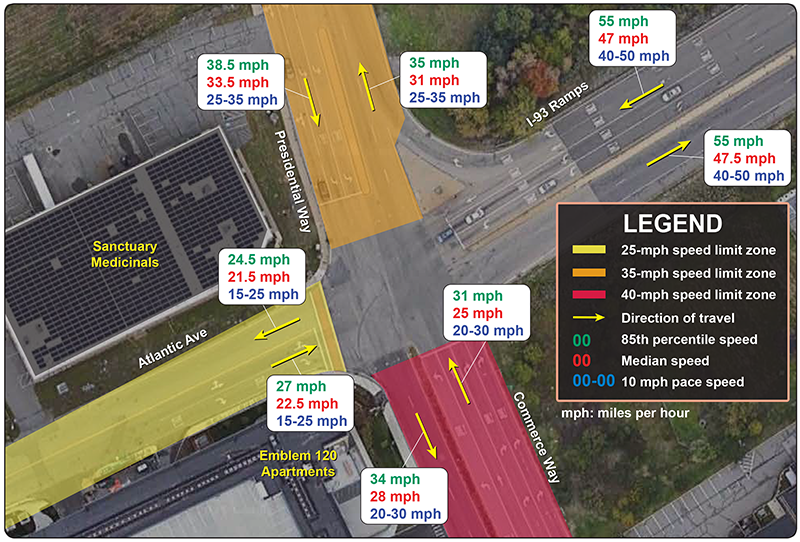
While collecting traffic volumes, MassDOT ATRs also recorded vehicle speeds at the approaches to the intersection, summarized in Figure 10. Speed limits vary at the approaches, ranging from 25 miles per hour (mph) on Atlantic Avenue to 40 mph on Commerce Way.


Speeds on Commerce Way were well below the posted speed limit, with median speeds of 25 mph (northbound) and 28 mph (southbound). At 31 mph (northbound) and 34 mph (southbound), 85th percentile speeds were also well below the posted speed limits.


On Atlantic Avenue and Presidential Way, observed speeds were in line with the posted speed limit, with 85th percentile speeds on Atlantic Avenue of 24.5 mph (westbound) and 27 mph (eastbound). Presidential Way, which has a posted speed limit of 35 mph, saw 85th percentile speeds of 35 mph (northbound) and 38.5 mph (southbound), indicating that there is some speeding among the fastest drivers on this segment.


The I-93 Exit 30 on/off ramps do not have a posted speed limit. However, MassDOT’s Project Development and Design Guide states, “The transition between high-speed driving on the mainline and safe operating speed on the minor road should take place on the ramps. Ramp and intersection design should require the driver to adopt a safe speed before entering the minor road.”3 This is not taking place under existing conditions, as the observed median speed for westbound traffic leaving the highway was 47 mph, with an 85th percentile speed of 55 mph. This is 16.5 mph faster than the next fastest observed 85th percentile speed on any approach. Full speed data can be found in Appendix D.


Figure 10
Speed Measurements
Map showing the median speed, 85th percentile speed, and 10mph speed range for each leg of the intersection.


Crash Data

MPO staff used the most recent six-year crash reports (January 2019–November 2024) for this study. Typically, five years of crash data is used, but an additional year of crash data was collected to account for the COVID-19 pandemic effects on vehicular travel. Data was obtained using MassDOT’s IMPACT Crash Portal and City of Woburn Police Department records. Note that this period includes data from before, during, and after the COVID-19 pandemic, which may influence results. In addition, these are only reported crashes and feedback from the community; the Woburn Police Department indicates that there could be unreported crashes at the study intersection within the six-year period that was used.


There were 86 crashes in the six-year period at the study intersection, which has been identified on MassDOT’s top crash locations map. Most crashes occurred directly in the intersection, but there were a few pockets of crashes at the Commerce Way approach, on Presidential Way just north of the intersection, and on the I-93 on-ramp just east of the intersection. More than one-half of the crashes (46) were angle collisions, while the next highest category of crashes were sideswipes (15). Of the 86 crashes, 33 of them (38 percent) resulted in injuries, with no fatalities. Daylight and weather did not appear to be major contributors to crash frequency, with 19 of the crashes (22 percent) occurring during the night and 17 (20 percent) occurring during adverse weather. Crashes were much more frequent during the PM peak period (26) and midday peak period (23) than during the AM peak period (11). The remaining 26 crashes occurred outside of peak periods.


The intersection was recently identified in the MPO’s Vision Zero High Priority Network, scoring in the 79th percentile as a priority investment area for the region due to its high traffic volumes, high crash rate, and its proximity to regional transportation infrastructure such as I-93 and the Anderson RTC.


Table 1 summarizes the crashes in terms of severity, collision type, vulnerable road user involvement, time of day, weather, and pavement conditions. Full crash data from the IMPACT Portal is available in Appendix E.


Table 1
Crash Summary at the Intersection of Commerce Way, Presidential Way, Atlantic Avenue, and I-93 Exit 30 Ramps

Statistics Period

2019

2020

2021

2022

2023

2024*

Six-Year

Total

Annual

Average

Total number of crashes

8

13

15

13

15

22

86

14.3

Severity

Property damage only

7

7

11

11

7

10

53

8.8

Non-fatal injury

1

6

4

2

8

12

33

5.5

Fatality

0

0

0

0

0

0

0

0.0

Not reported/unknown

0

0

0

0

1

0

1

1.7

Collision type

Single vehicle

0

1

1

0

1

2

5

0.8

Rear-end

1

0

2

2

2

0

7

1.2

Angle

4

8

5

9

9

11

46

7.7

Sideswipe, same direction

3

1

3

2

1

4

14

2.3

Sideswipe, opposite direction

0

0

2

0

0

0

2

0.3

Head-on

0

1

1

0

0

2

4

0.7

Rear-to-rear

0

0

0

0

0

0

0

0.0

Front-to-front

0

1

0

0

0

3

4

0.7

Front-to-rear

0

0

1

0

3

0

4

0.7

Not reported/unknown

0

1

0

0

0

0

1

0.2

Involved pedestrian(s)

0

0

0

0

0

1

1

0.2

Involved cyclist(s)

0

0

0

0

0

0

0

0

Occurred during weekday peak periods**

7

10

11

9

10

13

60

10.0

Wet or icy pavement conditions

1

4

5

2

2

3

17

2.8

Dark conditions (lit or unlit)

1

4

2

2

5

5

19

3.2

* 2024 data does not include the month of December.

** Peak periods are defined as 6:00 AM–9:00 AM, 11:00 AM–2:00 PM, and 3:00 PM–6:00 PM

Source: Central Transportation Planning Staff.


Collision Diagram and Crash Pattern Analysis

Based on police reports, staff constructed a collision diagram (Figure 11) that shows the location and patterns of all the crashes at the intersection. Redacted crash reports are available in Appendix F.


Figure 11
Collision Diagram: Commerce Way at Exit 30, Woburn
Map diagramming the collisions at the intersection by crash type.


Intersection Capacity Analysis

Based on the AM and PM peak period turning movement counts, staff conducted a capacity analysis for the study intersection by using the Synchro traffic analysis and simulation program.


Staff conducted the traffic operations analysis consistent with the Highway Capacity Manual (HCM) methodologies. HCM methodology demonstrates driving conditions in terms of delay at signalized and unsignalized intersections via level-of-service (LOS) ratings from A through F. It is vital to note that LOS is only measuring one component of an intersection’s performance and is not assigning an overall grade for the intersection. LOS A represents free flowing conditions with little to no delay, while LOS F at a signalized intersection represents a delay of more than 80 seconds per vehicle. LOS E represents operating conditions at capacity. Table 2 summarizes the delays, LOS, and queue lengths for the existing conditions. The Synchro capacity analysis can be found in Appendix G.


Table 2
Intersection Capacity Analysis

Approach

AM Delay
(seconds)

AM
LOS

AM Queue
(feet)

PM Delay
(seconds)

PM
LOS

PM
Queue
(feet)

Commerce Way (NB)

24.2

C

78

10.5

B

85

Atlantic Avenue (EB)

23.2

C

31

32.3

C

36

Presidential Way (SB)

35.1

D

90

44.7

D

189

I-93 Exit 30 Ramps (WB)

12.8

B

176

25.5

C

125

All approaches

18.3

B


25.3

C


EB = eastbound. LOS = level of service. NB = northbound. SB = southbound. WB = westbound.

Source: Central Transportation Planning Staff.


Future Conditions

While analyzing the existing conditions provides a snapshot of how the intersection is currently performing, analyzing the future conditions is critical to proactively addressing the anticipated impacts of growth and development in the area and to responding to long-term trends in travel demand, land use, and network performance.


Future conditions are typically based on regional growth forecasts, planned developments, and anticipated changes to the transportation network. This helps ensure that recommended improvements are not only effective today but remain functional and safe over the long term.

Background Growth Rates and Known Developments

As described in the study background, significant growth is expected within the area of the intersection over the next seven years, the forecast period. The intersection is part of an area identified by the Metropolitan Area Planning Council and The City of Woburn in their 2019 Equitable Transit Oriented Development plan. The intersection is also proximate to Woburn’s 3A, commonly known as the MBTA Communities Act, zoning district that allows for higher levels of density by right. Within three-quarters of one mile of the intersection there are 675 residential units permitted or under construction in addition to 325,000 square feet of lab space. In addition, a new bridge across the MBTA railroad tracks connecting two segments of New Boston Street will improve connectivity to destinations west of the study intersection.


As these zoning changes and the new bridge will enable the possibility of significant development, a background growth rate of 1 percent was applied to intersection volume. This is consistent with the 2022 traffic impact assessment (TIA) developed for 216 New Boston Street.


In addition, known developments are permitted or under construction at 0 New Boston Street (250 units), 316 New Boston Street (425 units), and 216 New Boston Street (325,000 square feet of lab space). The impacts of these developments are applied in addition to the background growth rate listed above. The volume increases generated by these developments was drawn from either TIA produced by the developer, in the case of 216 New Boston Street, or for the developments where a TIA was not available, standard methodologies from the Institute of Transportation Engineers (ITE) Trip Generation Manual, 11th Edition, was used to develop an estimation of traffic impact. A 10 percent non-auto mode share was assumed for both multifamily developments due to proximity to the regional transportation center. Final assigned trip distributions within the intersection were based on expected travel patterns, with a majority directed to and from the I-93 corridor. Table 3 summarizes the assumed impacts on the intersection from each development.


Table 3
Future Development Trip Generation at Study Intersection

Development

AM Peak

PM Peak

0 New Boston Street

73

89

216 New Boston Street

52

62

316 New Boston Street

36

44

Source: Central Transportation Planning Staff, Vanasse &
Associates, Inc.


Future Conditions Capacity Analysis

Using the background growth rate and assigned trips described in the previous section, MPO staff prepared a future conditions capacity analysis using the same methodology described under section 2.6 for the existing conditions. The results of this are summarized in Table 4. The Synchro future conditions capacity analysis can be found in Appendix H.


Table 4
Intersection Capacity Analysis

Approach

AM Delay
(seconds)

AM
LOS

AM Queue
(feet)

PM Delay
(seconds)

PM
LOS

PM
Queue
(feet)

Commerce Way (NB)

24.3

C

85

11.5

B

110

Atlantic Avenue (EB)

25.7

C

31

32.4

C

37

Presidential Way (SB)

36

D

112

61.2

E

225

I-93 Exit 30 Ramps (WB)

15.1

B

209

22.1

C

136

All approaches

20.8

C


29.8

C


EB = eastbound. LOS = level of service. NB = northbound. SB = southbound. WB = westbound. 

Source: Central Transportation Planning Staff.


The analysis demonstrates that anticipated developments will have the greatest impact on the Presidential Way, or southbound, approach to the intersection, pushing it to near capacity during PM peak hours. The intersection should be able to absorb anticipated development; however future development north of the intersection should consider significant transportation demand management measures to minimize further stress on the southbound approach.


Other Future Development Considerations

This future conditions analysis focused exclusively on the impact to the intersection from the perspective of motor vehicles and maintaining throughput. However, the area’s growth potential is primarily through multifamily, transportation-oriented development of modest density, including a potential major development at the Anderson/Woburn RTC.4 Future development may lead to increased volumes of people walking, biking, or taking other forms of active transportation through the intersection. Under existing conditions there is a minimal amount of pedestrian activity and almost no micromobility activity, so future growth beyond that described here may lead to safety or capacity concerns not considered in this analysis.


Issues and Concerns

Based on staff’s field observations, discussions with City officials, public engagement results, and analyses of crash data and existing operations, major issues at the intersection were identified as the following:


Ongoing Interventions

During the study, MPO staff were made aware of ongoing interventions at the study intersection to address some of the issues listed in section 4.


Sanctuary Medicinals Access from Presidential Way

In mid-2023, Sanctuary Medicinals voluntarily reconfigured access to its establishment such that all incoming traffic must enter from Atlantic Avenue and exit via Presidential Way. Since that intervention was implemented and access from Presidential Way was restricted, no crashes have been recorded at the cluster north of the intersection described in section 4 as of July 2025. With more than two years without a recorded crash, MPO staff consider this concern to have been successfully addressed.


Changes to Intersection Signal Timing Pattern

During the field visit for this study in October 2024, staff from the City of Woburn and the MPO observed operations at the intersection. It was noted that the permissive northbound right turn alongside the westbound green light was leading to confusion for northbound drivers who wanted to proceed straight. In response, shortly after the field visit, staff at the City of Woburn piloted a revised signal timing pattern that eliminated the northbound green arrows for right turns, instead permitting previously unpermitted right turns on red and granting northbound traffic an exclusive phase.6


The pilot was a success, with only one angle crash at the intersection being recorded between the start of the pilot in late October 2024 and July 2025 and no major impact to traffic flow operations at the intersection. This is a reduction from 7.56 per year of this crash type over the six-year analyzed period to a rate of 1.2 per year since the implementation of the new traffic signal pattern. The new pattern was made permanent prior to the conclusion of this study. Given the reduction in this crash type observed over a 10-month period, MPO staff consider this concern to have been successfully addressed.


Proposed Improvements

Based on the above analyses, MPO staff developed a series of short- and long-term improvements to address safety at the intersection. The proposed short-term improvements generally can be implemented within a few years at a low cost. The proposed long-term improvements cover larger areas, require intensive planning and design, and require more significant funding. As the City of Woburn does not have jurisdiction over the westbound highway ramp approach to the intersection, coordination with MassDOT will be required for implementation of any improvements to that approach.


Proposed Short-Term Improvements

The proposed short-term improvements are summarized below and shown in Figure 12. The first three of these listed can be completed by the municipality, while the latter three will require coordination with MassDOT.


Proposed Long-Term Improvements

The proposed long-term improvements are summarized below and shown in Figure 13. These will require significant cost and/or planning to implement.

Figure 12
Short-Term Improvements
Map visualizing the short term recommendations.


Figure 13
Long-Term Improvements
Map visualizing the long term recommendations.


Conclusion

This study of the intersection of Commerce Way/Presidential Way, Atlantic Avenue, and the I-93 Exit 30 ramps identified key safety and operational issues currently affecting the intersection and evaluated the impact of anticipated future development on intersection performance. The study found that while the intersection currently operates at acceptable levels of service, existing design elements contribute to frequent and sometimes severe crash patterns, particularly angle and sideswipe collisions.


Several of these issues—most notably, signal timing patterns that led to northbound angle crashes and unsafe driveway access north of the intersection—have already been addressed through proactive interventions by the City and local stakeholders. These changes have yielded promising safety benefits and demonstrate the value of coordinated low-cost improvements.


Future conditions analysis indicates that development within the study area will place increasing pressure on the intersection, particularly along the Presidential Way (southbound) approach. While the intersection is likely to remain functional with these growth assumptions, further development north of the study area should incorporate transportation demand management measures and a broader multimodal access strategy.


To address current and future needs, MPO staff developed a suite of recommended short- and long-term improvements. These include striping, signage, and speed management treatments, as well as more intensive infrastructure changes that would enhance intersection clarity and reduce conflict. Many of the short-term improvements can be implemented quickly and at low cost, while the long-term concepts provide a foundation for future capital projects and coordination with MassDOT.


Together, these recommendations offer a practical roadmap to improve safety, support regional mobility, and accommodate planned growth consistent with the City’s transportation and land use goals.


Appendices

Appendix A: Survey Questions and Responses

Appendix B: ATR Counts

Appendix C: Turning Movement Counts

Appendix D: Speed Data

Appendix E: IMPACT Portal Crash Data

Appendix F: Redacted Crash Reports

Appendix G: Existing Conditions Capacity Analysis

Appendix H: Future Conditions Capacity Analysis


CIVIL RIGHTS NOTICE TO THE PUBLIC

Welcome. Bem Vinda. Bienvenido. Akeyi. 欢迎. 歡迎

You are invited to participate in our transportation planning process, free from discrimination. The Boston Region Metropolitan Planning Organization (MPO) is committed to nondiscrimination in all activities and complies with Title VI of the Civil Rights Act of 1964, which prohibits discrimination on the basis of race, color, or national origin (including limited English proficiency). Related federal and state nondiscrimination laws prohibit discrimination on the basis of age, sex, disability, and additional protected characteristics.


For additional information or to file a civil rights complaint, visit www.bostonmpo.org/mpo_non_discrimination.


To request this information in a different language or format, please contact:


Boston Region MPO Title VI Specialist

10 Park Plaza, Suite 2150

Boston, MA 02116

Phone: 857.702.3700

Email: civilrights@ctps.org


For people with hearing or speaking difficulties, connect through the state MassRelay service, www.mass.gov/massrelay. Please allow at least five business days for your request to be fulfilled.


1 Metropolitan Area Planning Council. North Suburban Planning Council, “Woburn Commerce Way E-TOD Plan + 40R.” PowerPoint Presentation. June 20, 2019. Accessed on April 28, 2025.

2 City of Woburn. MBTA Communities. Woburnma.gov. Accessed on April 28, 2025.

3 Massachusetts Department of Transportation. Project Development and Design Guide, Chapter 7—Interchanges | Mass.gov, accessed June 10, 2025.

4 Massport. Multi-Agency JV Puts Out RFI for Transportation Center in Woburn. February 27, 2025. Accessed on February 28, 2025.

5 The Insurance Institute for Highway Safety (IIHS) and The Highway Loss Data Institute (HLDI) Speed. Updated July 2025. Accessed on July 23, 2025.

6 The early implementation of the pilot allowed MPO staff to utilize the revised signal timing pattern for the capacity analyses described in sections 2.6 and 3.2.

7 More information on the process for rescinding a special speed regulation may be found at https://www.mass.gov/info-details/about-the-role-of-speed-limits. Accessed on August 26, 2025.